


The petroleum industry accounts for a significant portion of the clay market share. In oil-well drilling fluids, clays are used as thixotropic agents (Bergaya & Lagaly, Reference Bergaya and Lagaly2013). Among the important functions of clays in the industry are cooling of the drills, generating a low-permeability layer on the geological formation and maintaining solid suspension (Caenn & Chillingar, Reference Caenn and Chillingar1996; Coussot et al., Reference Coussot, Bertrand and Herzhaft2004; Zhang et al., Reference Zhang, Xu, Christidis and Zhou2020). In water-sensitive drilling operations, the use of an oil-based fluid is often necessary (Bourgoyne et al., Reference Bourgoyne, Millheim, Chenevert and Young1991; Melton et al., Reference Melton, Smith, Mairs, Bernier, Garland and Glickman2004). In those processes, the clays lose their thixotropic properties. Thus, as clays are hydrophilic in their natural state, they cannot be used without undergoing a previous organic treatment to give them hydrophobic properties (Silva et al., Reference Silva, Sousa, Menezes, Neves, Santana and Ferreira2014).
Palygorskite (Plg; Warr, Reference Warr2020) is a 2:1 clay mineral that possesses a moderately high structural charge due to the replacement of Al3+ by Mg2+ and Fe2+ in the octahedral sheet. There are several types of active sites on the surface of Plg (Mu & Wang, Reference Mu and Wang2016), which play important roles in the adsorption of cationic surfactants. The exchangeable cations, which balance the excess of negative charges in the Plg structure, may interact with surfactant cations, at least on the external surfaces of Plg. Palygorskite displays a fibrous particle shape, a fine particle size with internal channels and a large specific surface area (Haden & Schwint, Reference Haden and Schwint1967; Cao et al., Reference Cao, Bryant and Williams1996; Galan, Reference Galan1996; Murray, Reference Murray2000; Bergaya et al., Reference Bergaya, Theng and Lagaly2006; Paiva et al., Reference Paiva, Morales and Díaz2008; Galan & Singer, Reference Galan and Singer2011; Brigatti et al., Reference Brigatti, Galan and Theng2013; García-Romero & Suárez, Reference García-Romero and Suárez2013; Wang & Wang, Reference Wang and Wang2016).
Many researchers have synthesized organo-Plgs for use in various fields (Sarkar et al., Reference Sarkar, Xi, Megharaj, Krishnamurti and Naidu2010, Reference Sarkar, Xi, Megharaj, Krishnamurti and Naidu2011; Middea et al., Reference Middea, Spinelli, Souza, Neumann, Fernandes and Gomes2017; Zhuang et al., Reference Zhuang, Wu, Zhang, Zhang, Zhang and Liao2017a, Reference Zhuang, Zhang, Jaber, Gao and Peng2017b). Sarkar et al. (Reference Sarkar, Xi, Megharaj, Krishnamurti and Naidu2010) synthesized organo-Plgs using dimethyldioctadecylammonium bromide (DMDOA) and cetylpyridinium chloride (CP) surfactants to remove p-nitrophenol (PNP) from aqueous solutions. The organophilic Plg improved PNP adsorption efficiency. Palygorskite modified with octadecyl trimethylammonium bromide (ODTMA) and dioctadecyl dimethylammonium bromide (DODMA) was used for the removal of anionic dyes from wastewater (Sarkar et al., Reference Sarkar, Xi, Megharaj, Krishnamurti and Naidu2011). Zhuang et al. (Reference Zhuang, Wu, Zhang, Zhang, Zhang and Liao2017a) evaluated the rheological properties of organo-Plg for use in oil-based drilling fluids and their resistance to heat. The Plg was modified organically with three cationic surfactants: octadecyl trimethyl ammonium chloride (C18-A), benzyl dimethyl octadecyl ammonium chloride (C18-B) and dimethyl dioctadecyl ammonium chloride (DC18). Organo-Plg fluids presented excellent rheological properties due to the formation of a good network structure. Finally, Zhuang et al. (Reference Zhuang, Zhang, Jaber, Gao and Peng2017b) studied the differences in the structures and properties between organo-montmorillonite and organo-Plg in oil-based drilling fluids and verified that organic surfactants are capable of intercalating into the interlayer of montmorillonite, while Plg can only adsorb surfactants on its surface.
The objective of this work is to determine the optimal content of Plg for organophilization with surfactant cetyltrimethyl ammonium bromide (CTAB) and to propose the adsorption mechanism. The vast majority of previous work achieved organophilization by considering clay cation-exchange capacity (CEC). This study aims to obtain organophilization by adjusting the amount of adsorbent so that a greater adsorption of surfactant takes place, thus achieving more efficient organophilization.
Materials and methods
Adsorbent and adsorbate
This study was carried out with samples of Plg clay from the São Pedro mines (Baltar et al., Reference Baltar, Luz, Baltar, Oliveira and Bezerra2009), State of Piauí, Brazil. The cationic surfactant CTAB (≥98% purity) was purchased from Sigma-Aldrich.
Characterization
The chemical composition of the Plg sample was determined by X-ray fluorescence (XRF) spectrometry (1800 Shimadzu), and the mineralogical composition of the sample was determined by X-ray diffraction (XRD; 7000 Shimadzu). Thermal analysis was performed using a thermogravimetric analyser and simultaneous calorimeter (model SDTQ600, TA Instruments) with a heating ramp of 20°C min–1, a nitrogen atmosphere, a platinum crucible and a maximum temperature of 1000°C. Initially, the Plg sample was subjected to vibration sieving. The 200 mesh fraction was used in subsequent analyses.
Adsorption test
Optimal palygorskite content
The adsorption assays were carried out using a finite bath, whereby each Plg sample (1.3, 3.8, 6.3, 8.8, 12.5, 15.0, 18.8, 21.3 and 25.0 mass%) was added to a CTAB solution and stirred at 200 rpm on a shaking table for 1 hour at 25°C. After a subsequent 24 h resting period, supernatants were collected and centrifuged for spectrophotometric analyses. The concentration of CTAB in the supernatant was determined using an analytical curve constructed from absorbance measurements in a UV5100 Metash Instruments spectrophotometer. Tests were carried out for various concentrations at the wavelength of 221 nm. The mathematical model that fitted the absorbance against the surfactant concentration (in g L–1) data generated a curve that was used to determine the surfactant concentration based on the measured absorbance.
Adsorption isotherm
The experiments used various concentrations of CTAB (6.5, 12.5, 18.5, 27.5 and 36.5 g L–1), a fixed content of Plg (3.4 mass%) and a set contact time (60 min) under constant stirring at 25°C. To determine surfactant concentrations, samples were stirred and supernatants were collected and centrifuged for each experiment. All procedures and analyses were performed in duplicate.
The effects of time, temperature and pH on the adsorption were studied at constant CTAB and Plg contents. The contact times were 1, 2, 3, 4, 5, 10, 20, 30, 60, 90, 120, 150, 180 and 240 min and the temperatures were 25, 40 and 60°C. In each experiment, all samples were stirred, and the supernatants were collected and centrifuged to determine the surfactant concentration.
The adsorption capacity (q, in mol g–1) was calculated from Equation 1 (Cooney, Reference Cooney1999):

where C 0 is the initial surfactant concentration (mol L–1), C e is the concentration of the surfactant in the filtrate (mol L–1), V is the solution volume (L) and m is the mass of the adsorbent (g).
The experimental data were fitted to Langmuir, Freundlich, Dubinin–Radushkevich (D–R) and Tempkin isotherms (Tempkin & Pyzhev, Reference Tempkin and Pyzhev1940; Dubinin & Radushkevich, Reference Dubinin and Radushkevich1947; Treybal, Reference Treybal1980; Atkins, Reference Atkins1994; Cooney, Reference Cooney1999). These theoretical models follow linearized Equations 2, 3, 4 and 7, respectively.


where q m (mol g–1) is the adsorption capacity, KL (L g–1) is the equilibrium constant and KF and n are empirical constants, which indicate the adsorption capacity and the intensity of the adsorption energy, respectively.
The D–R model is as follows:
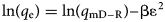
where q e is the amount of adsorbate adsorbed (mol g–1), q mD–R is the theoretical saturation capacity (mol g–1), β is the constant related to the mean free energy of adsorption per mole of the adsorbate (mol2 J–2) and ε is the Polanyi potential given by:

where R is the universal gas constant (8.314 J mol–1 K–1), T is the absolute temperature (K) and C eD–R is the concentration of the adsorbate at equilibrium (mol L–1). The mean free energy of adsorption (E) per molecule of the adsorbate, when it is transferred to the surface of the sorbent from infinity in the solution (kJ mol–1), was calculated from the following equation (Dubinin & Radushkevich, Reference Dubinin and Radushkevich1947; Davoodi et al., Reference Davoodi, Taheran, Brar, Galvez-Cloutier and Martel2019):

The linearized Tempkin equation is given by Equation 7 (Tempkin & Pyzhev, Reference Tempkin and Pyzhev1940):

where

bT is the Tempkin constant related to the heat of adsorption (kJ mol–1) and AT is the Tempkin adsorption potential (mol g–1). Tempkin constants AT and bT are calculated from the slope and intercept of q e vs ln(C e), respectively.
Thermodynamic parameters
The thermodynamic parameters were calculated from Equations 9, 10 and 11 (Fu et al., Reference Fu, Zhu, Dong, Zhao and Wang2021):


where Kd is the equilibrium adsorption distribution constant, ΔG is the free energy change value of adsorption (J mol–1), ΔH is the enthalpy change of adsorption (J mol–1), ΔS is the adsorption entropy change (J mol–1 K–1) and C e is the equilibrium solution concentration (mol L–1) when the adsorption capacity is q e.
Effects of pH
The pH point of zero charge (pHPZC) was determined using 08 flasks containing 3.4 mass% Plg in CTAB (6.5 g L–1), adding solutions of HCl (1.0 mol L–1) or NaOH (1.0 mol L–1) to change the initial pH between 1 and 10. The pH was measured after shaking the suspensions for 60 min at 25°C. The pHPZC value was determined by plotting the initial pH vs the final pH, which was assigned to the zone where the pH did not change drastically and did not depend on the initial pH. All analyses were performed in duplicate.
Results and discussion
Characterization
The XRD analyses were performed on the original Plg and on the Plg organophilized with 6.5 g L–1 CTAB. The XRD trace shows the presence of Plg and quartz in the original clay sample, as confirmed by Baltar et al. (Reference Baltar, Luz, Baltar, Oliveira and Bezerra2009), Sousa et al. (Reference Sousa, Silva, Sousa, Sousa, Fonseca, Osajima and Silva-Filho2019) and Santanna et al. (Reference Santanna, Silva, Silva and Castro Dantas2020) (Fig. 1).
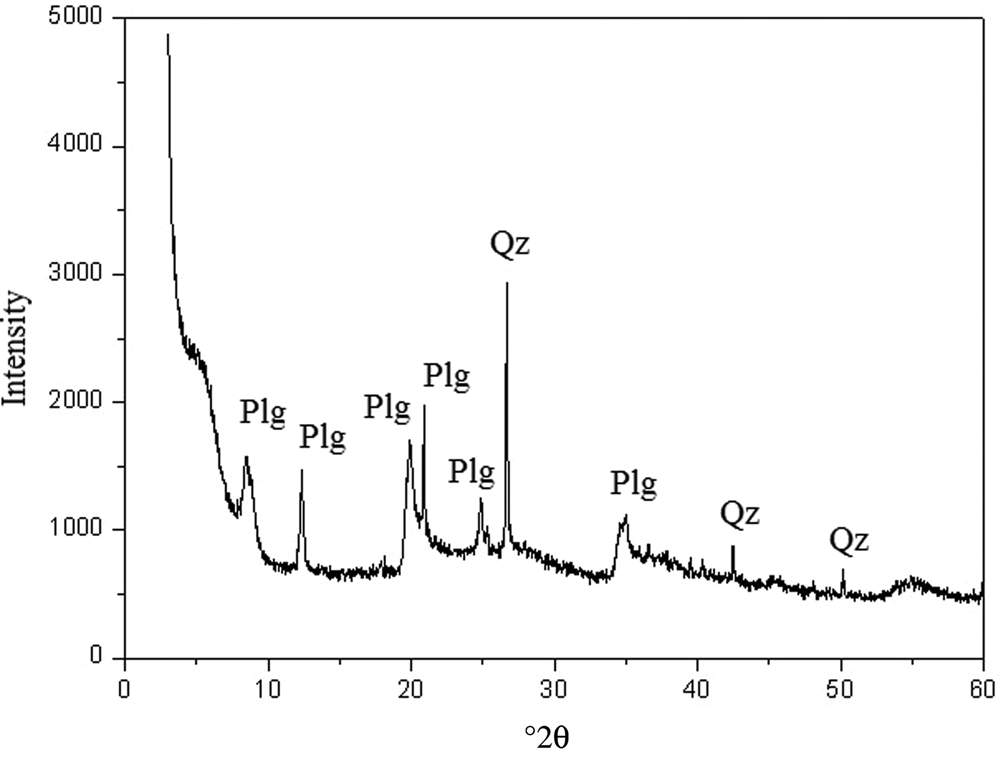
Fig. 1. XRD trace of the original clay sample. Qz = quartz.
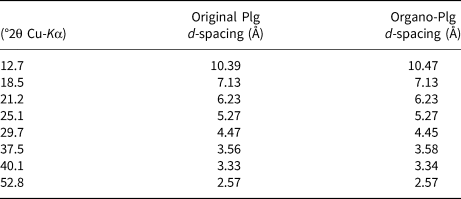
The basal spacings of the samples are listed in Table 1. The modification with 6.5 g L–1 CTAB surfactant did not affect the crystal structure of Plg because the d spacings for the Plg did not change. Hence, the surfactant was only adsorbed on the surface of Plg crystals (Chen & Zhao, Reference Chen and Zhao2009; Bhatt et al., Reference Bhatt, Sakaria, Vasudevan, Pawar, Sudheesh, Bajaj and Mody2012).
Table 1. Basal spacing of the original Plg and organo-Plg (6.5 g L–1 CTAB).
The chemical composition of Plg is listed in Table 2 as mass percentages. The main constituents are SiO2, Al2O3, Fe2O3 and MgO. Traces of Na2O, BaO and P2O5 are also present. The very low concentration of calcium oxide in the sample suggests the absence of calcite, an accessory mineral that is commonly associated with Plg.
Table 2. Chemical composition of the Plg sample from Piauí (Brazil).
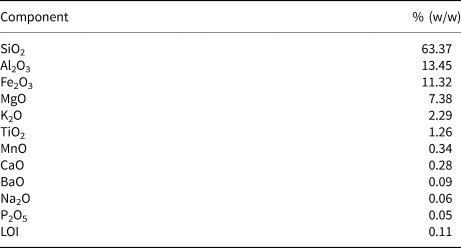
LOI = loss on ignition.
The thermal curves of the original Plg (Fig. 2a) and organo-Plg (6.5 g L–1 CTAB) (Fig. 2b) were similar to those reported in previous works (Baltar et al., Reference Baltar, Luz, Baltar, Oliveira and Bezerra2009; Moreira et al., Reference Moreira, Ciuffi, Rives, Vicente, Trujillano and Gil2017; Zhuang et al., Reference Zhuang, Wu, Zhang, Zhang, Zhang and Liao2017a, Reference Zhuang, Zhang, Jaber, Gao and Peng2017b). Three thermal decomposition events were observed. The first mass loss at 50–120°C (Event A) is associated with the desorption of water adsorbed on the external surface, followed by the loss of zeolitic water at 200–300°C (Event B) and the elimination of coordination water and structural hydroxyls (Event C) at >400°C (Baltar et al., Reference Baltar, Luz, Baltar, Oliveira and Bezerra2009). The original Plg showed a first mass loss of 8.6%, while the organo-Plg presented a 3.3% loss (Fig. 2c). The second mass loss step was <1% in the original Plg and 7.9% in organo-Plg. This event corresponds to the decomposition of CTAB (Zhuang et al., Reference Zhuang, Wu, Zhang, Zhang, Zhang and Liao2017a). The third step represented a 5.1% loss in the original Plg and a 7% loss in the organo-Plg and was due to dehydroxylation of Plg (Moreira et al., Reference Moreira, Ciuffi, Rives, Vicente, Trujillano and Gil2017).
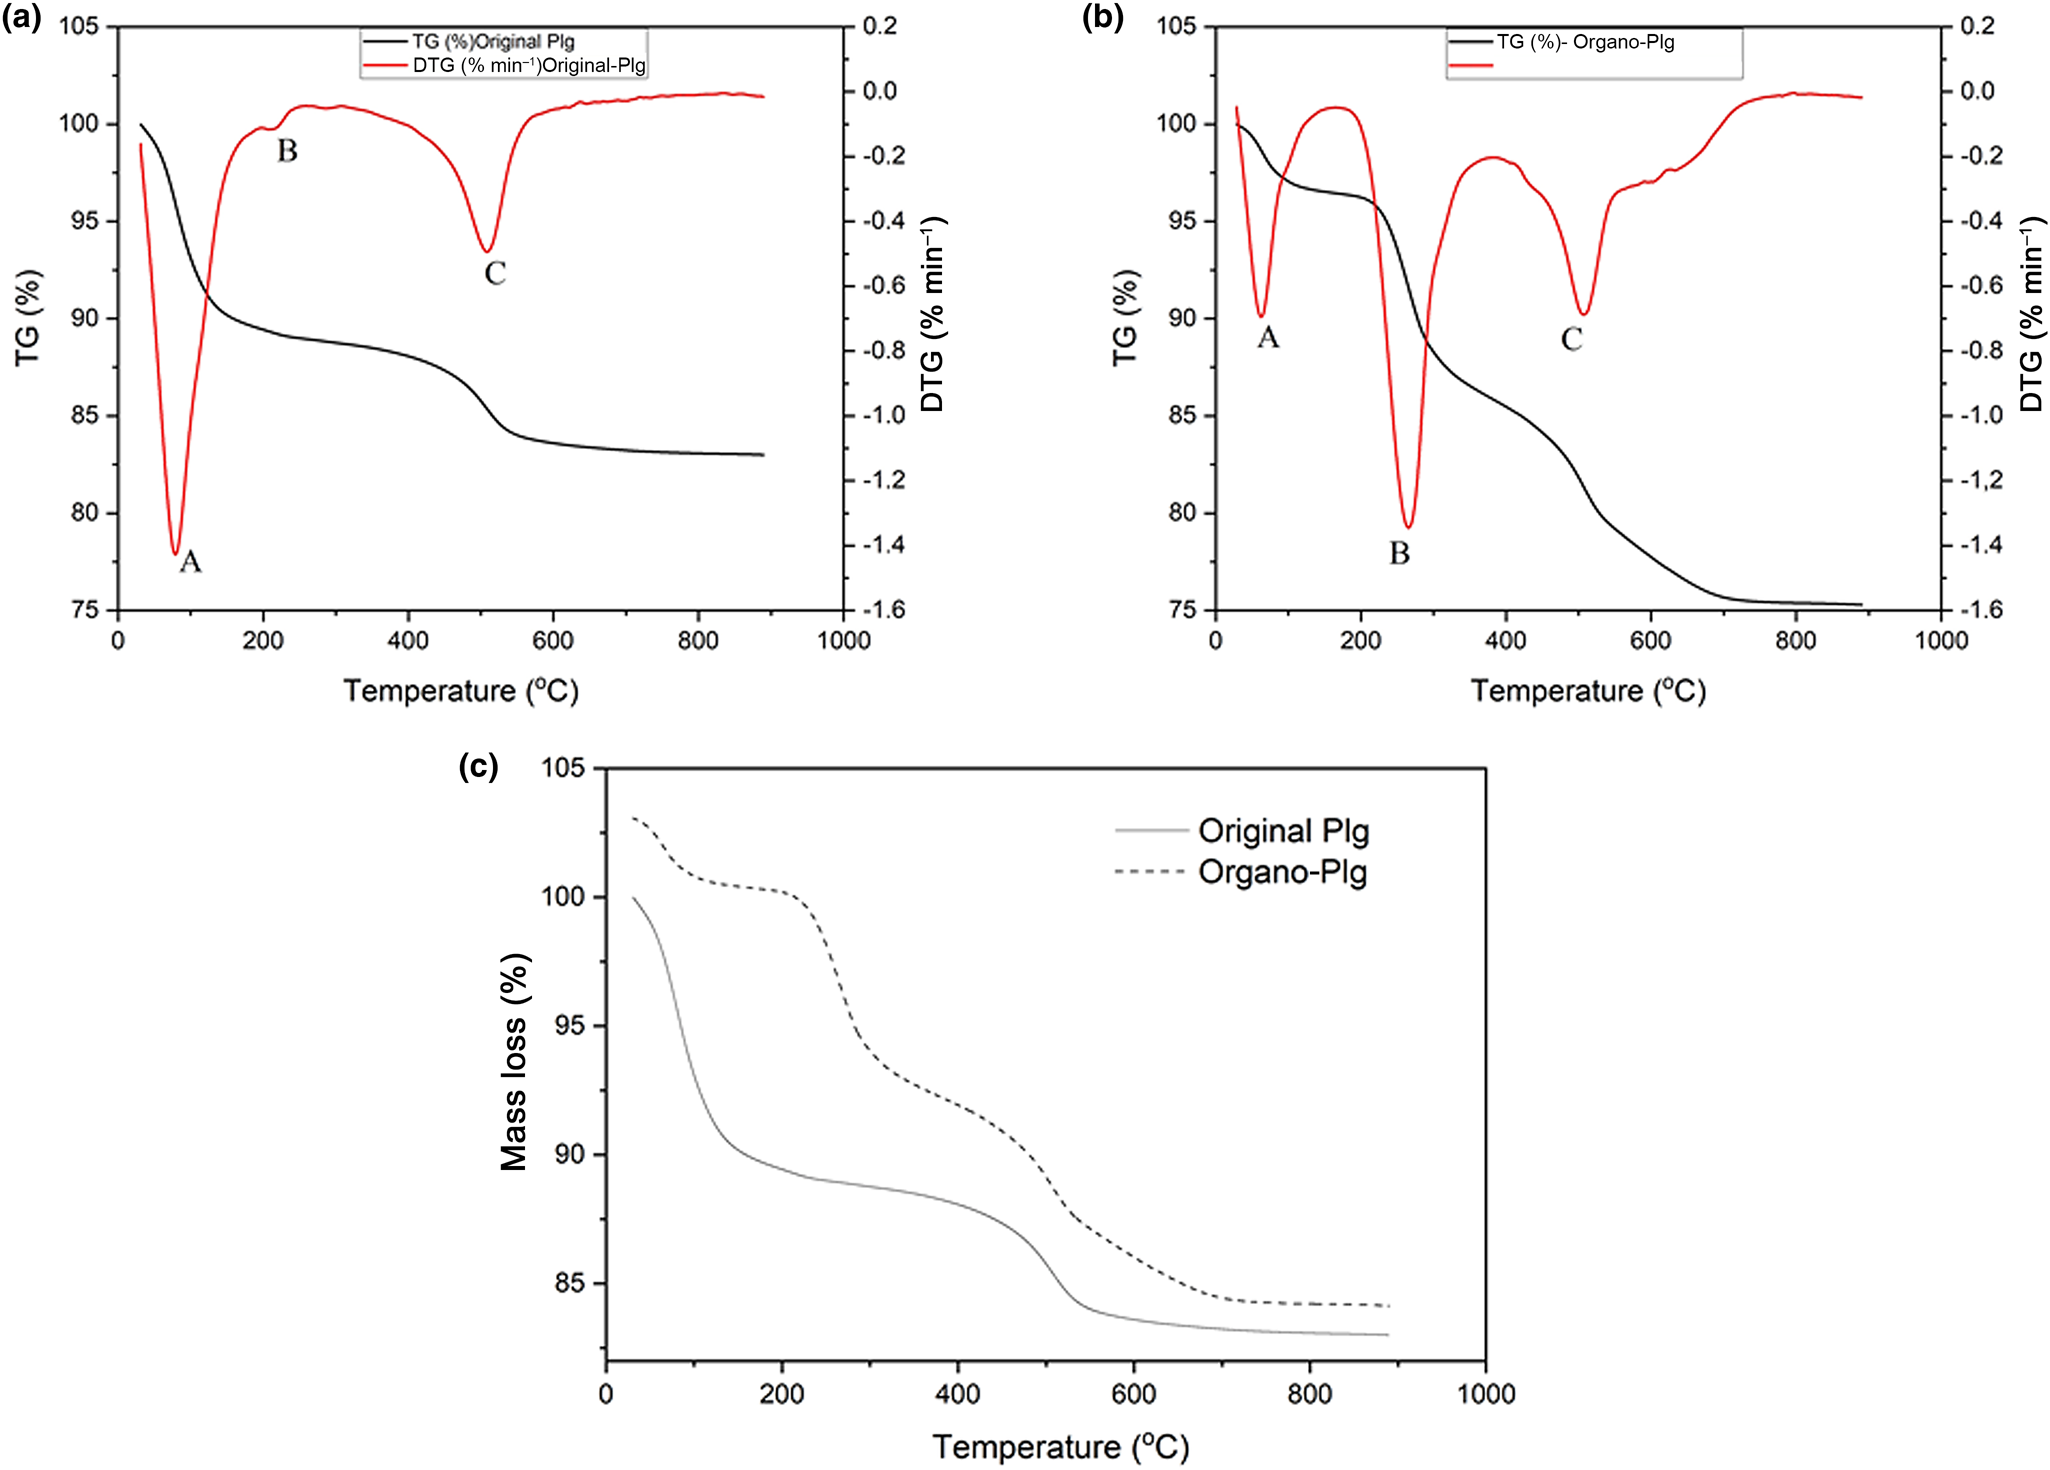
Fig. 2. Thermal analysis (thermogravimetry (TG)/derivative thermogravimetry (DTG)) of the original Plg (upper left) and organo-Plg (upper right) (6.5 g L–1 CTAB). The lower graph depicts the TG curves of the two samples for comparison.
Optimal content of palygorskite
The empirical mathematical model that best fitted the analytical data established a relationship between the CTAB concentration (C, in g L–1) with absorbance (Abs, in arbitrary units) (Equation 12), with R 2 = 0.9976:

The concentration of CTAB adsorbed on Plg (C adsorbed) was then determined using Equation 13, which relates the initial solution concentration (C initial) with that obtained from the absorbance measurements:

The concentration of CTAB adsorbed on Plg as a function of the mass of Plg used in organophilization for various concentrations of CTAB (6.5–36.5 g L–1) is shown in Fig. 3. The optimal mass of Plg, at which there is greater adsorption of CTAB, varies with increasing CTAB concentration. The adsorption of CTAB on Plg reaches a maximum, and decreasing thereafter, for all CTAB concentrations. This occurred probably because the increase in clay content (mass%) increased the friction forces among the clays in the dispersion, favouring the surfactant desorption on the clay.
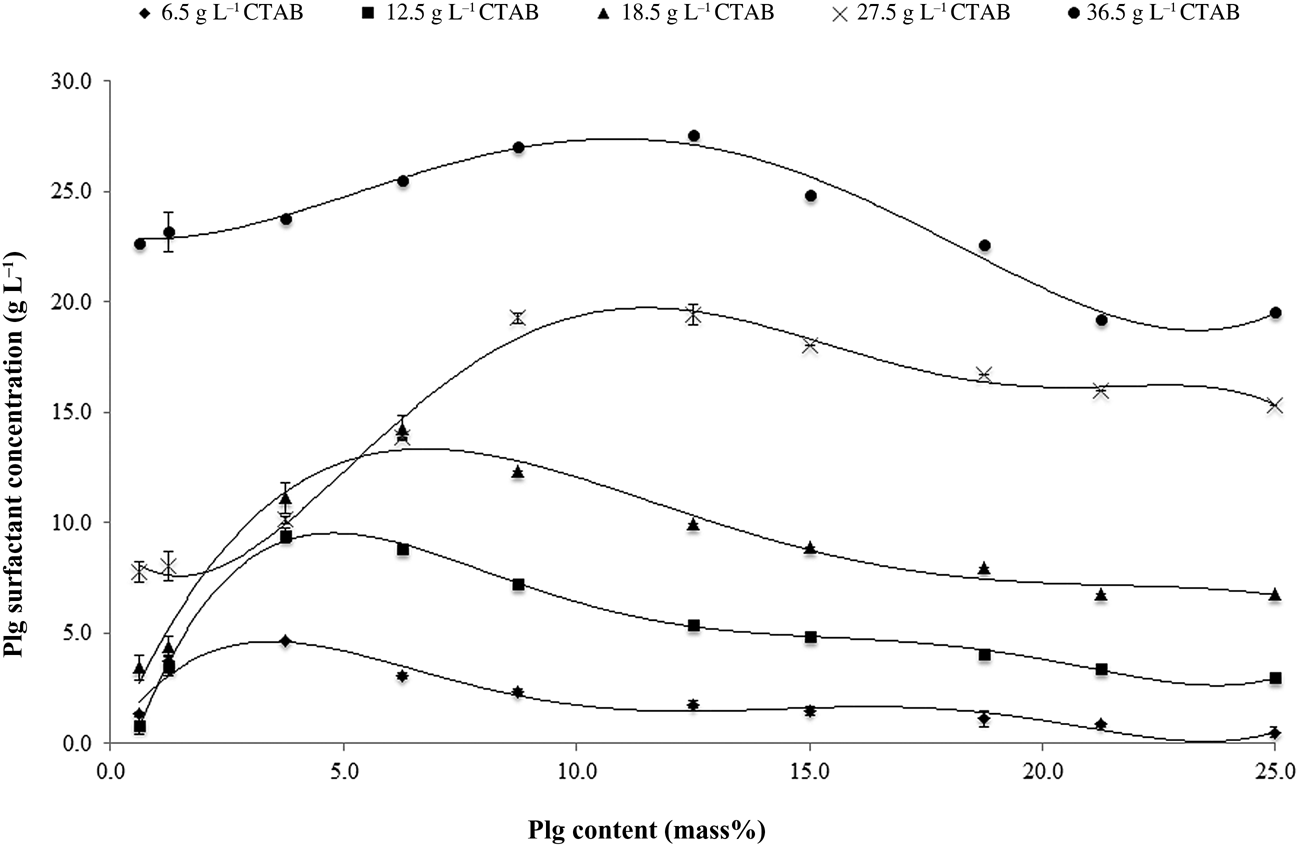
Fig. 3. Concentration of adsorbed CTAB vs Plg content.
For each surfactant concentration (Fig. 3), the experimental data were fitted with an empirical mathematical model and, by calculating the first and second derivatives of each equation, the Plg content for the point of maximal CTAB was determined. These results are listed in Table 3.
Table 3. Optimal content of Plg estimated from empirical mathematical models fitted as a function of CTAB concentration.
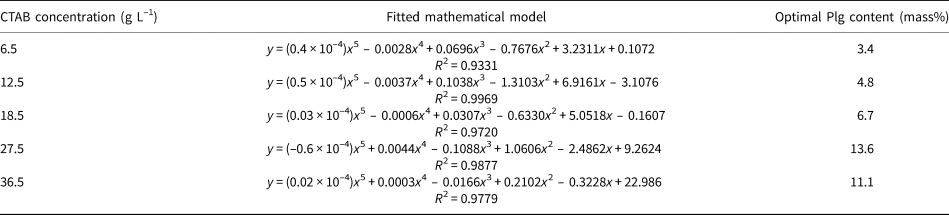
The Plg content for maximal CTAB adsorption increases with the increase in surfactant concentration up to 27.5 g L–1 and decreasing slightly for the greater CTAB concentration of 36.5 g L–1 (Table 3). The decrease in maximal adsorption for CTAB concentrations >27.5 g L–1 is attributed to the increasing friction forces between clays in the dispersion with increasing clay content (mass%), which hinder surfactant adsorption on Plg. Therefore, the optimal Plg contents are 13.6 and 11.1 mass% for CTAB concentrations of 27.5 and 36.5 g L–1, respectively. The optimal Plg content for organophilization, obtained from maximum CTAB adsorption data (Table 3), is shown in Fig. 4.
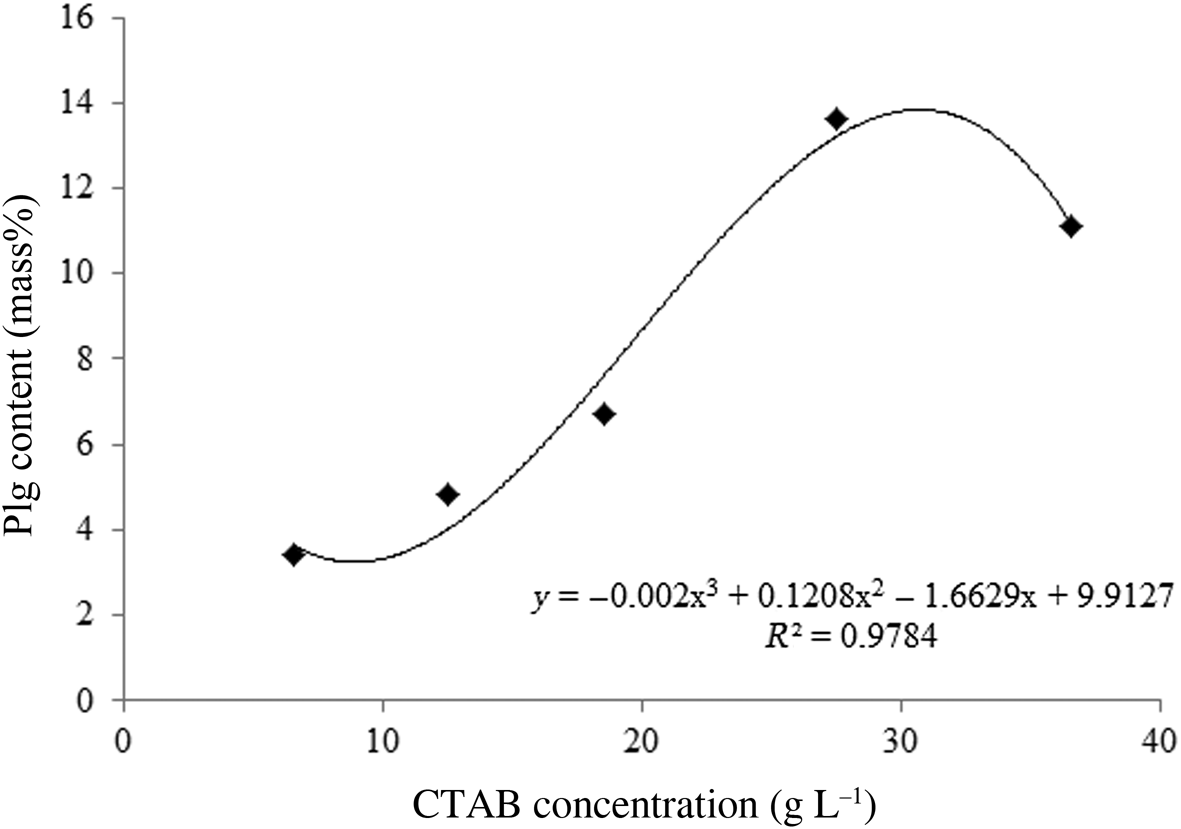
Fig. 4. Surfactant concentration vs optimal Plg content.
Equation 14 shows the empirical mathematical model that best fitted the experimental data of Fig. 4. The polynomial obtained indicates the Plg content (mass%) for which the maximum adsorption of CTAB is observed (C, in g L–1):

For CTAB concentrations of 6.5–36.5 g/L, it is possible to determine the Plg content required for each CTAB solution during organophilization. The concentration of 31.5 g L–1 CTAB demands a greater amount of clay for organophilization (i.e. ~14.9 mass%). Equation 14 optimizes the organophilization process of Plg with CTAB because it is possible to use the optimum amount of Plg to obtain the maximum adsorption of surfactant.
Adsorption isotherm
The Langmuir, Freundlich, D–R and Tempkin adsorption isotherms were tested to fit the Plg adsorption process. The parameters used to analyse the isotherms are listed in Table 4.
Table 4. Langmuir, Freundlich, D–R and Tempkin isotherm parameters for the adsorption of CTAB onto organo-Plg at 25°C.
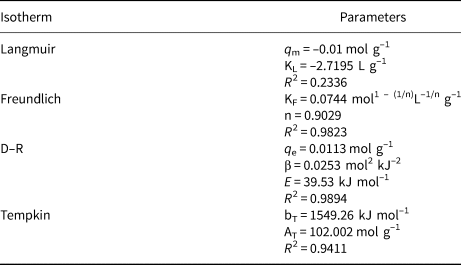
The experimental data did not fit the Langmuir isotherm (R 2 = 0.2336). In the Freundlich isotherm, the n parameter indicates the degree of non-linearity between the solution concentration and adsorption (Desta, Reference Desta2013); for n < 1 the adsorption is a chemical process (n = 0.9029; Table 4). This was confirmed by the D–R isotherm through the adsorption energy value (E = 39.53 kJ mol–1). The value of adsorption energy (E) obtained from the D–R plots is indicative of the nature of the adsorption process: values of E >16 kJ mol–1 are indicative of chemisorption (Sahu et al., Reference Sahu, Pahi, Sahu, Sahu and Kendu2020). The coefficient of determination (R 2) obtained from the Tempkin isotherm was 0.9411. The constant bT = 1549.26 kJ g–1 and the high value of the Tempkin adsorption potential AT is compatible with the chemical nature of the adsorption process (Pathania et al., Reference Pathania, Sharma and Singh2017; Odogu et al., Reference Odogu, Daouda, Keilah, Tabi, Rene, Nsami and Mbadcam2020). The organophilic Plg molecules form ‘haystack’ structures (Zhuang et al., Reference Zhuang, Wu, Zhang, Zhang, Zhang and Liao2017a). Surfactants are adsorbed on the surface of the Plg (Zhuang et al., Reference Zhuang, Wu, Zhang, Zhang, Zhang and Liao2017a). The polar heads of CTAB may be intercalated in the Plg channels or tunnels, and these intercalations ensure that the CTAB remains stable in the surface of the Plg (Zhuang et al. Reference Zhuang, Wu, Zhang, Zhang, Zhang and Liao2017a).
Finite-bath experiments were performed with a fixed adsorbent mass while changing contact time, temperature and pH. To make this possible, we used optimal Plg contents (3.4 mass%) and CTAB (6.5 g L–1). The variation in the amount of adsorbed matter is minimal within the studied time interval, and therefore the contact time does not represent a key parameter in the investigation (Fig. 5).
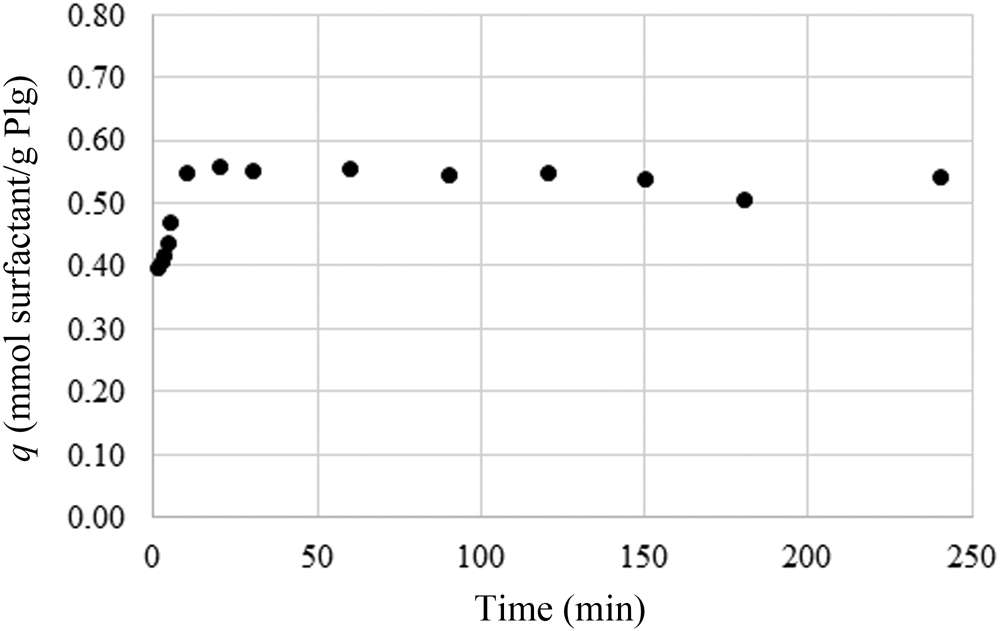
Fig. 5. Adsorption of CTAB (6.5 g L–1 solution) on the optimal Plg content as a function of contact time.
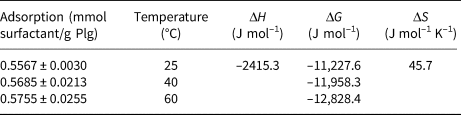
The CTAB adsorption on Plg increases slightly with increasing temperature (Table 5). An increase in adsorption with increasing temperature may occur for compounds in which the solubility decreases with increasing temperature (Chiou et al., Reference Chiou, Peters and Freed1979). This behaviour is explained by the thermodynamic parameters involved in the adsorption processes (Table 5). Indeed, the enthalpy of adsorption was –2415.3 J mol–1, indicating that the adsorption was exothermic, and the entropy was 45.7 J mol–1 K–1, which is favourable for spontaneous reactions. The free energy (ΔG < 0) at various temperatures demonstrates that the adsorption process was spontaneous. Both the ΔG and the driving force of adsorption increased with increasing temperature, illustrating that the greater the temperature, the faster the reaction.
Table 5. Adsorption of CTAB (6.5 g L–1 solution) on the optimal content of Plg as a function of temperature.
The influence of pH on adsorption is demonstrated in Table 6. The adsorption of CTAB on Plg was not affected by pHinitial values <6.4, but it decreased when the pHinitial values increased further. The pHPZC was determined, and the pHfinal readings are plotted as a function of pHinitial in Fig. 6. The pHfinal value of the resulting plateau was assigned to the pH at which there was no net OH− or H+ adsorption. At this pH, the difference between the initial and final [H+] or [OH−] is zero. The calculated pHPZC was 6.97 (Fig. 6). Therefore, at pH < 6.97, the Plg is positively charged, and at pH > 6.97, the Plg is negatively charged. The possible adsorption mechanism at below the pHPZC is CTAB multilayer adsorption (Fig. 7a), as was suggested by the Freundlich isotherm (Table 4). At above the pHPZC, the alkaline medium probably caused partial neutralization of the polar heads of CTAB, separating them from the apolar tails and decreasing adsorption on the Plg (Fig. 7b).
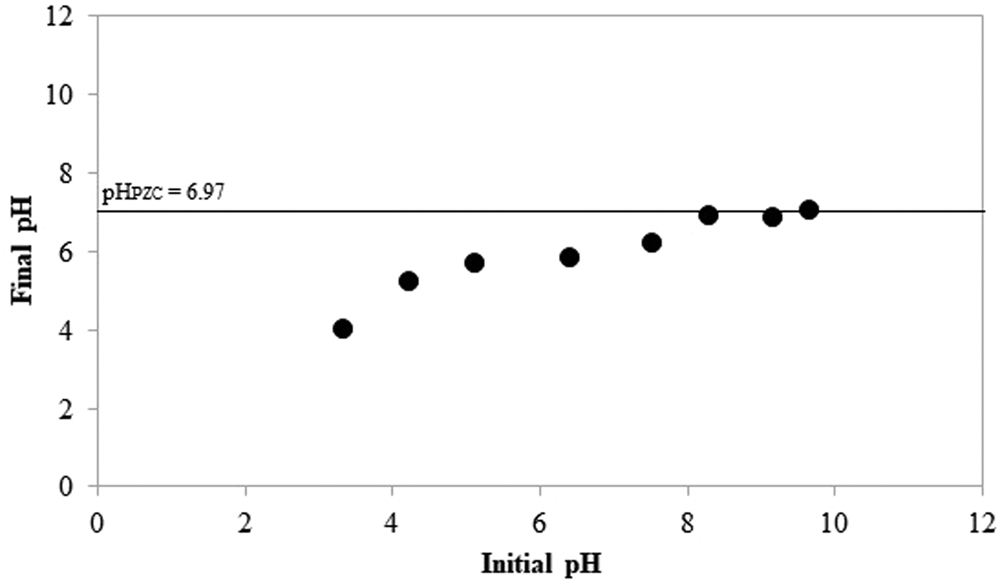
Fig. 6. pHPZC obtained from the finite-bath experiments of the Plg.
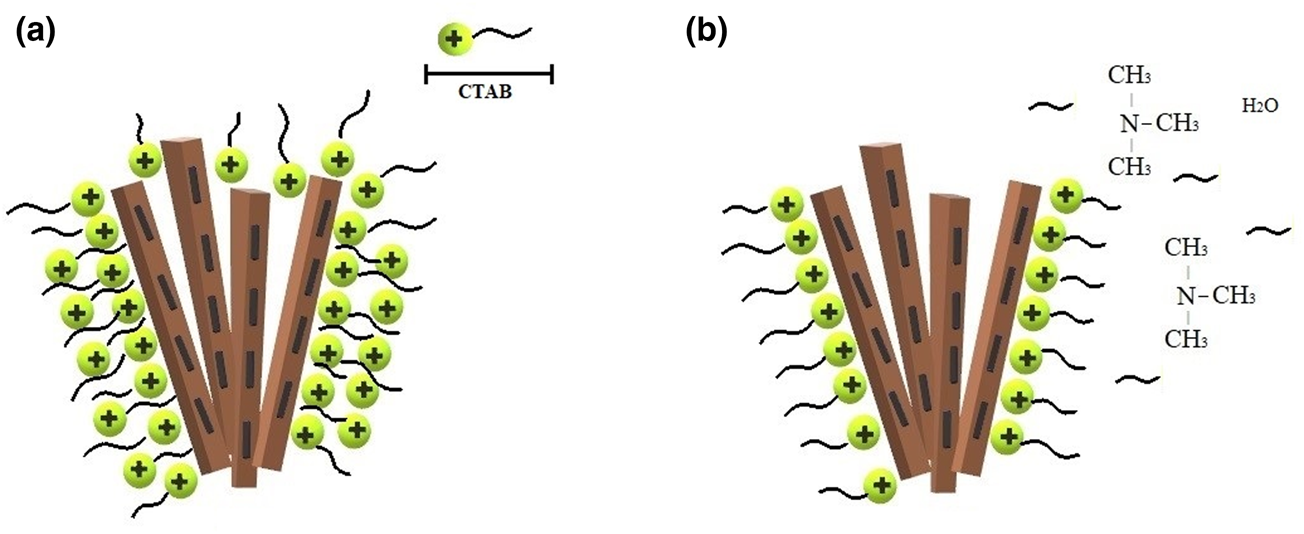
Fig. 7. Schematic representation of the CTAB adsorption mechanism on Plg: (a) at below the pHPZC, CTAB multilayer adsorption takes place; (b) at above the pHPZC, partial neutralization of the polar heads of CTAB occurs.
Table 6. Adsorption of CTAB (6.5 g L–1 solution) on the optimal Plg content as a function of initial pH.

Conclusion
In this investigation, it was possible to determine the optimal Plg content for organophilization using CTAB at concentrations ranging from 6.5 to 36.5 g L–1. For surfactant concentrations between 27.5 and 36.5 g L–1, the increase in clay content (mass%) rendered the adsorption of surfactant molecules for the organophilization of Plg difficult. The CTAB adsorption on Plg was of a chemical nature, exothermic and spontaneous, and it decreased with increasing initial pH. At below the pHPZC, the adsorption occurred in multilayers, whereas at above the pHPZC, the partial neutralization of the polar heads of CTAB hindered adsorption.
The results of this study contribute to the determination of the optimal Plg contents for each concentration of CTAB during organophilization. These optimal Plg contents also ensure that the surfactant will remain adsorbed on the clay, performing its function as a viscosity agent, which is fundamental to the preparation of oil-based drilling fluids.
Financial support
The authors thank CAPES for the financial support provided for this project.


