INTRODUCTION
The development of accelerator mass spectrometry (AMS) revolutionized the field of radiocarbon (14C) dating by reducing required sample sizes from grams to milligrams. This was an especially crucial improvement for the field of archaeology, and for decades the technique has been central for establishing reliable chronologies back to 50,000 cal BP (calibrated years before 1950). In order to produce enough high-quality collagen for AMS dating on solid targets, current pretreatment protocols for archaeological bone samples require ca. 500 mg material for collagen extraction, ultrafiltration, and graphitization (Longin Reference Longin1971; Brown et al. Reference Brown, Nelson, Vogel and Southon1988; Ramsey et al. Reference Bronk Ramsey, Higham, Bowles and Hedges2004a; Higham et al. Reference Higham, Jacobi and Bronk Ramsey2006; Talamo and Richards Reference Talamo and Richards2011). However, rare and precious bone samples of such antiquity (including Middle-Upper Paleolithic human remains, bone tools, worked bones and ornaments) are often small or fragmented and the destruction of even 500 mg would result in irreparable damage.
Several AMS labs have worked on developing techniques for measuring samples <0.5 mg carbon on graphite targets (Pearson Reference Pearson1998; Hua et al. Reference Hua, Zoppi, Williams and Smith2004; Santos et al. Reference Santos, Moore, Southon, Griffin, Hinger and Zhang2007a; Santos et al. Reference Santos, Southon, Griffin, Beaupre and Druffel2007b; Smith et al. Reference Smith, Petrenko, Hua, Southon and Brailsford2007; Ertun et al. Reference Ertun, Xu, Bryant, Maden, Murray, Currie and Freeman2005; de Rooij et al. Reference de Rooij, van der Plicht and Meijer2010; Genberg et al. Reference Genberg, Stenstrom, Elfman and Olsson2010; Smith et al. Reference Smith, Hua, Williams, Levchenko and Yang2010; Delqué-Količ et al. Reference Delqué-Količ, Caffy, Comby-Zerbino, Dumoulin, Hain, Massault, Moreau, Quiles, Setti, Souprayen, Tannau, Thellier and Vincent2013; Liebl et al. Reference Liebl, Steier, Golser, Kutschera, Mair, Priller, Vonderhaid and Wild2013; Walter et al. Reference Walter, Gagnon, Roberts, McNichol, Gaylord and Klein2015). However, the latest developments in AMS technology now offer an alternative solution for the high-precision measurement of samples of 100 µg carbon or less. AMS instruments with a gas ion source have offered a practical way to measure 14C since the 1980s (Middleton Reference Middleton1984; Bronk and Hedges Reference Bronk Ramsey and Hedges1987; Ramsey and Hedges Reference Bronk Ramsey and Hedges1997). The direct measurement of sample CO2 in a gas ion source cuts out the graphitization step, reducing the required sample size and risk of contamination while speeding up the dating procedure, making it a highly attractive prospect. Although successful in measuring 14C of small samples in environmental applications, the low ion currents obtained during initial use (<5 µA compared to currents of >40 µA using graphite) meant that the precision required for archaeological questions was not possible (Ramsey et al. Reference Bronk Ramsey, Ditchfield and Humm2004b; Uhl et al. Reference Uhl, Kretschmer, Luppold and Scharf2005). However, AMS has considerably improved over the past decade. The MICADAS (MIni CArbon DAting System), the first compact AMS with a hybrid ion source, was developed at ETH Zurich (Ruff et al. Reference Ruff, Wacker, Gaggeler, Suter, Synal and Szidat2007; Synal et al. Reference Synal, Stocker and Suter2007). Initial use demonstrated the extraordinary reproducibility and stability of the instrument, and thus its suitability for high-precision measurement (Wacker et al. Reference Wacker, Bonani, Friedrich, Hajdas, Kromer, Nemec, Ruff, Suter, Synal and Vockenhuber2010b). Measurements over a 2-yr period in Zurich indicated that contamination issues were much smaller for gaseous samples compared to small graphite samples, as well as more constant (Ruff et al. Reference Ruff, Szidat, Gäggeler, Suter, Synal and Wacker2010a). Following several years of operation, the gas ion source was updated for increased precision (Fahrni et al. Reference Fahrni, Wacker, Synal and Szidat2013). The MICADAS offers a way to measure gaseous samples of 5–100 µg carbon (Wacker et al. Reference Wacker, Fahrni, Hajdas, Molnar, Synal, Szidat and Zhang2013b), and the newest improvements resulted in a more than threefold increase of the ion current (15–20 µA) compared to the previous versions, essential for precision (Fahrni et al. Reference Fahrni, Wacker, Synal and Szidat2013; Hendriks et al. Reference Hendriks, Hajdas, McIntyre, Küffner, Scherrer and Ferreira2016).
These gas ion sources have thus far been utilized for the measurement of small (<100 µg carbon) and ultra-small (<10 µg carbon) samples of gaseous carbon from ice samples (Hoffmann Reference Hoffmann2016), aerosols (Zhang et al. Reference Zhang, Huang, El Haddad, Ho, Cao, Han, Zotter, Bozzetti, Daellenbach, Canonaco, Slowik, Salazar, Schwikowski, Schnelle-Kreis, Abbaszade, Zimmermann, Baltensperger, Prévôt and Szidat2015; Bonvalot et al. Reference Bonvalot, Tuna, Fagault, Jaffrezo, Jacob, Chevrier and Bard2016) and carbonates (Wacker et al. Reference Wacker, Lippold, Molnár and Schulz2013a; Bard et al. Reference Bard, Tuna, Fagault, Bonvalot, Wacker, Fahrni and Synal2015) where samples sizes were small (generally <30 µg C) but precision was not of highest concern. On the contrary, the gas ion source of the MICADAS has neither been tested for samples towards the limit of the method e.g. Middle-Upper Paleolithic transition, nor for collagen samples.
Our primary goal for this present study was therefore to test the instrument capabilities using this updated measurement technique specifically for collagen samples toward the 14C limit. In order to test the precision and accuracy achievable across the range of the 14C method, we converted collagen from medieval human bone and Pleistocene faunal bone samples to CO2 using three different preparatory techniques and dated them using the gas interface system (GIS) coupled to the gas ion source of AixMICADAS (Bard et al. Reference Bard, Tuna, Fagault, Bonvalot, Wacker, Fahrni and Synal2015). We present here a comparison of “routine” 2–3 mg collagen dates (≥1000 µg carbon on graphite targets) with dates from small gaseous samples of <100 µg carbon, demonstrating the reliable measurement of precise 14C dates across the breadth of the method with a greater than tenfold decrease in sample size.
METHODS
Archaeological Samples
We selected a human bone and a human tooth sample from two early medieval burial contexts in San Martino and Palazzo Fulcis, Northern Italy. In order to test the method on samples of Pleistocene age we selected mammoth and bison bones from Brown Bank on the North Sea plains. These samples were previously described and dated by Talamo and Richards (Reference Talamo and Richards2011).
Pretreatment
Many preparation issues concerning collagen yield, contamination, reproducibility, and blanks are associated with the extraction of small bone samples (<100 mg). However, as this paper focuses on the AMS measurement techniques, initially a large quantity of collagen was prepared as outlined below, and from these batches microgram-size samples were selected for MICADAS analysis. This strategy was adopted to allow us to differentiate between the instrumental limitations and those associated with the pretreatment of small bone samples. Pretreatment of <100 mg bone samples will be discussed elsewhere (Fewlass et al. in prep.).
Bones (500–700 mg material) were pretreated in the Department of Human Evolution at the Max Planck Institute for Evolutionary Anthropology in Leipzig, Germany (lab code: R-EVA), following our standard collagen pretreatment protocol: acid-base-acid followed by ultrafiltration (Talamo and Richards Reference Talamo and Richards2011). In order to monitor contamination introduced during the pretreatment stage, a background cave bear bone (R-EVA 800) kindly provided by D. Döppes (Mannheim, Germany) was extracted with each batch of samples (throughout we refer to measurements of this bone as “background,” in contrast to “blank,” which refers to blank instrumental levels). Elemental and stable isotopic data (C% and N% content, C:N, δ13C, and δ15N) of extracted collagen from all samples was measured in-house at the MPI-EVA. Collagen yields were sufficiently high from all samples to allow the collagen to be split into multiple aliquots and submitted for dating using a range of techniques (Table 1).
Table 1 Elemental and stable isotopic data (C%, N%, C:N, δ13C and δ15N), and collagen yields of the collagen extracts measured in-house at the MPI-EVA on a ThermoFinnigan Delta V Advantage isotope ratio mass spectrometer coupled to a Flash 2000 EA. Stable carbon isotope ratios were expressed relative to VPDB (Vienna PeeDee Belemnite) and stable nitrogen isotope ratios were measured relative to AIR (atmospheric N2), using the delta notation (δ) in parts per thousand (‰). Repeated analysis of both internal and international standards indicates an analytical error of 0.2 ‰ (1σ) for δ13C and δ15N.

Graphitization
Our initial step was to date the collagen via our regular dating routine. In order to obtain independent dates, collagen was sent to two AMS laboratories. Ca. 5 mg collagen from each sample was weighed into pre-cleaned tin cups at the MPI-EVA and sent to the Klaus-Tschira-AMS facility in Mannheim, Germany (lab code: MAMS). The samples were combusted in an elemental analyzer (EA) and CO2 was converted catalytically to graphite. The samples were dated using the MICADAS-AMS (Kromer et al. Reference Kromer, Lindauer, Synal and Wacker2013). The error calculation was performed using BATS software (Wacker et al. Reference Wacker, Christl and Synal2010a), with background collagen samples and standards used for the age calculation of the unknown samples, plus an added external error of 1‰, as per their standard practice (R. Friedrich, personal communication).
Collagen was also measured at the Centre de Recherche et d’Enseignement de Geosciences de l’Environnement (CEREGE) in Aix-en-Provence, France (lab code: AIX), where two samples of ca. 2 mg collagen from each bone were weighed into tin cups and graphitized using the AGE III (Automated Graphitization Equipment, IonPlus AG, Switzerland) (Wacker et al. Reference Wacker, Němec and Bourquin2010c) and dated using the AixMICADAS (Bard et al. Reference Bard, Tuna, Fagault, Bonvalot, Wacker, Fahrni and Synal2015). Oxalic acid standards and background collagen samples run in the same batch were used in the age calculation of the unknown samples. An additional external error of 1‰ was also propagated in the uncertainty calculation.
Conversion to CO2
We employed three methods of extracting and purifying CO2 from collagen in order to monitor sources of contamination and identify the optimum route.
Method 1. CEREGE in Aix-en-Provence: EA directly coupled to the gas ion source via zeolite trap
Four collagen aliquots (each 170 µg) from each bone sample were weighed into cleaned (800°C, 2 hr) silver cups. These were placed into the auto-sampler of an Elementar Vario MICRO cube EA (Elementar Analysensysteme GmbH, Germany) directly coupled to the gas ion source of the AixMICADAS via a gas interface system (GIS). Following combustion, sample CO2 was adsorbed on a zeolite trap. After heating of the trap, the CO2 was released and expanded to the syringe of the GIS (Ruff et al. Reference Ruff, Fahrni, Gäggeler, Hajdas, Suter, Synal, Szidat and Wacker2010b; Wacker et al. Reference Wacker, Fahrni, Hajdas, Molnar, Synal, Szidat and Zhang2013b).
Method 2. MPI-EVA in Leipzig: EA coupled to cryogenic gas collection system
For the second method of CO2 preparation, collagen was converted to CO2 at the MPI-EVA using a SerCon ANCA SL EA coupled to an Oxford gas collection system. From each sample four aliquots of 170 µg collagen were weighed out on a microbalance into cleaned (800°C, 2 hr) silver cups and placed in the auto-sampler of the EA. Samples were combusted and CO2 and N2 were separated. A small proportion of CO2 and N2 gas was diverted for isotopic measurement in a SERCON 20-20 mass spectrometer. The rest of the CO2 was diverted to the gas collection system where it was cryogenically purified and trapped into borosilicate glass ampoules (80 mm length, 4 mm diameter) which were flame-sealed. These ampoules were then measured by means of the cracker of the AixMICADAS in Aix-en-Provence (Wacker et al. Reference Wacker, Fahrni, Hajdas, Molnar, Synal, Szidat and Zhang2013b). Phthalic acid (≥99.5%) blank samples were run prior to and following sample runs. Blanks (cleaned silver cups) were run between aliquots to monitor instrumental contamination and purge the system.
Method 3. University of Heidelberg: sealed tube combustion and vacuum line
The extraction and purification of CO2 from bone collagen was also achieved manually using a vacuum line at the Institute of Environmental Physics, University of Heidelberg, adapted from the CARMEN (Carbon AeRosol Muffel Extraction liNe), designed by Hammer (Reference Hammer2003) for aerosol filters. This method was carried out for background and medieval samples only due to time constraints. Silver wool was inserted to the bottom of cleaned quartz tubes (150 mm length, 6.5 mm internal diameter; 850°C, 2 hr) to catch sulfur and halides during combustion. Collagen was weighed out using a microbalance and inserted to the bottom of the quartz tubes. Individual sample tubes were inserted into the vacuum line. The line was evacuated while the sample tube was heated to 70°C. The quartz tube was flooded with oxygen (450–550 mbar) and flame-sealed, as wire-form copper oxide was previously found to introduce tiny amounts of carbon to the sample (Hoffmann, personal communication). Samples were combusted for 6 hr at 800°C. Quartz tubes were then broken in the vacuum line and sample CO2 was isolated from the other combustion products using liquid nitrogen (77 K) and acetone dry ice (195 K) cold traps. The CO2 was trapped in a region of known volume and quantified through temperature and pressure readings. The sample was then cryogenically captured in the final sample ampoule (80 mm length, 4 mm diameter) which was flame-sealed, and measured via the cracker of the AixMICADAS.
AMS Measurement with the Gas Ion Source of AixMICADAS
Oxalic acid II NIST standards (gas canister) were measured to normalize and correct samples for fractionation and blank CO2 (gas canister) was measured to purge the system and check the blank level of AixMICADAS in gas configuration prior to measurement of samples (0.4 pMC threshold) (not used in sample age calculation). Samples containing carbonate reference material (blank IAEA-C1) were run prior to samples of method 1 to begin the measurement of old samples under optimal conditions. The different samples were measured in order of increasing activity (i.e. from oldest to youngest), as per standard procedure (Wacker et al. Reference Wacker, Lippold, Molnár and Schulz2013a). Sample CO2 released from the ampoules or zeolite trap was expanded to the syringe where it was mixed with He (5% CO2). The mixture was introduced to the gas ion source at a flow rate of ca. 2 µg C/min. The system was flushed with helium between samples. The target magazine can hold up to 39 new titanium (Ti) gas targets which can be changed during measurement. Targets were pre-sputtered for ca. 2 minutes in the ion source to remove any remaining surface contamination before the sample CO2 injection. All steps of the process were fully controlled via the gas-interface handling software. In the software BATS (Wacker et al. Reference Wacker, Christl and Synal2010a) the uncorrected background collagen samples (cave bear bone R-EVA 800) were used in the age calculation of the four unknown archaeological samples (shown in Tables 3–6).
The gas ion source of the MICADAS has been predominantly used for measuring samples limited by C amount (<30 µg C), whereas for collagen samples a reduction in sample size to 50–100 µg C still represents a sizeable decrease compared to standard dating on graphite targets (>500 µg C). Therefore, for this exploratory test relatively large samples were combusted in order to reach maximum precision. However, as any C above the limit of 100 µg C in the syringe after combustion/cracking leads to a flushing of excess sample, only around 170 µg collagen (ca. 70–80 µg C) was measured out. During measurement only 30–40 µg C was consumed for the AMS due to a typical degradation of the Ti target performance (Fahrni et al. Reference Fahrni, Wacker, Synal and Szidat2013) and the rest was lost. In future we would measure out a suitable sample size (30–40 µg C in 70–80 µg collagen) for one target. The measurement of a large sample (>40 µg C) over a second or even a third Ti target has been performed on carbonate samples using the AixMICADAS with positive outcomes (Fagault et al. Reference Fagault, Tuna, Rostek and Bard2017; Tuna et al. Reference Tuna, Fagault, Bonvalot, Capano and Bard2017). Although this was not carried out for collagen samples during this preliminary study, such a strategy is an interesting avenue for further exploration.
RESULTS AND DISCUSSION
Preservation
For all samples the elemental and stable isotopic data indicate well-preserved collagen, and are well within the acceptable range (C:N=2.9–3.6) (van Klinken Reference van Klinken1999) (Table 1). All samples produced a collagen yield of >10%, confirming a high level of preservation, hence their suitability for dating (Ambrose 1990; van Klinken Reference van Klinken1999) (Table 1).
Dating on Graphite Targets
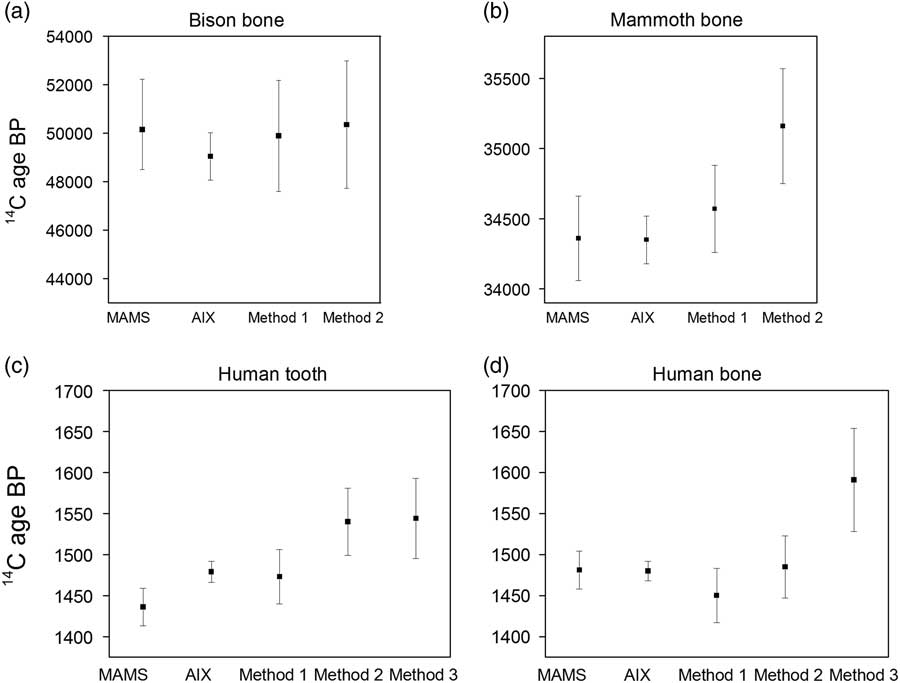
The results of samples measured on solid targets in the two labs, MAMS and AIX, are in agreement (Table 2; Figure 1). The Italian samples date to the early medieval period as expected from the archaeological context. The dates of the mammoth bone fall perfectly within the range found previously (Talamo and Richards Reference Talamo and Richards2011). The ages of the bison bone reported here are the oldest yet for this specimen. The oldest dates obtained by Talamo and Richards (Reference Talamo and Richards2011) were >44,800 BP (conventional 14C yr before AD 1950) from collagen extracted, ultra-filtered, graphitized and dated at the Oxford Radiocarbon Accelerator Unit (ORAU) and from collagen extracts pretreated at the MPI-EVA and subsequently graphitized and dated at ORAU (47,300 +910/–820 BP) and MAMS (47,000 +1190/–1040 BP). All measurements in the previous study were also corrected for collagen extraction backgrounds and standards measured in the same batch. The older ages of the bison bone obtained on graphite targets in this study may be a reflection of the updated pretreatment method now employed at the MPI-EVA, as well as stringent contamination criteria observed at MAMS and AIX during the graphitization process, and further instrumental improvements. We conclude that the agreement between results of large samples measured on solid targets at MAMS and with the AixMICADAS provide a suitable reference dataset for comparison to small gaseous samples measured with the gas ion source of AixMICADAS.

Figure 1 Comparison of graphite dates from MAMS and AixMICADAS against the CO2 weighted mean dates and weighted errors (error 2 in Tables 3–5) of replicates for the four bone samples: (a) R-EVA 124.43, (b) R-EVA 123.53, (c) R-EVA 1516.1, and (d) R-EVA 1489.1. MAMS graphite dates are the results of a single run, whereas AixMICADAS graphite dates are the weighted mean of two replicates, shown in Table 2. Errors are shown to 1σ. In part (d) the mean value for method 3 is somewhat older and less precise than all other values. This mean for method 3 is only based on two replicates, which are not overlapping at 1σ: 1521±80 and 1708±100 BP. The first replicate agrees with those of other methods, while the second and older value is clearly an outlier. More data and work are needed to decipher the cause of this.
Table 2 Results from collagen samples measured on graphite targets at MAMS and AIX. Both labs used 12C currents on graphite targets in the order of 40 µA (low energy side). In Aix, the collagen background measurements (R-EVA 800) had a standard deviation of 0.01 pMC (5%). Rather than propagating this variation in the error calculation of the unknown samples, a conservative value of 0.04 pMC (20%) was used based on observed long-term reproducibility of Phthalic acid standards. An additional 0.1 pMC relative variability was included in the error propagation to take into account the long-term variation on OXA2 standards. In MAMS, samples were corrected for collagen background measurements (cave bear R-EVA 800) and standards run in the same batch using BATS software, with an added external error of 0.1 pMC as per their standard practice. Asymmetrical age uncertainties are shown where pMC≤error×10. All ages >15,000 BP are rounded to nearest 10 yr.

* R-EVA 800.30 and R-EVA 800.33 represent two separate collagen extractions from one bone (R-EVA 800). R-EVA 800.30 was extracted alongside the medieval samples, and R-EVA 800.33 was extracted alongside the Paleolithic samples.
CO2 Dating
Tables 3–5 show the results of measurements of collagen CO2 samples, prepared via three different techniques (methods 1–3). Results are shown in both 14C years and percent modern carbon (pMC=F14C×100). The first error column (error 1) in the tables shows the error calculated in BATS (Wacker et al. Reference Wacker, Christl and Synal2010a) propagating only the variance of the standards and collagen backgrounds included in the same batch as the samples. A second error (error 2 column in Tables 3–5) has also been calculated based on observed data. This added external error has been calculated from the long term variabilities observed on CO2 blanks (0.1 pMC long-term standard deviation of blanks is used as the absolute blank error) and oxalic acid standards (3.5‰ relative error added). While the minimal error propagation of the first error column is optimistic, the second column may represent an overestimation of error as these measurements were made over a short period of time. A comparison of dates from each method is shown in Figure 1, using the weighted means and weighted errors (error 2) of the data in Tables 3–5.
Table 3 Results of AMS measurements using the gas ion source of AixMICADAS for collagen CO2 samples prepared via method 1. The background cave bear concentrations have been subtracted from all four unknown samples, including the bison bone. The measured mass shows the amount of carbon (µg) trapped in the syringe after expansion; in reality only 20–40 µg C was used for each measurement. All errors are shown to 1σ: the error 1 column shows the minimal error, corrected for standards and backgrounds measured in the same batch. The error 2 column includes an external error taking into account long-term variability on standards (3.5‰ relative error added) and blanks (the 0.1 pMC long term standard deviation of blanks is used as the absolute blank error). The results with lab codes including asterisks (*) were measured as preliminary runs of limited duration which explains their lower precision and higher scatter (hence, error 2 is equal to error 1). Asymmetrical age uncertainties are shown where pMC≤error×10. “Older than” ages have been calculated at 2σ, according to convention in van der Plicht and Hogg (Reference van der Plicht and Hogg2006). All ages >15,000 BP are rounded to nearest 10 yr.

Table 4 Results of AMS measurement using the gas ion source of AixMICADAS for collagen CO2 samples prepared via method 2. Columns: see Table 3.

Table 5 Results of AMS measurement using the gas ion source of AixMICADAS for collagen CO2 samples prepared via method 3. Columns: see Table 3. A limited samples set was prepared using this method due to time constraints.

Comparison between AMS Measurements
The results agree between measurements on graphite targets and gaseous collagen samples for all four samples, as seen in Figure 1. The dates between replicates are internally consistent for all samples prepared via methods 1 and 2 (Tables 3 and 4) (chi2 test, p>0.05 in all cases; Ward and Wilson Reference Ward and Wilson1978) and the weighted mean ages for each of the gas methods are statistically identical for all four samples (Mann-Whitney U test, p>0.05 in all cases).
The background collagen samples (R-EVA 800) averaged 0.65 pMC for method 1 and 0.6 pMC for method 2 (see Table 6), both with a standard deviation (1σ) of 0.07 pMC, well within the long-term variability (0.1 pMC) observed on standards measured with the gas ion source. The same background collagen measured on graphite targets in Aix averaged 0.2 pMC with a standard deviation of 0.01 pMC.
Table 6 Comparison of AMS measurements obtained from the background cave bear bone R-EVA 800 for each method. R-EVA 800.30 and 800.33 denote two collagen extractions from the same bone; R-EVA 800.30 was extracted alongside the medieval samples, and R-EVA 800.33 was extracted alongside the Paleolithic samples. At MAMS, R-EVA 800.30 was used for background correction of the graphite measurements of the medieval samples and R-EVA 800.33 was used for background correction of the bison and mammoth samples as these batches were run on separate occasions. In Aix, measurements performed with AixMICADAS on samples R-EVA 800.30 and 800.33 were both used for background correction of the bison, mammoth and medieval human samples, measured on graphite or CO2 gas, as all samples were measured in the same batch. Asymmetrical age uncertainties are shown where pMC≤error×10. All ages >15,000 BP are rounded to nearest 10 yr.

Although the results for the collagen background (R-EVA 800) are statistically the same between methods 1 and 2, those from method 3 are not, being older by ca. 3000 14C yr (0.2 pMC lower). This may relate to the absence of C contribution from the silver cups used for sample combustion in methods 1 and 2. It is clear that one of the two aliquots of the medieval human bone (R-EVA 1489.1) prepared using method 3 is an outlier (Aix-12004.5.2: 1708±101 BP) compared to all other measurements for this bone, with the two replicates not overlapping at 1σ (Table 5). Due to this outlier the weighted mean for method 3 is older than the weighted means of methods 1 and 2 (Figure 1d). This aliquot was prepared in the Heidelberg vacuum line following the first preparation of the same bone (Aix-12004.5.1), interspersed with overnight evacuation of the system. Likewise, the outlier was measured with the GIS following Aix-12004.5.1. It is therefore unlikely that the older age is a result of a memory effect from an older sample. As the method 3 data set is limited, further analysis of small samples prepared via method 3 will be undertaken to expand the data set and explore the phenomenon observed in the “cleaner” collagen backgrounds. The results agree within statistics between the graphite and CO2 techniques (methods 1 and 2) for the medieval samples and for the mammoth bone at ca. 34,500 BP (calibrated age ca. 39,000 cal BP), with low error ranges.
As shown by the graphite measurements in Table 2, the bison bone is very close to the cave bear background value (ca. 0.2 pMC). In Tables 3–4, the bison gas analyses are corrected for a more sizable background value (ca. 0.65 pMC). Consequently, the CO2 results vary widely between replicates although this variation is still within the quoted 1σ errors (see Tables 3 and 4). Nevertheless, after propagation of the blank scatter in the error calculation (error 2 discussed above), the gas measurements (weighted mean and error of 50120 +2950/–2150 BP for the 7 replicates in Tables 3 and 4) are compatible with those performed on solid graphite (49,040 +1040/–920 BP based on duplicates in Table 2) at the limit of the 14C timescale. In any case, this sample suggests that the realistic limits of the gas source for relatively precise measurements is ca. 0.6 pMC, equivalent to an age of 41,000 BP (and a calibrated age of ca. 44,000 cal BP). Beyond that limit, the 14C can still be detected and quantified, but the uncertainty of the background correction dominates accuracy and precision.
Precision
Although ion currents remain higher for measurements of large samples on graphite targets (around 40 µA for these samples on the Low energy side), various modifications to the gas ion source (Fahrni et al. Reference Fahrni, Wacker, Synal and Szidat2013), such as the addition and adjustment of the immersion lens, mean that currents from the MICADAS gas ion source are now achievable which were impossible eight years ago (in the range of 15 µA for this study), and the use of helium as a stripper gas has further increased transmission (48% for AixMICADAS in gas configuration).
While ca. 80 µg C (170 µg collagen) was weighed into each aliquot for these tests, only approximately 30 µg C was consumed during measurement. For future samples, an appropriate amount of collagen (ca. 70–80 µg) would be weighed out or measurements could be extended for the duration of a second or third titanium target to exhaust the whole sample. With such a reduction in sample size (e.g. half the amount combusted in this study), any external carbon in the EA-GIS system will make an increased contribution for samples prepared via methods 1 and 2. This will be explored in future tests using such sample sizes.
Although a single gaseous measurement of <100 µg C is not yet directly competitive with a 1000 µg C graphite measurement in terms of error, the level of precision we achieved with one aliquot is still highly applicable for answering many archaeological questions. This is especially important for Paleolithic fossils and bone artifacts where 500 mg material is not available for sampling. This is demonstrated by the mammoth bone at ca. 34,500 BP, where a single gaseous measurement of <0.2 mg collagen has a precision of approximately ±800 yr (error 2).
For this test, four aliquots per sample were measured to test the consistency of the measurements. Although we are principally interested in the precision and accuracy we can reliably achieve with one run (<100 µg C), when we take the weighted mean and error of the four gaseous replicates for method one, the measurement error of the gas technique is more or less comparable with a graphite date (see Figure 1). For example, for the mammoth bone, the weighted mean of the four ca. 80 µg C (total 320 µg C combusted, ca. 120 µg C consumed) gas samples (method 1) was 34530±300 BP, while the graphite date from MAMS was 34360±300 BP and from Aix was 34350±170 BP (each ca. 1000 µg C). This is especially apparent when considering the calibrated ranges. For the medieval tooth, the calibrated range of the weighted mean age and error (1473±33 BP) of the method 1 gas samples is 1389–1320 cal BP (1σ) and the weighted mean of the graphite measurements (1479±13 BP) from Aix is 1380–1346 cal BP (1σ) (OxCal, v4.2). The strategy for dating gaseous samples could therefore be adjusted depending on the level of precision required for each individual sample and the amount of material available.
Choice of Optimal CO2 Preparation
The preparation of samples using method 3 is very labor-intensive (overnight combustion is followed by around 3 hr of elaborate lab work for the preparation of one sample). However the collagen background suggests this may be the “cleaner” route of CO2 preparation and further preparations using this method are planned for future tests. The larger data sets from methods 1 and 2 produced results in good agreement for the background cave bear bone and all four samples. The direct coupling of the EA to the gas ion source in method 1 reduces the time for combustion and isolation of collagen CO2 to around 10 min per sample, reducing both time investment and minimizing handling steps (fully automated process with no sealing step). Considering the practicalities alongside the agreement of results between techniques in this study, method 1 is the preferable route of sample CO2 isolation, allowing us to go from collagen to a high precision date in around an hour per sample (including a series of replicates and flushing).
CONCLUSION
We can now date gaseous samples of bone collagen of <100 µg C due to the improved design of the MICADAS hybrid ion source. Consistent agreement between replicate measurements in this preliminary study demonstrates the level of accuracy and precision that can be achieved using the gas ion source. The results here demonstrate the applicability of the method, particularly for Paleolithic bone samples, at least back to 40,000 BP. The directly coupled EA and gas ion source offer a fast, efficient method of sample preparation. This study opens the way for the direct dating of extremely precious and small archaeological bone objects.
ACKNOWLEDGMENTS
Research in Leipzig, as well as all measurements made in MAMS, was funded by the Max Planck Society. AixMICADAS was acquired and is operated in the framework of the EQUIPEX project ASTER-CEREGE (PI E. Bard) with additional matching funds from the Collège de France, which also supports the salaries of the authors from CEREGE. Many thanks extended to Lysann Klausnitzer for training in sample preparation, Sven Steinbrenner for isotopic measurements and to Lise Bonvalot for advice on blanks with the EA-GIS. We would like to thank the three anonymous reviewers whose comments greatly improved the manuscript.