


1. Introduction
It is worrisome that losses associated with tropical storms have risen considerably over the last few decades and are currently estimated to be about USD26 billion per year (see Mendelsohn et al., Reference Mendelsohn, Emanuel, Chonabayashi and Bakkensen2012). Moreover, some predict that the intensity of these phenomena may increase with climate change.Footnote 1 In this regard, the small, disaster-prone island economies in the Caribbean are particularly vulnerable, as their limited budgetary capacity prevents them from establishing sufficient financial reserves to absorb such potentially large negative shocks. Added to this, their high level of debt restricts their ability to access credit in the aftermath of a natural disaster, while high transaction costs associated with the relatively small market restrict access to private catastrophe insurance covering potential losses. International aid does not provide a solution either since, when it comes, it is often too little and too late.
A demonstrative example of the consequences of the fiscal shortfalls in the Caribbean associated with tropical storms was the case of Hurricane Ivan, which struck Grenada in 2004 causing losses twice the size of the island's GDP. In the immediate aftermath, the country was no longer able to finance its public service bill, but had no budget contingency in place or access to private insurance, given the relatively small market. It was thus forced to introduce a number of revenue-enhancing measures and delay efforts of recovery and reconstruction in order to address the fiscal shortfall, thus likely further amplifying the long-term effects of the hurricane. In fact, it is in response to such fiscal vulnerability to natural disasters that in 2007 a number of Caribbean economies established the Caribbean Catastrophe Risk Insurance Facility (CCRIF), a multi-country risk pooling scheme that can provide members with almost immediate fiscal relief when a natural disaster occurs.Footnote 2 As a matter of fact, since its inception the CCRIF has issued over USD23 million as a consequence of three tropical storm events alone. Moreover, given the perceived success of the CCRIF, recently a similar scheme, the Pacific Catastrophe Risk Insurance Pilot (PCRIP) program, has been introduced to insure against fiscal shortages from tropical cyclones in the South Pacific.
Payouts to participating members under the CCRIF as a consequence of tropical storms are made according to the storm's physical characteristics, the predicted losses as computed by numerical modeling, a country's risk profile, and a country's loss coverage, the latter being the only choice parameter of a country. Ultimately the country's chosen coverage will, however, depend in large part on its expectations with respect to the impact of a tropical storm event on its fiscal sector. In other words, a country's choice will depend, for a range of possible events, on the size of the impact of a particular event and the probability of that event occurring.
In this regard, there are only a handful of statistically-based studies which can provide quantitative indication as to the actual fiscal impact due to natural disaster events. More specifically, for a large set of countries and different natural disaster events grouped together, Lis and Nickel (Reference Lis and Nickel2010) discover that the negative budgetary impact of extreme weather events can be up to 1.1 per cent of GDP, while Melecky and Raddatz's (Reference Melecky and Raddatz2011) analysis shows that government expenditure increases, whereas revenue does not respond to climate shocks. In a subsequent study, Melecky and Raddatz (Reference Melecky and Raddatz2014) demonstrate that the extent to which disasters affect governments’ fiscal behavior is contingent on the nature of the financial system. For example, the authors show that government expenditure does not increase in countries with underdeveloped credit markets, whilst in countries with more developed markets the budget deficit increases significantly.
Noy and Nualsri (Reference Noy and Nualsri2011) also note that the fiscal impact of natural disasters depends on the country-specific macroeconomic dynamics occurring in the aftermath of natural disaster shocks. In the context of the US, Deryugina (Reference Deryugina2016) finds that natural disasters cause government transfers to increase significantly in affected counties. Looking at tropical storms in the Caribbean specifically, Ouattara and Strobl (Reference Ouattara and Strobl2013) demonstrate that hurricane strikes cause an increase in government spending and short-term deficit financing. Importantly, all of these studies, with the exception of Noy and Nualsri (Reference Noy and Nualsri2011), only look at the impact of natural disaster events in terms of annual data, while the needs addressed by cross-country insurance schemes like the CCRIF are for shortages in the first few months at most (see, for instance, Ghesquiere and Mahul, Reference Ghesquiere and Mahul2010).
Unlike all existing studies, in this paper we actually calculate expected fiscal impacts by also modeling the risk profile of events. It is also worth pointing out that, in addition to the use of high frequency data, our paper differs from the work of Ouattara and Strobl (Reference Ouattara and Strobl2013) in several aspects. First, on the methodological front we use a Panel Varx setting which requires the variables in the model to be stationary. Second, we decompose revenue into its various components, namely revenues on goods and services and revenue from income to ensure that our results are not driven by cyclicality.Footnote 3 Third, we extend the analysis by using an extreme bounds approach (in particular the parametric bulk model) to quantify the expected shortage experienced by individual countries.
In order to conduct our analysis, we compile a data set of monthly potential hurricane losses and fiscal expenditure and revenue over the 2000–2013 period for a set of Caribbean countries. We combine these data with destruction estimates derived from actual hurricane tracks and a detailed spatial distribution and valuation of assets. Using panel vector auto-regression estimation methods, we show that monthly government revenue drops immediately after a shock, while there is no discerning significant effect on monthly public expenditure. Overall this results in a budget deficit in the month of the hurricane strike. We then also provide estimates of return periods of fiscal shortages using an extreme value theory framework based on a distribution of implied losses derived from historical hurricane track data. Our analysis suggests that there is considerable heterogeneity in expected short-term fiscal shortfall across islands, although estimates are characterized by substantial uncertainty.
The remainder of the paper is organized as follows. In section 2 we describe our data and provide some summary statistics. In section 3 we outline our econometric methodology and the results from our econometric estimation. In section 4 we undertake our risk analysis. Section 5 concludes.
2. Data and summary statistics
2.1 Hurricane destruction index
Much of the earlier literature on the economic impact of natural disasters has relied on ex-post gathered information on damages due to these events. However, as argued and shown by Strobl (Reference Strobl2012) and Felbermayr and Gröschl (Reference Felbermayr and Gröschl2014), the use of ex-post measures of natural disasters can introduce considerable measurement error and potential estimation bias. Rather it is more fruitful to use ex-ante proxies of potential destruction that are constructed from the physical characteristics of the event and the exposure to it. For example, Strobl (Reference Strobl2012) calculates locally-experienced wind speeds due to a tropical storm from a wind field model and hurricane track data and combines this with gridded population density data to derive a country-level potential destruction index.
For the analysis here, we use estimated hurricane losses generated from the methodology now underlying the calculations for payouts under the CCRIF. More specifically, the losses are derived using the CCRIF's Second-generation Hazard and Loss Estimation Model (2 G Model); see CCRIF (2012). Under this framework, storm- and site-specific characteristics are used to calculate local winds and storm surge in response to an event.Footnote 4 More specifically, hurricane track data, which provide information on the location of the hurricane eye at 6 h intervals as well as the maximum wind speed, serve as inputs into a two dimensional tropical storm wind field model. The wind field model's output then provides for any chosen point relative to the storm during a storm's lifetime the wind speed experienced at that point. Similarly, in terms of local storm surge information derived from the hurricane track data, as, for example, the foreword speed and angle of approach, is used to simulate storm surge at any point relative to the storm.
The local wind speed and storm surge estimates from the models just described are subsequently translated into damages using local exposure data and damage functions. Importantly, the exposure data consist of locally-estimated (30 arc-seconds) asset values at risk and thus, unlike the model employed by Strobl (Reference Strobl2012), allows the generation of estimated losses in monetary terms by considering asset exposure and explicit damage functions.Footnote 5 More precisely, for each 30 arc-second grid cell, the number of dwelling units is computed from population data, land cover information is used to infer construction types and non-residential exposure, and infrastructure is based on density and the distribution of building types, while the agricultural component in the loss estimation is estimated using land cover data and the agriculture's contribution to a country's GDP. Each asset class (residential, non-residential, and infrastructure) is then subject to damage functions associated with each type. Inputs into these damage functions are then the maximum wind speed and storm surge experienced for a storm at the grid cell's centroid, providing monetary losses for each cell for each storm. Finally, all grid cell asset losses are aggregated at the national level for each storm. The CCRIF 2 G is thus used to generate losses for each storm in the HURDATFootnote 6 data set going back to 1871.
2.2 Monthly fiscal revenue and expenditure data
Monthly total fiscal revenue and expenditure data, and their main components, are taken from a number of sources. For all Eastern Caribbean economies (Anguilla, Antigua and Barbuda, Grenada, St. Kitts and Nevis, St. Lucia, Montseratt, St. Vincent and the Grenadines), we use data from the Eastern Caribbean Central Bank Databank. Information for the Bahamas is from the Central Bank of the Bahamas, for Barbados from the Central Bank of Barbados, for the Dominican Republic from the Banco Central de la Republica Dominicana, for Haiti from the Banque de la Republique d'Haiti, and for Jamaica from the Bank of Jamaica. Data on payouts are obtained from the CCRIF. It should be noted that while for most countries we have a complete data series for the 14 years of the data, for a few there are some missing, so that overall we have a slightly unbalanced panel of 12 Caribbean island economies.
2.3 Summary statistics
The sample period available for our data set as well as country abbreviations are shown in table A1 in the online appendix, whereas summary statistics for our fiscal variables and damage estimates from the 2 G model are given in tables 1–3, respectively. As can be seen, since 2000 Anguilla, the Bahamas, Dominican Republic, Grenada, St. Kitts and Nevis, St. Lucia, and St. Vincent and the Grenadines ran on average monthly budget surpluses, while all other economies experienced deficits. Examining the storm loss data, it can be seen that the number of loss-inducing storms differs widely across islands, ranging from just two for Barbados to a total of 21 for Haiti. Similarly, mean losses per storm also vary widely across islands, where the largest (USD390 million) average loss was experienced by Jamaica. If we compare this to the assets exposed, we find that the average storm in no case resulted in direct losses of more than 1.5 percentage points of total assets (Grenada in 2004 from Hurricane Ivan). However, the large standard deviations suggest that storm-specific losses differ widely over time. For example, figures in the 5th column of table 1 demonstrate that the maximum loss per storm is usually several times the loss per average storm. As a percentage of assets exposed, one finds that losses in this regard were as high as 8 percentage points (Grenada in 2004).
Table 1. Summary statistics

Notes: Figures in millions of (2013) USD.
Table 2. Summary statistics – average monthly aggregate fiscal variables by country

Notes: Mean in bold and standard deviation in italic font. Figures in millions of (2013) USD. Budget refers to revenue minus expenditure.
Table 3. Summary statistics – hurricane event loss data (millions of USD) and storm numbers, 2000–2013

Notes: Figures in millions of (2013) USD. % in terms of percentage of total asset exposure. Losses are estimated value at risk from direct damages.
3. Econometric methodology and results
3.1 Econometric methodology
Ouattara and Strobl (Reference Ouattara and Strobl2013) show that when measuring the fiscal response to hurricane strikes, it is important to take account of the dynamic interaction of fiscal revenue and expenditure. To capture the dynamic effect of hurricane shocks, we thus similarly adopt a panel VARX methodology. Our reduced form VAR takes the following specification:
 $$y_{i,t} =\gamma +\sum_{j=1}^p \varpi_j y_{t-j} +\sum_{k=0}^s\xi_{k}x_{t-k} +\sigma_t,$$
where y and x are the vectors of endogenous and exogenous variables in natural logged form, respectively, t denotes time, and σ represents the error term of the system. Given the panel structure of our data, and accounting for fixed-effects, (1) can be re-written as:
 $$y_{i,t} =\gamma_i +\sum_{j=1}^p \varpi_{ij} y_{i,t-j} +\sum_{k=0}^s\xi_{k}x_{i,t-k} +\sigma_{i,t},$$
where i is the country index and γi captures the fixed effect for each country. The multiplier form of (2) can be denoted as:
 $$y_{i,t} =\Gamma (L)^{-1}\Psi (L)x_{i,t} +\Gamma (L)^{-1}\varepsilon _{i,t},$$
where L denotes the lag operator. The mean response of a hurricane shock is, therefore, captured by the polynomial:
 $$\Gamma (L)^{-1} \Psi (L).$$
The vector of endogenous variables is composed of our fiscal variables, namely government expenditure and revenue, while the vector of the exogenous variable is formed by our tropical storm loss variable generated from the CCRIF 2 G model. Thus, the panel VARX adopted can be represented by the following structure:
 $$y_{i,t} =\left[\matrix{\hbox{Expenditure}_{i,t} \hfill \cr \hbox{Revenue}_{i,t} \hfill} \right] x_{i,t} = [\hbox{LOSS}_{i,t}].$$
Before implementing the panel VARX methodology, one needs to first check the time series property of the data. Indeed, the methodology requires that the endogenous variables be stationary. To test for this we use three unit root tests, namely those by Levin et al. (Reference Levin, Lin and Chu2002), Im et al. (Reference Im, Pesaran and Shin2003), and Pesaran (Reference Pesaran2007) denoted, respectively, by W stat, t*, and Z tbar.Footnote 7 The results, which are summarized in table A2 in the online appendix, suggest that the null hypothesis of a unit root can be rejected and consequently the variables can be used in level form in the panel VARX.
In addition to the time series property of the data, it is also important to determine the lag structure of the VAR before proceeding to estimation. For this we used the AIC and SBC criteria to ascertain the lag order of the VAR. Both information statistics suggested a six-month lag length, which we believe is rich enough to capture the dynamics of the short-term fiscal response.
Given that the panel model adopted in this paper is dynamic but with a limited time dimension, results may be biased and inconsistent if fixed effects are treated in the usual manner, as argued by Nickell (Reference Nickell1981) and Kiviet (Reference Kiviet1995). Although the bias might not be large in very large samples, it is a problem in small samples like the one used in the present context.Footnote 8 To address this concern, we thus use the bias-corrected Least-Squares Dummy Variable (LSDV) estimator, where bootstrap standard errors are estimated as suggested by Pesaran and Zhao (Reference Pesaran, Zhao, Hsiao, Lahiri, Lee and Pesaran1999) and Everaert and Pozzi (Reference Everaert and Pozzi2007). Finally, in order to account for time-specific factors that may affect all islands in a similar manner, we first time demean all endogenous and exogenous variables before estimating (2).
3.2 Fiscal response resultsFootnote 9
We now turn to the response of our fiscal variables to losses generated by hurricanes where estimates on the first six lags are reportedFootnote 10 in table 4 and depicted graphically in figure A1 (online appendix). The results in table 4 show that tropical storm losses do not affect expenditure in any statistically discernable manner. In contrast, we find that such events result in significant, but only contemporaneous, revenue losses. These results are also evident in the ensuing impulse response graph; see figure A1, panels A and B. These dynamic responses of total expenditure and total revenue result in an increase in the budget deficit at the time of impact as can be seen from table 4 and figure A1, panel C.
Table 4. Hurricane shocks

Notes: Numbers in [ ] represent 95 and 90 confidence intervals, obtained using Monte Carlo simulations 1000 replications. **, *indicate statistical significance at the 95% and 90% confidence interval, respectively. Budget balance is constructed out of its components. Country fixed-effects and year specific effects included.
The discrepancy in results for expenditure and revenue might be due to several reasons. Firstly, the lack of impact could be due to the fact that expenditure may be reduced by the receipt of international financial aid, which again may differ substantially across islands in extent and in temporal allocation. Unfortunately, as far as we are aware, there is no database on monthly receipt of foreign aid. To account for this, however, one could estimate model (5) by including aid and using annual data. However, as we pointed out earlier, the use of high frequency data (monthly in the present context) is more suited to explore the fiscal behavior of countries that are often exposed to events such as hurricanes. Another option is to estimate our model (5) and the budget equation using a 24-month time horizon. If aid indeed has an effect, then one would expect this to show up beyond the 12-month horizon. As can be seen from figure 1, panels A–C, there is no evidence of a change in the response of our fiscal variables after the 12-month horizon.Footnote 11, Footnote 12
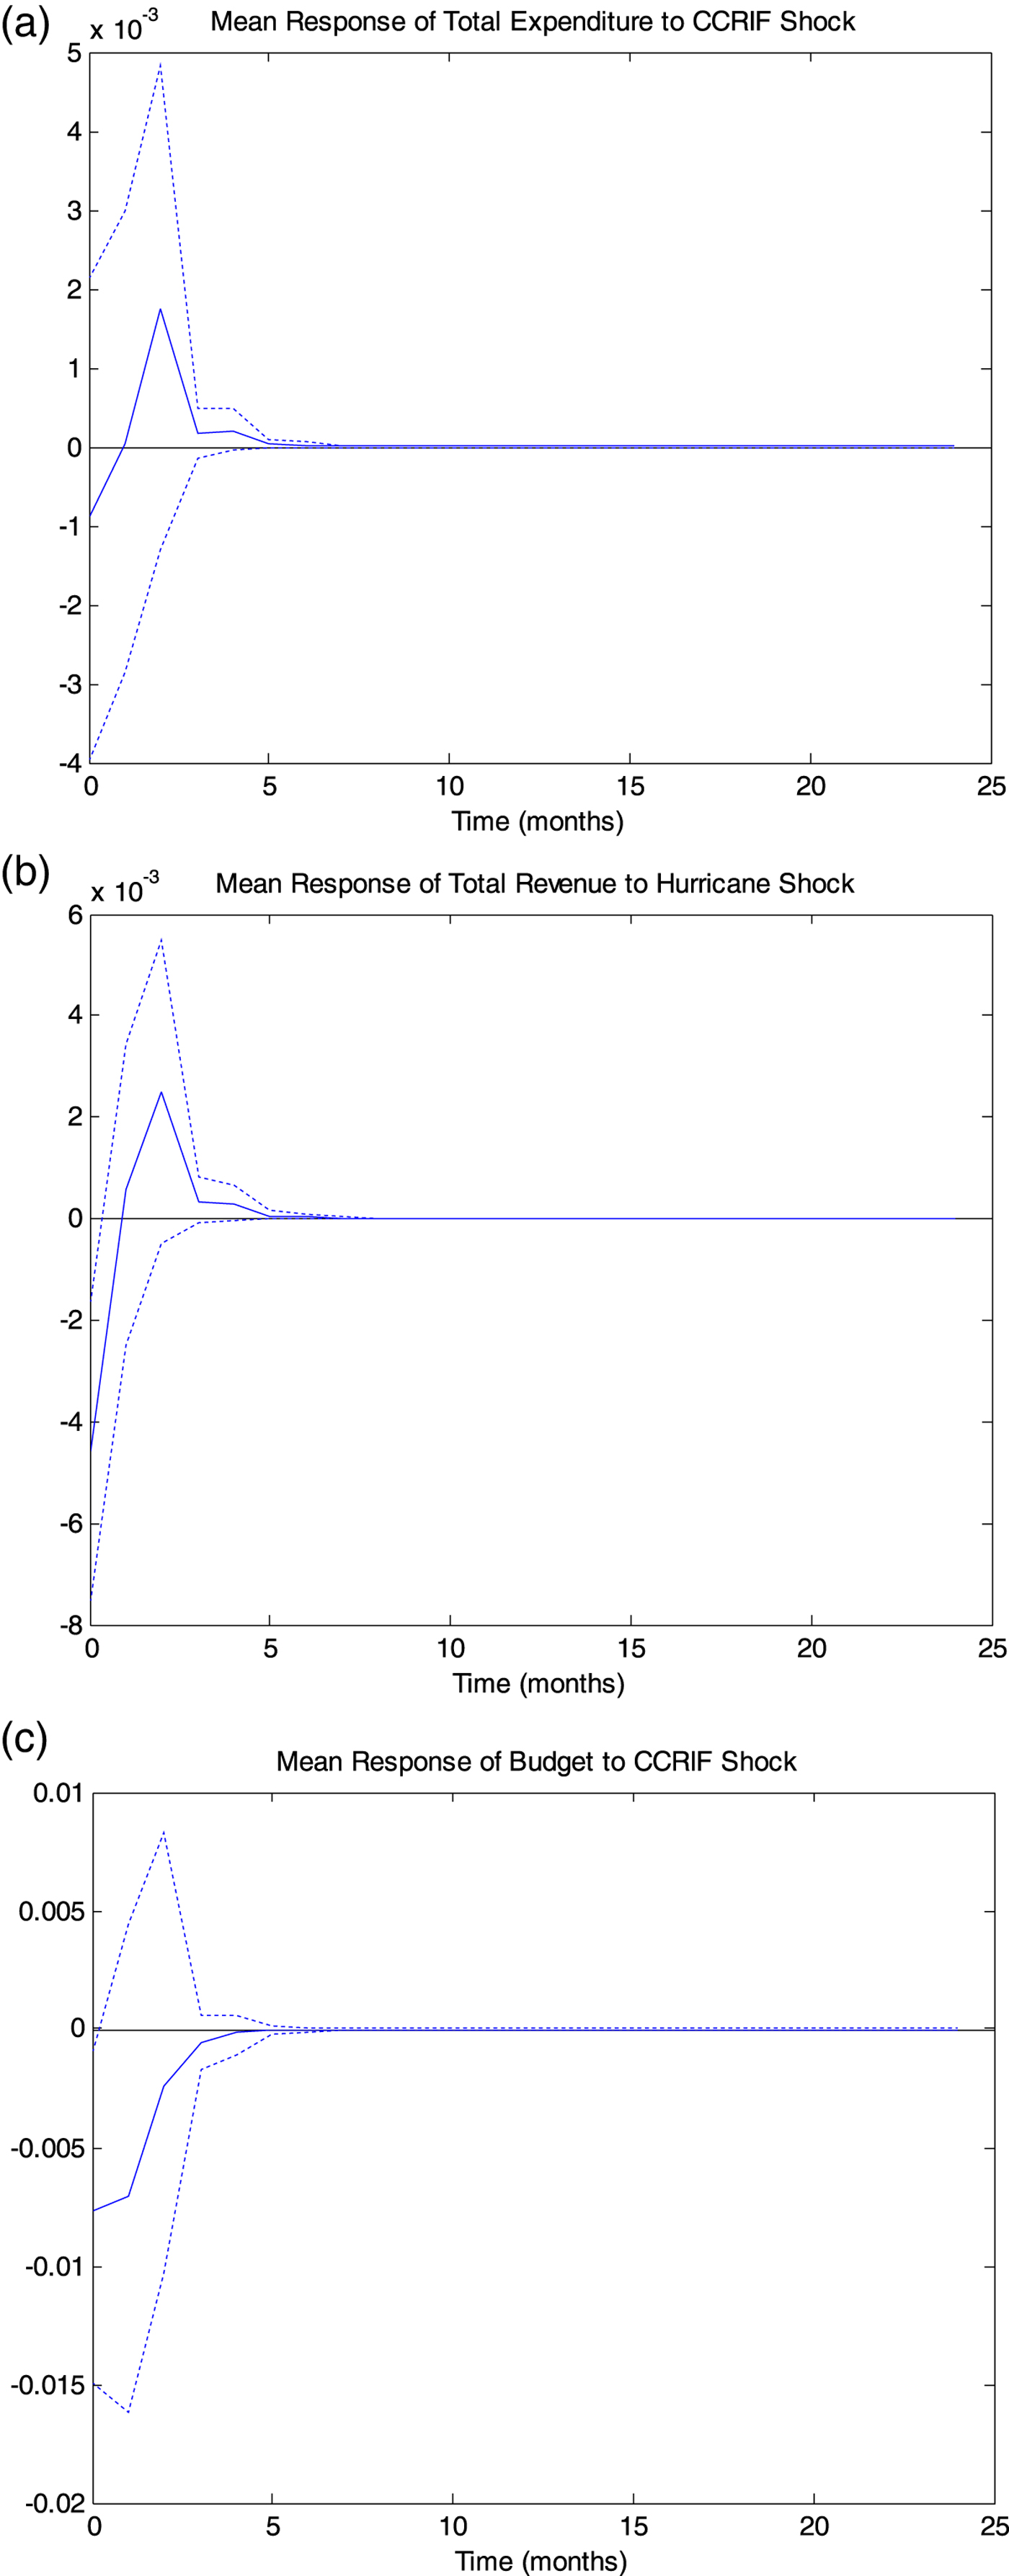
Figure 1. Mean response of aggregate fiscal variables (24-month horizon).
It could also be argued that CCRIF payouts following the disaster have not been included in our model. Given that all the countries in our sample have been members since its inception, payments, when they occurred, may have played a role in some of our results. More specifically, over our sample period, payouts were made to Anguilla, Saint Lucia, St. Vincent and the Grenadines, and Barbados. To account for this, we re-estimate our model this time including payouts. Results are summarized in table 5 and figure A2, panels A-C (online appendix). As can be seen, the results are quite similar in significance and size to our previous results. This is not surprising, given the very few and low payouts relative to actual hurricane losses. Indeed, the data shows that payouts were triggered by some countries for Tropical Cyclone Earl in August 2010 (Anguilla) and Tropical Cyclone Thomas in October 2010 (Barbados, Saint Lucia and St. Vincent and the Grenadines). Moreover the CCRIF was only established in 2007.
Table 5. Hurricane shocks (with payout)

Notes: Numbers in [ ] represent 95 and 90 confidence intervals, obtained using Monte Carlo simulations 1000 replications. **, * indicate statistical significance at the 95% and 90% confidence interval, respectively. Budget balance is constructed out of its components. Country fixed-effects and year specific effects included.
A third reason why total expenditure might not respond significantly to hurricane shocks may be due to the fact that its main components, namely current expenditure (includes all government current expenditures for purchases of goods and services) and capital expenditure (outlays by the public sector) respond differently to hurricane strikes. The results are portrayed in table 6. The results in the first two columns show that while hurricane strikes exert no statistically significant effect on capital expenditure, their effect on current expenditure tells a different story. More specifically, current expenditure responds positively and significantly two months after the initial shock and up to the sixth month. The ensuing impulse response functions, shown in panels A and B of figure 2, confirm these results. These findings could explain why the impact of hurricane strikes on total expenditure is statistically insignificant.
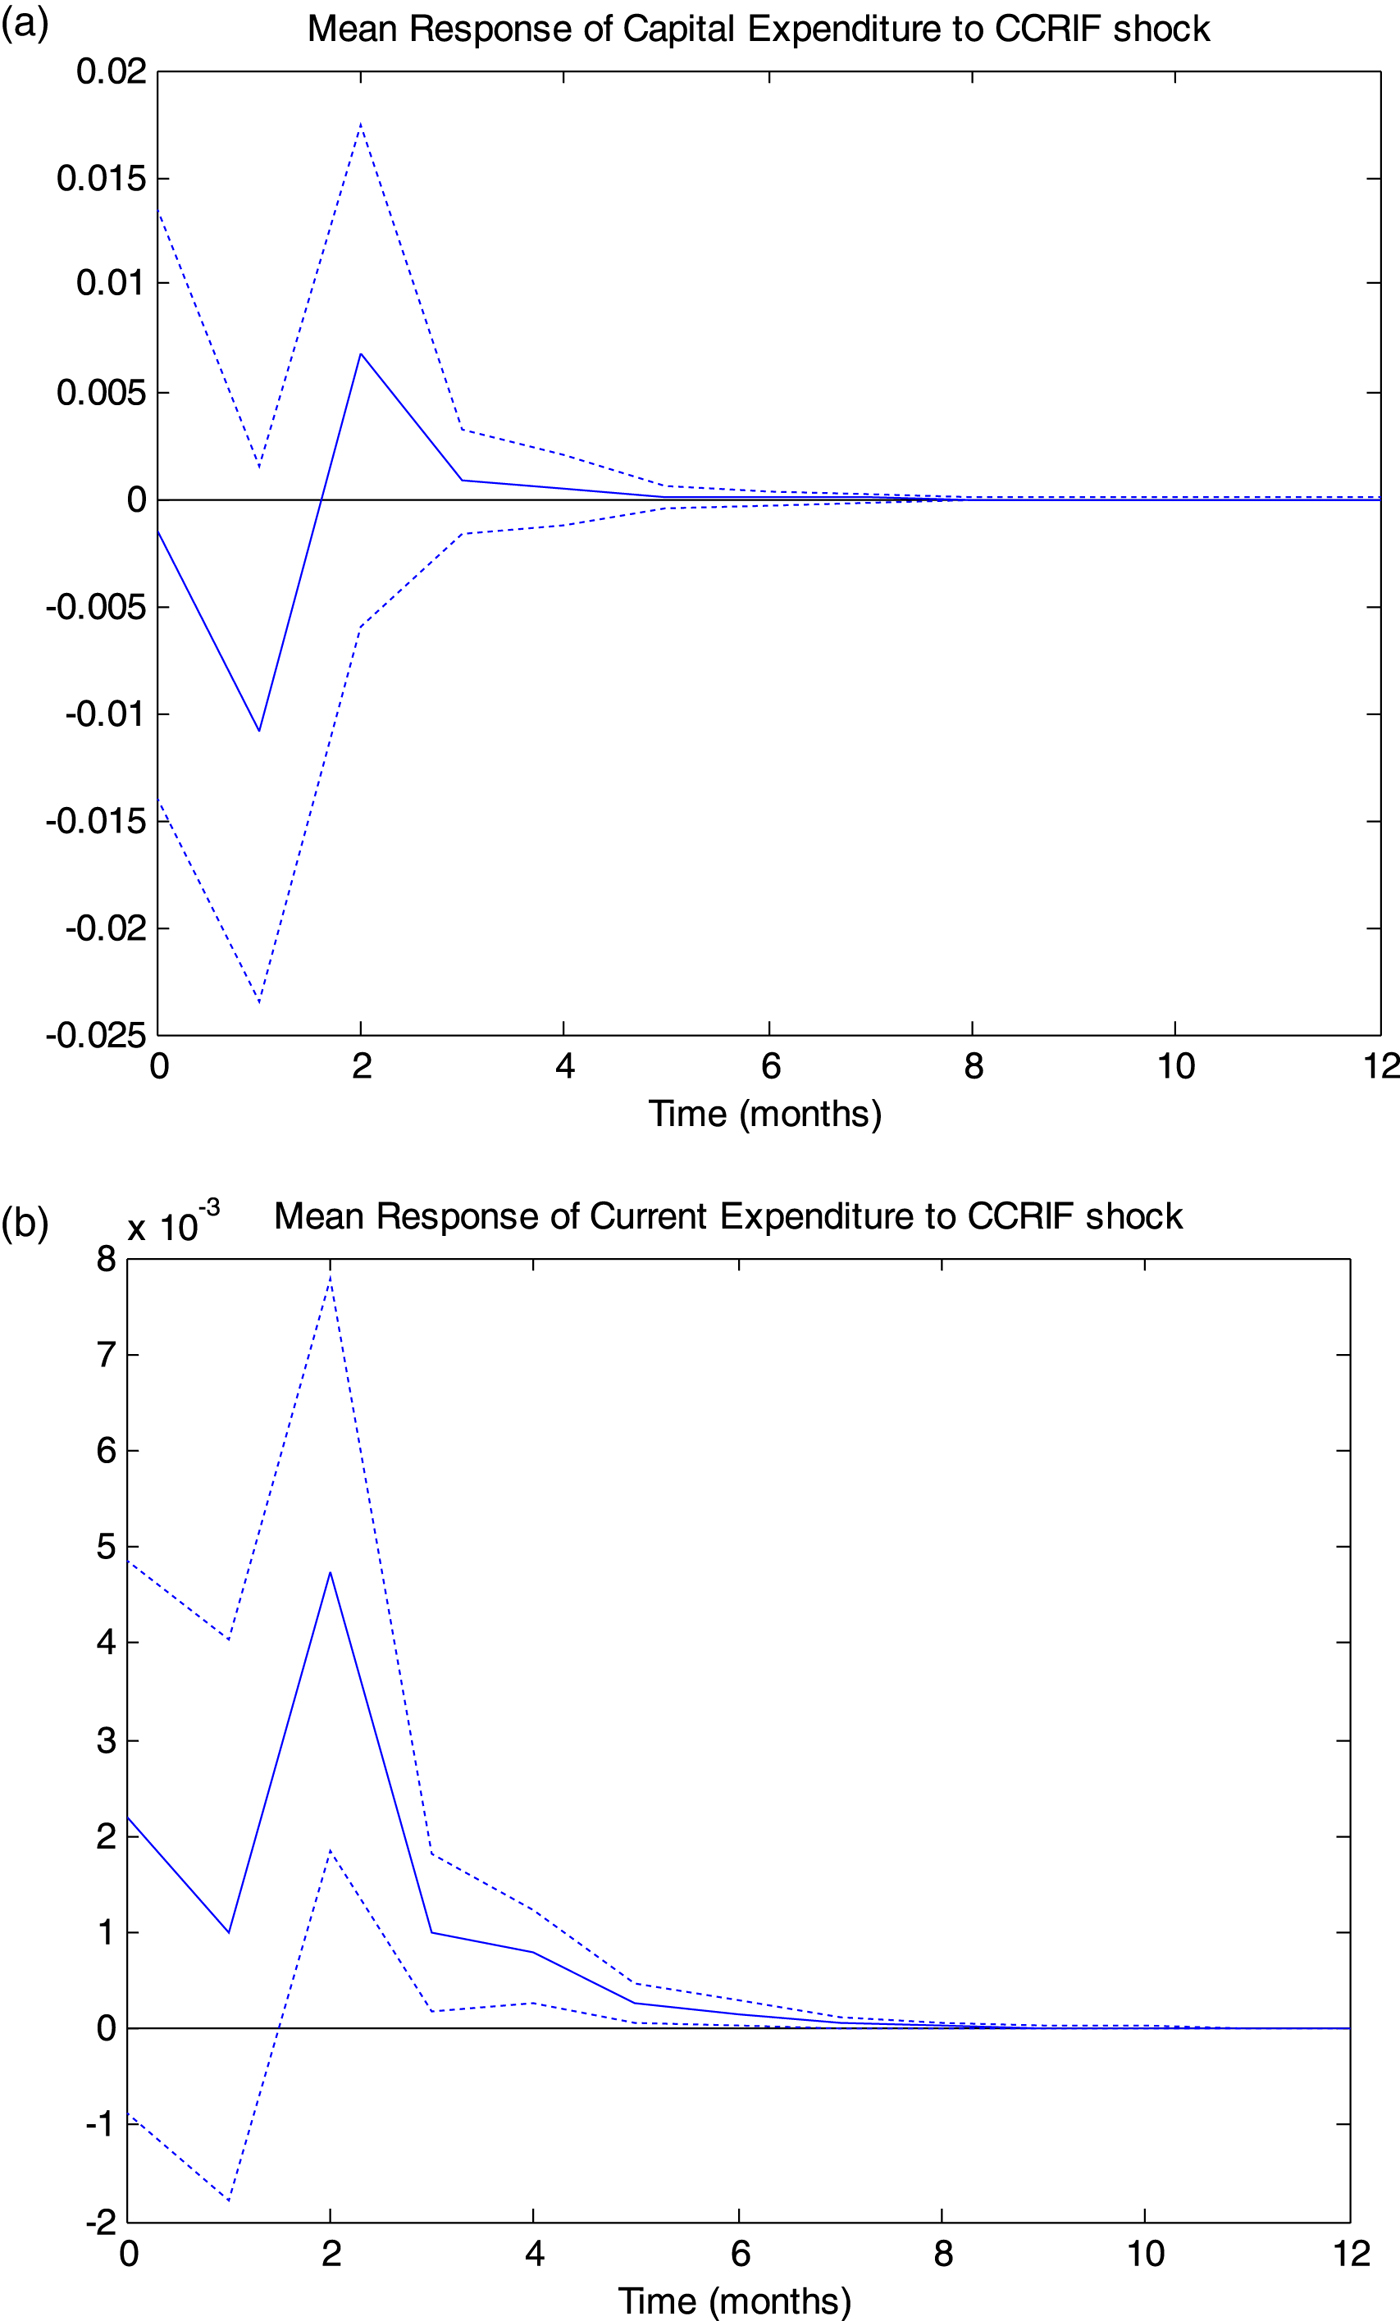
Figure 2. Mean response of expenditure components.
Table 6. Hurricane shocks (components)

Notes: Numbers in [ ] represent 95 and 90 confidence intervals, obtained using Monte Carlo simulations 1000 replications. **, * indicate statistical significance at the 95% and 90% confidence interval, respectively. Budget balance is constructed out of its components. Country fixed-effects and year specific effects included.
Along these lines, it is also possible that any likely increase in expenditure to finance recovery may be less systematic on a monthly basis across islands, in that governments may differ in their response time and extent, resulting in the imprecision of estimates. Similarly, we also explore the impact of hurricane strikes on the components of government revenue, namely income revenue (income tax, which includes compulsory transfers to the central government for public purposes) and revenue from goods and services (taxes levied on the sale of goods and services). It is clear from the results shown in the last two columns of table 6 and in figure 3, panels A and B, that on impact both types of revenue drop, albeit only the estimated coefficient of income revenue appears to be significant in statistical terms. Revenue from goods and services, however, responds significantly two months after the initial shock.

Figure 3. Mean response of revenue components.
In order to gauge the economic significance of our estimation, we use the means of our revenue and our hurricane loss variable in conjunction with our two significant coefficients in the total revenue specification. Together these imply that a one dollar increase in losses reduces government revenue by 8 cents. Looking at the impact since 2000, the average monthly damages caused a reduction in revenue of about USD6.2 million, i.e., about 0.5 per cent of average government revenue in the region. If we consider the greatest loss experienced, then the equivalent figure would amount to a drop in revenue of USD146.3 million, i.e., 30.2 per cent of the average monthly revenue in the Caribbean.
4. Risk analysis
While we have shown that natural disasters have significantly affected the fiscal sector since 2000, what most countries are likely to be interested in from a policy perspective is what the risk of this occurring is, particularly when considering whether and to what extent to participate in insurance schemes like the CCRIF. In considering the risk of hurricane strikes, it is important to realize, however, that these tropical storms are still relatively rare events that can take on extreme values, and thus their distribution function is by definition characterized by heavy tails. A complication in trying to estimate such heavy-tailed distributions is not only the scarcity of extreme events generally observed in the data, but also that often one wishes to predict events of an extremity that have not been observed yet. The standard approach to deal with this has been the application of extreme value theory. Two common methods for modeling extreme events exist for practical analysis: (i) the derivation of block maxima, which involves dividing the observation period into non-overlapping segments of equal size and restricts attention to the maximum observation in each period, or (ii) the peak over threshold method for which one selects observations above a threshold. Hurricanes as extreme events have generally been studied using the latter approach (see, for instance, Jagger and Elsner, Reference Jagger and Elsner2006), and we here follow suit. In this regard, the traditional approach to modeling extreme events has been to fit a generalized Pareto distribution (GPD) to the data above the chosen threshold. The justification for ignoring data below the threshold is that arguably extreme and non-extreme events are often caused by physically different forces, that the GPD is a flexible asymptotically justifiable model for the tail excesses, and that the information content of a sample containing extreme events typically consists of ‘low information’ non-extreme distributions and ‘high information’ extreme distributions, so that it is difficult to always ensure that the latter is given sufficient relative importance. However, as noted by Scarrott and MacDonald (Reference Scarrott and MacDonald2010), the weakness of the GPD threshold approach is that it does not take account of the uncertainty associated with the choice of threshold.Footnote 13 As a consequence, a number of extreme value mixture models have been proposed, which encapsulate the usual threshold model in combination with a component to capture the non-extreme distribution, also known as the ‘bulk distribution’.Footnote 14
Here we employ the parametric bulk model proposed by Behrens et al. (Reference Behrens, Lopes and Gamerman2004). More specifically this involves fitting a gamma model for the bulk distribution below the threshold and a GPD above it, where the components of the two distributions are spliced together at the threshold, which is treated as a parameter to be estimated. Accordingly, the cumulative distribution function F of any observation x is written as:
 $$F(x\vert \eta ,\zeta ,\sigma ,\mu ) = \matrix{H(x\vert \eta)\hfill &\hbox{if}\ x \lt \mu \hfill \cr H(\mu \vert \eta) + [1 - H(\mu \vert \eta)] G(x \vert \zeta, \sigma, \mu) \hfill &\hbox{if} x \ge \mu \hfill},$$
where ζ and σ are the shape and scale parameters respectively, μ is the endogenously chosen threshold and η is its distribution parameter.
G is the GPD such that its cumulative distribution function is:
 $$G(x\vert \zeta ,\sigma ,\mu) = \matrix{1 - (1 + \zeta (x - \mu)/\sigma)^{1/2} \hfill &\hbox{if} \zeta \ne 0 \hfill \cr {1 - \exp}\{-(x - \mu)/\sigma \} \hfill &\hbox{if} \zeta = 0 \hfill},$$
and H is a standard gamma cumulative distribution function with shape and scale parameters k and θ, respectively.
In order to get a better fit of the distribution in (6), we use the complete set of losses for all the tropical storms since 1871 generated by the 2 G model. Summary statistics of these losses are shown in table 7. As can be seen, compared to table 3, using the full set of events provides us with a lot more events upon which to base our estimation, but generally paints a similar picture in terms of the relative losses across islands.
Table 7. Summary statistics – hurricane event loss data (millions of USD) and storm numbers, 1871–2013

Notes: Figures in millions of (2013) USD. % in terms of percentage of total asset exposure.
In order to generate comparable results across countries, we normalized levels of losses relative to ‘normal’ government receipts. More specifically, for each island we used the significant estimated coefficient at time t from the impact on budget deficit from table 4, multiplied this by the predicted losses and then divided this product by the mean fiscal revenue in those years when there was no reduction in the deficit due to hurricanes. For each loss series we then estimated (6) to generate ζ, σ, μ, k and θ. As can be seen from table A3 (online appendix), these differ substantially across islands, thus indicating that the type f distribution of losses varies considerably geographically.
It is standard in the insurance literature and industry to think of events in terms of their return periods and we follow suit here. More specifically, we can use the island specific fitted parameters to estimate the return period of a hurricane inducing at least fiscal shortage f in an island by (see Jagger and Elsner, Reference Jagger and Elsner2006):
 $$\hbox{RP} = 1/[\exp(\lambda_d F(x \vert \eta, \zeta, \sigma, \mu)]$$
where λd is assumed to follow a Poisson process as in Jagger and Elsner (Reference Jagger and Elsner2006).Footnote 15 Given the large amount of uncertainty involved in estimating the parameters, we generated 5 and 95 per cent confidence limits by bootstrapping our sample 1,000 times with replacement.
Estimated fiscal shortages, as a percentage of fiscal revenue, are shown in table 8 for 10, 20, 50, and 100 year events, along with their confidence bands. As can be seen, 10 year events differ considerably across islands. More specifically, the island with by far the most likely largest fiscal loss in the short term is the Bahamas, which should expect losses of up to 48 per cent of fiscal revenue every ten years. Other countries with relatively large fiscal shortages due to hurricanes are Anguilla and Haiti, standing at 2.4 and 2.8 per cent, respectively. In contrast, the remaining islands should expect only small fiscal losses on a frequent basis. As one considers less frequent tropical storms, expected fiscal losses become non-negligible for all islands. For example, for the Bahamas, events any rarer than 20 years are likely to result in a complete loss of revenue. Although for all the other islands the budget deficit will not be quite as large, it can still be considerable. For example, for Haiti, events occurring at least every 50 or more years will cause budget deficits that are around 20 per cent of ‘normal’ fiscal revenue. Even for the island with lowest expected fiscal shortage, namely St. Lucia, the shortage in fiscal funds is likely to be around 3 per cent.
Table 8. Return period events of fiscal shortages

Notes: Provides estimated fiscal shortages for 10 year return period event. Range in parentheses provides 95 per cent confidence interval of the frequency of the event (in return periods).
An important aspect to note with our estimated fiscal shortages in table 7, however, is the considerable amount of uncertainty involved in these sorts of predictions. In particular, a glance at the given return period confidence bands suggests that the return period of the suggested fiscal loss is not very precisely estimated. For example, for the 10-year period events, the lower band varies from 6 to 10, while the upper band is as large as 31. As one moves to less probable but more damaging events, this degree of uncertainty rises considerably, in many cases leading to the upper band being unbounded. Thus one needs to consider our estimated fiscal shortages with caution.
More generally, our results indicate that there is little doubt that the fiscal shortages from hurricanes are likely to have several impacts on the Caribbean economies. First, fiscal problems have been one of the main causes of the huge debt experienced by many of these countries. Indeed, some of the Caribbean countries are among the most indebted in the world. For example, recent estimates show that in Jamaica the debt ratio amounted to over 130 per cent of GDP between 2010–2014, and for Barbados and Antigua and Barbuda the debt ratio ballooned to over 100 per cent of GDP. This is partly explained by the global financial crisis, but is also likely due to the downfall in tourism in the aftermath of the 9–11 terrorist attack. More importantly, the region is prone to disasters which cost them between 2–3 per cent of GDP in losses every year. Second, the fiscal problem also has implications for poverty, inequality, unemployment, and crime levels in some of these countries. Fiscal stress reduces the ability of governments to finance expenditures in areas such as health and education and employment creation opportunities. This scenario is exacerbated by the debt problem which is the result of the fiscal shortage. Along the same line, the fiscal shortage also impacts transfers and subsidies to the poor and vulnerable groups of the population, thereby potentially worsening income inequality. A direct effect of increasing poverty levels, inequality, and lack of jobs is the ballooning of crime rates. In Jamaica and Trinidad and Tobago, for example, the homicide rate is estimated to be around 60 and 40 per 100,000 persons respectively.
5. Conclusion
We investigated the risk of short-term fiscal shortages due to tropical storm damages in the Caribbean. To this end we assembled panel data on fiscal revenue and expenditure coupled with losses generated from a damage model used by the Caribbean Catastrophe Risk Insurance Facility that is based on information on the valuation and geographical distribution of physical assets within islands, the physical features of storms, and asset specific damage functions. Our econometric results show that while fiscal revenue is contemporaneously reduced, there is no impact on fiscal expenditure. The results from looking at the dynamic responses of various components of expenditure and revenue reveal that current expenditure increases in the aftermath of a hurricane strike, but that there is no discernable effect on capital expenditure. On the revenue side, whilst revenue from income decreases, revenue from sales of goods and services increases. Finally, our estimates suggest that a one dollar increase in losses increases the monthly budget deficit by around 8 cents, or alternatively stated, mean monthly reduction in net fiscal income has been about 0.5 per cent since 2000.
Using loss data derived from historical hurricane tracks within a parametric bulk extreme value model, we find considerable differences in the expected fiscal shortage across islands, where some, such as the Bahamas, can expect large losses frequently, while others will only experience non-negligible fiscal shortages for very rare events. However, importantly, we also demonstrate that there is considerable uncertainty in these predictions. Thus while more generally our study indicates that hurricanes can have important impacts on Caribbean fiscal sectors and therefore islands should indeed consider insurance schemes such as the CCRIF as potentially beneficial, they must also realize that the nature of their risk profiles, which constitute an important parameter in the choice of policy they may want, is characterized by considerable uncertainty.
Supplementary material
The supplementary material for this article can be found at https://doi.org/10.1017/S1355770X18000244


