


Introduction
Coffee is one of the most internationally traded agricultural products; it is consumed by approximately one-third of the world's population (Chinchilla-Soto et al., Reference Chinchilla-Soto, Durán-Quesada, Monge-Muñoz and Gutiérrez-Soto2021), making it one of the most popular beverages. The global coffee trade is based on two species, Arabica coffee (Coffea arabica L.) and Robusta coffee (C. canephora L.) that represent about 99% of coffee production worldwide (Labouisse et al., Reference Labouisse, Bellachew, Kotecha and Bertrand2008; Chinchilla-Soto et al., Reference Chinchilla-Soto, Durán-Quesada, Monge-Muñoz and Gutiérrez-Soto2021). In Colombia, coffee is one of the main crops occupying an area of 853 700 ha with a production of about 833 400 t of green coffee in 2020 (Federación Nacional de Cafeteros de Colombia, 2021).
Crop production contributes substantially to climate change through activities associated with greenhouse gas (GHG) emissions or water, air and soil pollution (Fofack and Derick, Reference Fofack and Derick2020). The inappropriate and excessive use of nitrogen fertilizers can generate high nitrate contents in groundwater, causing environmental problems and contributing to the generation of GHG (Zheng et al., Reference Zheng, Luo and Hu2020). This scenario demands the use of sustainable strategies to improve the yield and quality of the harvested fruits and help the adaptation of crops (Del Buono, Reference Del Buono2020; Fofack and Derick, Reference Fofack and Derick2020).
Coffee cultivation is a source of by-products such as fresh pulp that constitutes between 40 and 50% of the harvested cherry coffee beans (Reichembach and de Oliveira-Petkowicz, Reference Reichembach and de Oliveira-Petkowicz2020). On a limited scale, coffee pulp can be used as compost (Murthy and Naidu, Reference Murthy and Naidu2012). However, much of the waste generated from the processing of coffee is not properly disposed of, thus generating serious environmental problems (groundwater and soil contamination) due to toxic leachates (tannins, terpenoids, caffeine, etc.) (Da Silveira et al., Reference Da Silveira, Mertz, Morel, Lacour, Belleville, Durand and Dornier2020). In recent years, coffee pulp has been studied to optimize its application in agriculture and used it as a raw material in the creation of several value-added products (aromatic compounds, organic acids, enzymes, etc.) (Rathinavelu and Graziosi, Reference Rathinavelu and Graziosi2005; Da Silveira et al., Reference Da Silveira, Mertz, Morel, Lacour, Belleville, Durand and Dornier2020). In this regard, the pyrolysis process can be an important alternative in the management of by-products such as coffee pulp, and its application can provide numerous benefits as a complement in the mineral nutrition of crops.
Biochar (BC) is a low-cost, carbon-rich product that is obtained through the thermal degradation of natural resources under a limited oxygen condition (pyrolysis) (Guo et al., Reference Guo, Ji, Rizwan, Li, Li and Chen2020). The result of the pyrolysis process receives two names depending on its use: (i) biochar, a soil conditioner to improve soil quality and crop productivity, and (ii) charcoal, intended for generation of power (Lehmann and Joseph, Reference Lehmann and Joseph2009). Carbon-based materials such as animal manure, plant waste and wood or crop residues can be used for manufacturing BC (Farhangi-Abriz et al., Reference Farhangi-Abriz, Torabian, Qin, Noulas, Lu and Gao2021). Wang et al. (Reference Wang, Jiang, Zhang and Yuan2020) have reported that interactions between BC, organic matter, soil biota and nutrient bioavailability to plants occur in a short time after applying BC to the soil. The use of BC can also help carbon sink and may improve the soil's physical and chemical properties under certain conditions, making it a sustainable alternative for the exploitation and use of by-products of an agroecosystem (Reyes-Moreno et al., Reference Reyes-Moreno, Fernández and Contreras2021).
Various research studies have focused on evaluating the effect of BC on the physiology of cultivated plants. Vaccari et al. (Reference Vaccari, Maienza, Miglietta, Baronti, Di-Lonardo, Giagnoni and Genesio2015) found that applications of 14 t/ha BC (obtained from wheat bran pellets) increased growth and nutrient concentration [nitrogen (N), phosphorus (P), potassium (K) and magnesium (Mg)] in tomato plants. Partey et al. (Reference Partey, Saito, Preziosi and Robson2016) also found that rice plants treated with 5 t/ha BC produced from teak (Tectona grandis L.) wood increased N uptake by 127% and obtained an average yield of 1.8 t/ha compared to plants not treated with BC (yield of 1.3 t/ha). The benefits of BC application as a complement to mineral nutrition have also been documented. Mete et al. (Reference Mete, Mia, Dijkstra, Abuyusuf and Hossain2015) concluded that applications of 20 t/ha BC (obtained from sawdust) in combination with a compound fertilizer (60N–175P–120K kg/ha) caused a greater P availability in the soil and increased the yield of three evaluated soybean genotypes. Similar results were also reported by Baiga and Rao (Reference Baiga and Rao2017) who observed that Chinese cabbage [Brassica rapa subsp. pekinensis (Lour.) Hanelt] plants treated with 10 t/ha BC derived from cogongrass (Imperata cylindrica (L.) Beauv.) in addition to 500 kg/ha N showed higher N uptake and yield.
The study of plant physiology on the response to BC application has gained importance in recent years (Al-Wabel et al., Reference Al-Wabel, Hussain, Usman, Ahmad, Abduljabbar, Sallam and Ok2018; Guo et al., Reference Guo, Ji, Rizwan, Li, Li and Chen2020; Sánchez-Reinoso et al., Reference Sánchez-Reinoso, Ávila-Pedraza and Restrepo-Díaz2020; Vijayaraghavan, Reference Vijayaraghavan2021). Some studies have reported that the use of BC as a soil amendment can significantly improve physiology and increase crop productivity (Abbas et al., Reference Abbas, Javed, Ali, Chaudhary and Rizwan2021; Graber et al., Reference Graber, Harel, Kolton, Cytryn, Silber, David and Elad2010). In addition, Zeeshan et al. (Reference Zeeshan, Ahmad, Hussain, Ahamd, Numan, Shah and Ahmad2020) reported that tomato (Solanum lycopersicum L.) plants registered and increase in the chlorophyll a, b, total chlorophyll and carotene contents (by 10, 45, 17 and 15%, respectively) with the application of 20 t/ha BC obtained from wood of Acacia arabica (L.) Delile. Similarly, Tanure et al. (Reference Tanure, da Costa, Huiz, Fernandes, Cecon, Junior and da Luz2019) indicated that soil amended with 5–60 g/kg BC (obtained from Eucalyptus spp.) showed higher stomatal conductance and photosynthesis rate in maize (Zea mays L.) plants, which could be related to the better crop nutritional status.
The application of BC alone may not have a significant effect on intensive crop production. However, its use as a supplement to mineral nutrition with chemical synthesis fertilizers may offer benefits through the immobilization and better regulation of mineralization of elements such as N, generating better uptake and crop nutrient status (Baiga and Rao, Reference Baiga and Rao2017). Information on the use of coffee harvest residues (pulp, in particular) as a source to obtain BC and the effects of the application of this type of BC alone or in combination with fertilizers is still scarce in tropical production systems such as coffee crops. Some studies have reported that the use of BC can stimulate plant growth and development through better nutritional status or leaf gas exchange properties (Baiga and Rao, Reference Baiga and Rao2017; Liao et al., Reference Liao, Niu, Liu, Chen, He, Luo and Ding2020). However, knowledge on the influence of BC use on coffee crop yield is limited. This research sought to study the use of coffee residues (pulp) as a source for the manufacture of BC and as a complement to the management of mineral nutrition in coffee trees. Therefore, the objective of this study was to evaluate the effect of the application of four different doses of BC (0, 4, 8 and 16 t/ha) obtained from coffee pulp and four levels of chemical fertilizers (CF; 0, 33, 66 and 100% of the nutritional requirements of the species) on the physiological responses (stomatal conductance), photosynthetic pigments, foliar concentration of nutrients (macro and micronutrients) and yield of coffee (C. arabica L. var. Castillo) trees.
Materials and methods
Plant material and growth conditions
The experiment was carried out at a coffee farm located in the Municipality of Chaparral, Department of Tolima, Colombia (3°49′39.2″N, 75°34′07.1″W, at an altitude of 1875 m a.s.l.), between August 2018 and August 2020. The environmental conditions (solar radiation, temperature and precipitation) during the experiment are shown in Fig. 1. The experiment was carried out using 3-year-old, field-grown coffee trees of the cultivar Castillo, spaced at 1.70 m × 1.30 m (4500 trees/ha). A sample of the superficial soil was collected (from top to 30 cm soil layer). Three soil cores were collected for each experimental unit and completely mixed into a single composite sample. These samples were packed into plastic bags and processed in the Water and Soil Laboratory of the Faculty of Agricultural Sciences, Universidad Nacional de Colombia, Bogotá. The soil characteristics were as follows: (i) pH of 5.50; (ii) effective cation exchange capacity (ECEC) of 11.51 meq/100 g; (iii) electrical conductivity of 0.17 dS/m; (iv) chemical characteristics – total N: 0.27%, Ca: 7.85%, K: 0.50%, Mg: 2.52%, Na: 0.15 meq/100 g, Cu: 1.40 mg/kg, Fe: 124 mg/kg, Mn: 65 mg/kg, Zn: 2.90 mg/kg, B: 0.07 mg/kg and P: 0.98 mg/kg and (v) loam texture (24% clay, 30% silt and 46% sand).

Fig. 1. Records of precipitation and solar radiation (a), relative humidity (b) and maximum and minimum average monthly temperature (c) for the Municipality of Chaparral, Department of Tolima, Colombia, during the experiment conducted to study the effect of the application of different doses of BC (0, 4, 8 and 16 t/ha) and levels of CF (0, 33, 66 and 100% of the nutritional requirements). The data were obtained from the nearest meteorological station [Chaparral (3°37′35.193″N, 75°32′35.483″W, altitude: 914 m a.s.l.)] of Meteoblue weather.
BC treatments and CF level
The BC used was derived from coffee pulp with intermediate pyrolysis at 500°C for 20 min using a rotary kiln (6 m long × 0.7 m internal diameter) (Tecsol, Bogotá, Colombia). The BC was analysed in the Water and Soil Laboratory of the Faculty of Agricultural Sciences, Universidad Nacional de Colombia, Bogotá, and this had the following characteristics: pH: 9.42; electrical conductivity: 19.4 dS/m; organic carbon (OC): 46.4%; ashes: 20.8%; N: 2.81%; P: 1.11%; Ca: 0.97%; K: 4.37%; Mg: 0.43%; Cu: 53.5 mg/kg; Fe: 2795 mg/kg; Zn: 110 mg/kg; B: 99.3 mg/kg; ECEC: 103 meq/100 g; OC/N: 16.5. The doses of BC used were 0, 4, 8 and 16 t/ha (BC0 = 0.0 kg/tree; BC4 = 0.75 kg/tree; BC8 = 1.50 kg/tree and BC16 = 3.00 kg/tree). The BC was applied only once during the development of the entire experiment in August 2018, i.e. 4 months after the last coffee harvest. Four different doses of BC were established based on the agronomic responses observed in other cultivated species (Sánchez-Reinoso et al., Reference Sánchez-Reinoso, Ávila-Pedraza and Restrepo-Díaz2020). The BC was applied at a radius of 30 cm from the base of the coffee tree trunk and subsequently covered with soil.
The treatments of CF levels were carried out in a fractional manner (two applications per year of evaluation = 100% CF) according to the recommendations of Sadeghian (Reference Sadeghian, Gast, Benavides, Sanz, Herrera, Ramírez, Cristancho and Marín2013). Fertilization was carried out using a simple 46N fertilizer (Urea, Yara, Colombia) and a compound 17N–6P–18K–2Mg fertilizer (Nutrimon-Café Producción, Monómeros S.A., Colombia), which delivered 114 kg/ha N, 24 kg/ha P2O5, 73 kg/ha K2O, 8 kg/ha MgO–S–B and 0.8Zn kg/ha at 100% rate. The levels of CF used were: CF0 = 0 g/tree of 17N–6P–18K–2Mg and 0 g/tree of urea; CF33 = 30 g/tree of 17N–6P–18K–2Mg and 7 g/tree of urea; CF66 = 60 g/tree of 17N–6P–18K–2Mg and 14 g/tree of urea and CF100 = 90 g/tree of 17N–6P–18K–2Mg and 22 g/tree of urea.
The doses were selected based on the physical and chemical analysis of the soil and the nutritional requirements reported by Salamanca-Jimenez (Reference Salamanca-Jimenez2017). Nutrients were applied in May and October of each year. The treatments were arranged in a split-plot design in completely randomized blocks. The main plots were the BC doses (0, 4, 8 and 16 t/ha) and the subplots were the levels of CF (0, 33, 66 and 100% of the nutritional requirements). The experimental unit consisted of five trees surrounded by 12 guard trees and each treatment had four replicates (four blocks), for a total of 320 trees throughout the experiment.
Leaf stomatal conductance
The stomatal conductance (g s) was recorded between 07.00 and 10.00 h using a steady-state porometer (SC-1; Meter, Pullman, WA, USA). The measurements were taken twice on the second pair of fully expanded leaves of a branch from the upper third of the tree according to the criteria described by Rodrigues et al. (Reference Rodrigues, Silva, Ferreira, Machado-Filho, Figueiredo, Ferraz and Ramalho2018).
Chlorophylls and chlorophyll a fluorescence
The relative chlorophyll content (Chl, At-leaf readings) and maximum quantum efficiency of PSII (F v/F m) were also measured on the second pair of fully expanded leaves of a branch from the upper third of the coffee tree. Chl was determined using a chlorophyll meter (At-leaf, FT Green LLC, Wilmington, DE, USA) in both years of the study. The Fv/Fm ratio was evaluated using a continuous excitation fluorometer (Handy PEA, Hansatech Instruments, Pentney, UK) after leaves were dark-adapted for 30 min using dedicated clips. At the end of the dark adaptation time, minimum fluorescence (F 0), maximum fluorescence (F m) and maximum quantum efficiency of PSII (F v/F m) were recorded. F 0 was measured using modulated light of low intensity (<0.1 μmol/m2/s) in order not to alter the variable fluorescence. F m was recorded using a saturating light pulse of 3000 μmol/m2/s for 0.8 s. Variable fluorescence (F v) was calculated by the difference between F m and F 0. Finally, the maximum potential quantum efficiency of PSII was calculated using the F v/F m ratio.
In 2020, the variables of fluorescence under light conditions were measured using a modulated fluorometer (MultispeQ V 2.0, PhotosynQ, East Lansing, MI, USA) according to the methodology described by Fernández-Calleja et al. (Reference Fernández-Calleja, Monteagudo, Casas, Boutin, Pin, Morales and Igartua2020). The readings were recorded following the ‘Photosynthesis RIDES MultispeQ v2.0’ protocol once the leaf was held by the equipment. The measurement of a single leaf took approximately 120 s.
The quantum efficiency of PSII under light conditions (Phi2), linear electron flux (LEF), total non-photochemical quenching (NPQt), fraction of light lost through unregulated processes of photosynthetic inhibition (PhiNO), and the fraction of light dedicated to non-photochemical quenching (PhiNPQ), active centres in PS1 (PS1Active Centres), open centres in PS1 (PS1Open Centres), over-reduced centres in PS1 (PS1Over-Reduced Centres) and oxidized centres in PS1 (PS1Oxidized Centres) were determined. Chlorophyll fluorescence performance parameters (F s, F m′ and F 0′) were estimated using a saturation pulse on light-adapted leaves. Steady-state chlorophyll fluorescence yield (F s) was determined using continuous actinic light. The sample was exposed to a brief saturation pulse of light to record an estimate of the maximum fluorescence yield under steady-state illumination (F m′) with steady-state NPQ levels (but with all PSII centres closed). The actinic light was turned off right after the saturation pulse and a pulse of far-red light (from an LED) was applied to completely oxidize the whole plastoquinone and primary quinone acceptor of PSII (Q A) and thus, estimate F 0 in the presence of steady-state levels of NPQ (but with all oxidized PSII centres) (Baker, Reference Baker2008). Finally, LEF was estimated by multiplying Phi2 × incident PAR × 0.5 (assuming an equal excitation distribution between PSII and PSI) × 0.84 (most common foliar absorbance coefficient for healthy C3 plants) (Krall and Edwards, Reference Krall and Edwards1992).
Foliar nutrient concentration, g s, Chl and chlorophyll a fluorescence parameters were determined 1 month before harvest (2nd week of March) for each year of evaluation, using fully developed leaves of branches from the upper third of each tree. Additionally, all data were collected from the three central trees in each experimental unit.
Foliar concentration of macro and micronutrients
To determine nutrient analysis, four to five fully expanded, healthy leaves were collected from the four cardinal points of the mid-canopy of each of the three central trees of each experimental unit. Leaves were collected in each evaluation year 1 month before harvest (2nd week of March) and processed in the Water and Soil Laboratory of the Faculty of Agricultural Sciences, Universidad Nacional de Colombia, Bogotá. The concentration of organic N was determined following the Kjeldahl digestion method. The amount of total P was quantified by colorimetric determination using the phosphomolybdic-vanadate method. The total major (Ca, K, Mg and Na) and trace elements (Cu, Fe, Mn and Zn) were determined by atomic absorption through the calcination method at 600°C and acid digestion with HCl. Finally, boron (B) was quantified by colorimetric determination according to the azomethine method.
Harvest, yield and agronomic efficiency
Ripe fruits [State 88 according to the Biologische Bundesanstalt, Bundessortenamt und Chemische Industrie – BBCH scale (Arcila-Pulgarín et al., Reference Arcila-Pulgarín, Buhr, Bleiholder, Hack, Meier and Wicke2002)] from the five trees in each experimental unit were harvested manually the 2nd week of April of each year of evaluation. The ripe and healthy fruits were separated using the flotation method because they are denser and sink in water (overripe and undeveloped coffee cherries float in water) (Sanz-Uribe et al., Reference Sanz-Uribe, Oliveros-Tascón, Ramírez-Gómez, Peñuela-Martínez, Ramos-Giraldo, Gast, Benavides, Sanz, Herrera, Ramírez, Cristancho and Marín2013). The coffee pulp was then removed without water using a traditional pulper (Eterna #3, Fundición Estrada Hermanos, Caldas, Colombia). The mucilage was removed by natural fermentation in plastic buckets for 16 h (Puerta-Quintero, Reference Puerta-Quintero2000). At the end of the fermentation period, the coffee beans were washed with clean water and placed on trays inside a covered dryer until attaining humidity between 10 and 11%. The weight of 100 beans and dry parchment coffee (DPC) yield (kg/ha) was recorded (Fajardo-Peña and Sáenz-Uribe, Reference Fajardo-Peña and Sanz-Uribe2004). The canopy volume of each tree was used as a covariate to adjust yield and was estimated from the quantification of the height and width considering the plant canopy as a spheroid (Restrepo-Díaz et al., Reference Restrepo-Diaz, Benlloch, Navarro and Fernández-Escobar2008). Finally, the agronomic efficiency (AE) was calculated as the ratio between the yield (kg/ha) of the treatment and the yield of the trees without fertilization (0 t/ha of BC and 0% CF), according to the methodology described by Xu et al. (Reference Xu, He, Pampolino, Johnston, Qiu, Zhao and Zhou2014).
Data analysis
A split-plot design with random blocks was used; the large plots were the four doses of BC (0, 4, 8 and 16 t/ha), and the small plots corresponded to the four levels of fertilization (0, 33, 66 and 100% of the nutritional requirements) for a total of 16 treatments with four replicates per treatment. The percentage values were transformed using the arcsine formula and, subsequently, an analysis of variance (ANOVA) with repeated measures was performed. Regarding DPC yield, an analysis by covariance was carried out using the volume of the plant on the ground as a covariate. When significant differences were observed, Tukey's HSD test was used at P ≤ 0.05. The data were analysed using software Statistix v 9.0 (analytical software, Tallahassee, FL, USA). Additionally, a principal component analysis (PCA) was performed using software InfoStat 2016 (Di Rienzo et al., Reference Di Rienzo, Casanoves, Balzarini, Gonzalez, Tablada and Robledo2016).
Results
Stomatal conductance, relative chlorophyll content and chlorophyll a fluorescence
The effects of the BC doses and CF levels on the different physiological variables in coffee trees are summarized in Table 1. The stomatal conductance (g s) showed differences (P ≤ 0.05) in the interaction between the factors in both evaluation periods (2019 and 2020). In general, g s was higher in coffee trees treated with 100% CF with the different doses of BC compared to trees without fertilization in both years. The progressive addition of BC generated a more noticeable increase in g s in 2020 (mainly in trees with 100% CF of their nutritional requirements), reporting values of ~425 mmol/m2/s and ~367 mmol/m2/s1 at a BC dose of 8 t/ha for 2019 and 2020, respectively (Figs 2(a) and (b)).

Fig. 2. Effect of the application of different doses of BC (0, 4, 8 and 16 t/ha) and levels of CF (0, 33, 66 and 100% of the nutritional requirements) on stomatal conductance (g s) (a and b), relative chlorophyll content (Chl, At-leaf readings) (c and d) and maximum quantum efficiency of PSII (F v/F m) (e and f) in 2019 and 2020. Bars represent the mean of four blocks ± standard error. Bars with the same capital letters refer to differences between year of evaluation (2019 and 2020). Lowercase letters refer to differences between BC doses and level of CF interaction. The same letters indicate that means are not statistically different according to Tukey's test at P ≤ 0.05.
Table 1. Summary of the ANOVA of the effect of the application of different BC doses (0, 4, 8 and 16 t/ha) and CF levels (0, 33, 66 and 100% of the nutritional requirements) on the physiological variables (g s: leaf stomatal conductance, Chl: chlorophyll content, F v/F m: maximum efficiency of chlorophyll ɑ), yield (DPC) and AE and the concentration of selected macro- and micronutrients of coffee trees during 2 years of experiments (2019 and 2020)

*, ** and *** are significantly different at probability levels of 0.05, 0.01 and 0.001, respectively.
Differences were also found between the treatments with BC and CF levels on Chl and F v/F m (Table 1). In summary, the trees treated with 0 t/ha BC + 0% CF registered the lowest value (61.76 and 54.73 At-leaf reading, for 2019 and 2020, respectively) (Figs 2(c) and (d)) and F v/F m (0.71 and 0.58, for 2019 and 2020, respectively) (Figs 2(e) and (f)) compared to the other treatments in their respective years of evaluation. F v/F m also showed a progressive increase with higher application rates of BC and CF, observing higher values in the group of trees without fertilization and with different doses of BC (0 t/ha BC = 0.58, 4 t/ha BC = 0.63, 8 t/ha BC = 0.71 and 16 t/ha BC = 0.69, for 0, 4, 8 and 16 t/ha BC) in 2020 (Fig. 2(f)). In addition, lower value of g s, Chl and F v/F m were found in 2020 in comparison with 2019, specially, in treatments without BC application.
The ANOVA showed that differences were also found between BC doses on chlorophyll fluorescence parameters during 2020 (Table 2). In general, five response groups were identified: (i) the values of NPQt, PS1Active Centres, PS1Over-Reduced Centres and PS1Oxidized Centres did not show significant differences with the addition of BC; (ii) a positive linear trend was observed on Phi2 with gradual applications of BC, attaining values of 0.66 in the trees treated with 16 t/ha BC; (iii) a negative linear trend was registered on PhiNO with increasing doses of BC, showing the highest values in trees with 0 t/ha BC (0.159); (iv) a cubic trend was registered on LEF regarding the dose of BC, with the highest values in plants with 4 t/ha BC (54.48) and finally, (v) quadratic and cubic trends were obtained on PS1Open Centres regarding the dose of BC, with the highest values in trees without BC application (0.23).
Table 2. Summary of ANOVA and polynomial contrasts in variables such as LEF, NPQt, quantum efficiency of PSII under light conditions (Phi2), fraction of light lost through unregulated processes of photosynthetic inhibition (PniNO), fraction of light dedicated to non-photochemical quenching (PniNPQ), active centres in PS1 (PS1Active Centres), open centres in PS1 (PS1Open Centres), over-reduced centres in PS1 (PS1Over-Reduced Centres) and oxidized centres in PS1 (PS1Oxidized Centres) in leaves of coffee trees treated with four doses of BC and different levels of CF for the evaluation period of 2020

L, linear; Q, quadratic; C, cubic according to the analysis of polynomial contrasts; CV, coefficient of variation.
a The data represent the average of four trees per treatment (n = 4).
*, ** and *** differ significantly at 0.05, 0.01 and 0.001, respectively.
A positive linear trend was evidenced on the parameters LEF (55.50), Phi2 (0.67), PhiNO (0.156), PS1Active Centres (3.44), PS1Open Centres (0.23), PS1Over-Reduced Centres (0.74) and PS1Oxidized Centres (0.08) with the gradual application of fertilizers, especially in trees with 100% CF. However, a negative linear trend was registered on NPQt and PhiNPQ with the increase of CF, attaining the lowest values in trees treated with 100% CF (1.15 and 0.19, respectively) compared to coffee trees with 0% CF (1.38 and 0.23, respectively).
Foliar nutrient concentration
Differences between BC or CF treatments were only found on the foliar concentration of macro and micronutrients (Tables 3 and 4). Among the primary macronutrients, N concentration did not vary in response to the gradual application of BC in the 2 years of evaluation. The foliar concentration of P showed quadratic and cubic trends for 2019 and 2020, respectively, attaining the highest records in trees treated with 4 and 16 t/ha BC. K registered a positive linear trend, also obtaining the highest foliar K concentration with 16 t/ha BC (1.68 and 1.67% for 2019 and 2020, respectively). Among the secondary macronutrients, Ca and Mg concentration responded to the BC treatments in 2019, attaining the highest concentrations with 8 t/ha BC (1.37 and 0.41%, for Ca and Mg, respectively). For these nutrients, differences were not observed in 2020. As expected, increasing levels of CF caused higher foliar concentrations of macronutrients. A linear positive trend was observed on macronutrients with the gradual increase of CF, finding the highest values in trees treated with 100% CF (N: 2.08 and 1.71%; P: 0.18 and 0.19%; K: 1.64 and 1.54%; Ca: 1.39 and 1.25%; Mg: 0.43 and 0.48% in 2019 and 2020, respectively) (Table 3).
Table 3. Concentration of macronutrients in leaves of coffee trees treated with four doses of BC and four levels of CF during 2 years of experiments (2019 and 2020)

L, linear; Q, quadratic; C, cubic according to the analysis of polynomial contrasts; CV, coefficient of variation.
*, ** and *** differ significantly at 0.05, 0.01 and 0.001, respectively.
a The data represent the average of four trees per treatment (n = 4).
Table 4. Concentration of micronutrients in leaves of coffee trees treated with four doses of BC and four levels of CF during 2 years of experiments (2019 and 2020)

L, linear; Q, quadratic; C, cubic according to the analysis of polynomial contrasts; CV, coefficient of variation.
*, ** and *** differ significantly at 0.05, 0.01 and 0.001, respectively.
a The data represent the average of four trees per treatment (n = 4).
The concentration of micronutrients Cu and Fe was not affected by the application of BC in either year. The foliar concentration of Mn registered a cubic trend for 2019, attaining the highest values in trees treated with 4 t/ha BC (187.5 mg/kg), but there were no significant differences in response to BC doses in 2020. Foliar concentration of B did not vary in 2019 in response to the gradual application of BC. However, a quadratic trend was evidenced in 2020, attaining the highest values in trees treated with 16 t/ha BC (67.81 mg/kg). BC application did not affect Zn concentration in either year. In general, there was a positive linear correlation between the concentration of micronutrients and the application of fertilizers, with the highest values recorded in coffee trees treated with 100% CF in both years of evaluation (Cu: 30.64 and 27.73 mg/kg; Fe: 145.25 and 152.13 mg/kg; Mn: 191.27 and 199.92 mg/kg; B: 50.64 and 79.79 mg/kg; Zn: 15.85 and 18.23 mg/kg in 2019 and 2020, respectively).
Yield, AE and PCA
DPC yield and AE showed differences (P ≤ 0.001) for the BC × CF interaction (Table 1). DPC yield was generally higher in coffee trees treated with some level of CF (33, 66 and 100%) compared to those without the application of fertilizers (0%) (Fig. 3). The gradual addition of BC increased yield, especially in trees managed with 66 and 100% of the nutritional requirements, attaining values of ~0.42 kg/ha at a dose of 8 t/ha BC in the evaluation period of 2019 (Fig. 3(a)). This effect was more noticeable in 2020, with a production close to ~0.57 kg/ha at doses of 8 and 16 t/ha BC (Fig. 3(b)). Similar trends were also found for the AE; the efficiency increased by ~73% in trees with 8 t/ha BC and 100% CF in 2019 (Fig. 3(c)). In 2020, an increase in AE of ~80% was evidenced in trees with 4 t/ha BC + 100% CF and close to ~120% in trees with 8 and 6 t/ha BC + 66% and 100% CF compared to trees treated with 0 t/ha BC and 0% CF (Fig. 3(d)). In addition, higher values of DCP and AE were registered in 2020 in comparison with 2019, specially, in treatments with BC application and 100% CF.

Fig. 3. Effect of the application of different doses of BC (0, 4, 8 and 16 t/ha) and levels of CF (0, 33, 66 and 100% of the nutritional requirements) on the yield of DPC (A and B) and AE (C and D) in 2019 and 2020. Bars represent the mean of four blocks ± standard error. Bars with the same capital letters refer to differences between year of evaluation (2019 and 2020). Lowercase letters refer to differences between BC doses and level of CF interaction. The same letters indicate that means are not statistically different according to Tukey's test at P ≤ 0.05.
Table 5 summarizes the correlation coefficients (r) that describe the degree of correlation between the physiological variables, yield and foliar nutrient concentration for 2019 and 2020. In general, the main effects of the application of BC and CF were evidenced in the 2nd year of evaluation. However, the yield (expressed as DPC) showed positive and significant correlations with g s, AE, N and Ca in the year 2019 (r between 0.34** and 0.75***; ** and *** differ significantly at 0.01 and 0.001, respectively). Additionally, a positive and significant correlation was observed between F v/F m and AE (r = 0.64***), and between g s and Chl (r = 0.49***) in response to the addition of BC and CF. In 2020, DPC had positive and significant correlations with g s, Chl, F v/F m, AE, N, K, Mg, Cu, Fe, Mn, B and Zn. Positive and significant correlations were also registered between g s and Chl, F v/F m, AE, N, K, Cu, Fe, Mn, B and Zn (r between 0.34** and 0.83***). However, Chl had weak positive and non-significant correlations (r < 0.3, P > 0.05) with P, Ca, Mg and Cu in trees treated with coffee pulp BC and different levels of CF. A similar trend was also observed in the correlation coefficients between F v/F m and N, Cu, B and Zn (r between −0.01 and 0.29).
Table 5. Pearson's correlation coefficient (r) between the different physiological variables (g s: leaf stomatal conductance, Chl: chlorophyll content, F v/F m: maximum efficiency of chlorophyll ɑ and AE: agronomic efficiency), yield (DPC) and the foliar concentration of selected macro- and micronutrients in response to the application of four BC and four fertilization levels in coffee trees

*, ** and *** differ significantly at 0.05, 0.01 and 0.001, respectively.
The PCA shows that the treatments are indicated by points, while the physiological and nutritional variables are represented by vectors (Fig. 4). PCA revealed that PCA1 and PCA2 corresponded to 56.9 and 13.1%, respectively, of the variation of the different physiological parameters studied in 2019 (Fig. 4(a)), whereas PCA1 and PCA2, respectively, represented 70.7 and 9.0% of the variation for 2020 (Fig. 4(b)). The vectors of nutrients (Mn, K, Cu, P, Mg, Ca and N) and physiological variables (Chl, g s, DPC and AE) have angles close to the origin, indicating a greater correlation between the physiological variables evaluated in 2019. Trees treated with 0, 4 and 8 t/ha BC + 100% CF and trees with 4 and 8 t/ha BC + 66% CF were in the far-right section of the biplot analysis (group V). On the other hand, the applications of 0 t/ha BC and 0% CF (group I) were located on the opposite side to group I, indicating a negative effect of the lack of nutrition in coffee trees on the physiological parameters studied. Additionally, three differential effects were observed on the physiological responses of coffee trees regarding BC and CF doses: (i) 0 and 16 t/ha BC + 33% CF; 4, 8 and 16 t/ha BC + 0% CF (group II) responded with the same trend as group I; (ii) 4 and 8 t/ha BC + 33% CF; 0 and 16 t/ha BC + 66% CF (group III) showed a less negative effect on the physiological behaviour of coffee trees. Finally, (iii) trees treated with 16 t/ha BC + 100% CF (group IV) showed a similar trend to group V, indicating a better response of the physiology of coffee trees to the application of BC and fertilizers.
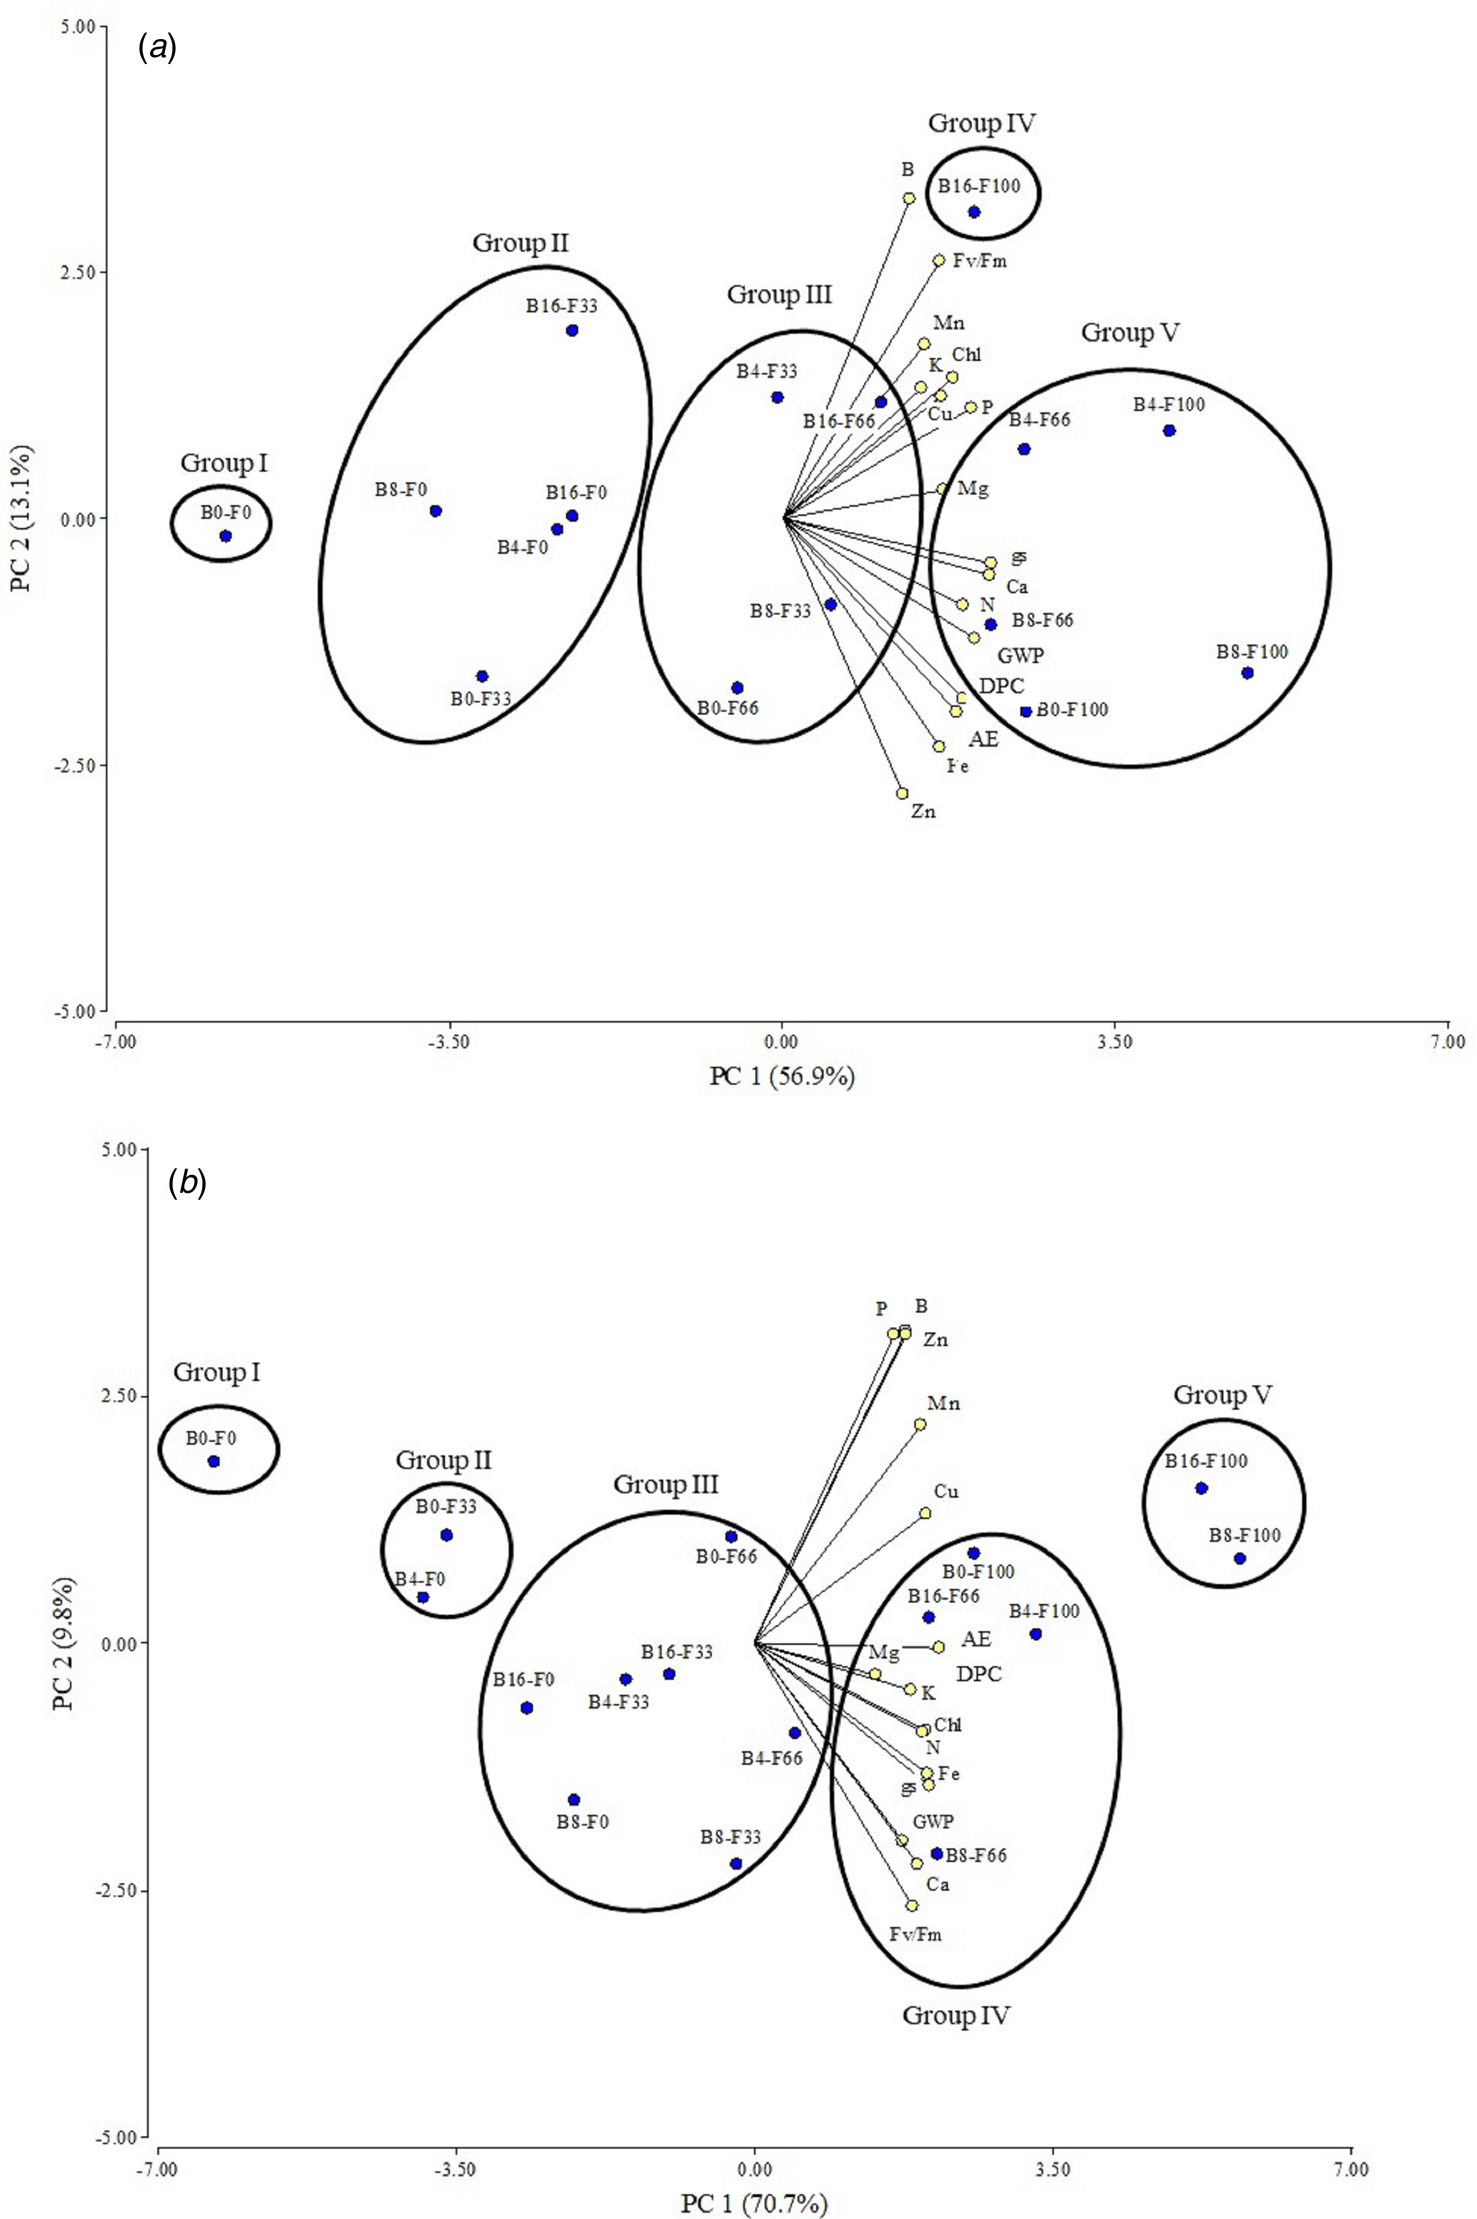
Fig. 4. (Colour online) PCA biplot of different physiological variables in coffee trees under different doses of BC and fertilization levels. The treatments are indicated by points, while the physiological and nutritional variables are represented by vectors. Chl: chlorophyll content (At-leaf readings); g s: leaf stomatal conductance; F v/F m: maximum quantum efficiency of PSII; DPC: dry parchment coffee yield; GWP: weight of 100 grains; AE: agronomic efficiency. Leaf nutrient concentration: N: nitrogen; P: phosphorus; K: potassium; Ca: calcium; Mg: magnesium; Cu: copper; Fe: iron; Mn: manganese; B: boron and Zn: zinc. B0: BC dose of 0 t/ha; B4: BC dose of 4 t/ha; B8: BC dose of 8 t/ha; B16: BC dose of 16 t/ha. F0: 0% of the nutritional requirements; F33: 33% of the nutritional requirements; F66: 66% of the nutritional requirements; F100: 100% of the nutritional requirements. (a) Evaluation period of 2019. (b) Evaluation period of 2020.
In the evaluation of the 2020 results, the vectors of nutrients (Ca, Mn, Cu, Mg, K, N and Fe) and physiological variables (AE, Chl, DPC and g s) had angles close to the origin, showing a greater correlation among the physiological variables analysed in 2020 (Fig. 4(b)). Similar trends were found in group I, which was represented by the same treatment in 2019. Group V was made up of trees treated with 8 and 16 t/ha BC + 100% CF. The results from this study confirmed three differential responses were observed regarding the doses of BC and CF: (i) 0 t/ha BC + 33% CF; 4 t/ha BC + 0% CF (group II) showed the same trend as group I; (ii) 8 and 16 t/ha BC + 0% CF; 4, 8 and 16 t/ha BC + 33% CF; 0 and 4 t/ha BC + 66% CF (group III) showed a lower negative effect on the variables studied; (iii) trees treated with 0 and 4 t/ha BC + 100% CF; 8 and 16 t/ha BC + 66% CF (group IV) registered a similar trend to group V. Finally, physiological (g s, Chl, yield) and nutritional (foliar concentration of N, K, Ca and Mg) variables would be useful tools to assess the response of coffee trees to amendment or fertilization treatments or the combination of both.
Discussion
Several studies have documented the use of BC as a soil amendment to improve nutrient availability and growth conditions in crops (Vassilev et al., Reference Vassilev, Martos, Mendes, Martos and Vassileva2013; Shaaban et al., Reference Shaaban, Van Zwieten, Bashir, Younas, Núñez-Delgado, Chhajro and Hu2018; Tian et al., Reference Tian, Li, Zhang, Wan, Xie, Chen and Li2018; Zhu et al., Reference Zhu, Yang, Zhao, Kang, Liu, He and Wei2019; Abbas et al., Reference Abbas, Javed, Ali, Chaudhary and Rizwan2021). In this research, physiological parameters such as stomatal conductance, photosynthetic pigment content, foliar nutrient concentration, yield (DPC) and AE were favoured in productive coffee trees with BC applications mainly at a dose of 8 t/ha, especially when applied along with different levels of CF (between 66 and 100% of the nutritional requirements) and this behaviour was evidenced even 2 years after the application of BC. Recent studies have concluded that the yield and physiological responses of crops can be improved with the incorporation of BC into the soil, mainly when the management of plant mineral nutrition is complemented with CF (Gao et al., Reference Gao, Shao, Lu, Zhang, Wu and Wang2020; Liao et al., Reference Liao, Niu, Liu, Chen, He, Luo and Ding2020; Zhang et al., Reference Zhang, Song, Wu, Yan, Gunina, Kuzyakov and Xiong2020). The positive results of the use of BC combined with other fertilization sources have also been found in wheat (Triticum aestivum L. cv. Amaretto) (Akhtar et al., Reference Akhtar, Andersen and Liu2015), tomato (Prasad et al., Reference Prasad, Tzortzakis and McDaniel2018; Ronga et al., Reference Ronga, Caradonia, Parisi, Bezzi, Parisi, Allesina and Francia2020), potato (Solanum tuberosum L.) (Gebre et al., Reference Gebre, Singh and Zewide2021) and nectarine (Prunus persica (L.) Batsch) (Sorrenti et al., Reference Sorrenti, Muzzi and Toselli2019). These authors concluded that BC incorporated into the soil (with doses that varied between 5 and 50% w : w, or between 4 and 50 t/ha) increased the foliar nutrient concentration, photosynthetic pigments, growth and crop yield.
Low nutrient availability reduces crop productivity since it negatively affects the photosynthetic rate and partitioning of assimilates (Lu et al., Reference Lu, Ren, Li, Hu, Zhang, Yan and Lu2020). The results found confirmed that coffee trees without an adequate nutrient supply (0 t/ha BC and 0% CF) showed a lower stomatal opening, chlorophyll content, F v/F m ratio (Figs 2(e) and (f)), foliar concentration of macro and micronutrients and yield. However, coffee trees treated with 4, 8 and 16 t/ha BC attained higher g s and nutritional status when the CF level was also higher (66 and 100% CF). Similar trends have been reported by Guo et al. (Reference Guo, Bornø, Niu and Liu2021), who evaluated the application of 2% w/w BC (obtained from pellets of Miscanthus sp. Straw) and two levels of N fertilization (low: 100 mg N/kg of soil; high: 200 mg N/kg of soil) in tomato plants. These authors indicated that plants with the application of BC along with a high level of N showed increased g s, transpiration and photosynthetic rate, suggesting that BC improved the plant water status. This behaviour was associated with the higher water-holding capacity of the soil that allows for greater root hydraulic conductivity. Hussien-Ibrahim et al. (Reference Hussien-Ibrahim, Adam-Ali, Zhou, Ibrahim-Elsiddig, Zhu, Ahmed-Nimir and Ahmad2020) also concluded that applications between 0.25 and 5.00% w/w BC (obtained from wheat straw) significantly increased g s and transpiration in sorghum plants.
Coffee trees treated with a CF level of 0% and without BC application also showed considerably lower values of Chl and F v/F m ratio compared to trees treated with 100% of the CF level and 0 t/ha BC. However, higher Chl and F v/F m ratio values were observed with the gradual increase in BC doses and CF levels, especially in trees with the application of 8 t/ha BC. Abbas et al. (Reference Abbas, Rizwan, Ali, Zia-ur-Rehman, Qayyum, Abbas and Ok2017) found that the contents of chlorophyll a and b in wheat plants registered an increase of up to 76% with gradual applications of BC (1.5, 3.0 and 5.0% w/w manufactured from rice straw). These authors suggested that the increase in the chlorophyll content is related to a higher concentration of nutrients in the soil in response to the application of BC.
Chlorophyll fluorescence analysis (F v/F m ratio) has been used to study photosynthesis efficiency in relation to the application of BC (Lyu et al., Reference Lyu, Du, Liu, Zhao and Lyu2016). Wang et al. (Reference Wang, Zheng, Wang, Yang, Chen, Chen and Wang2021) reported that applications of 10 and 20 t/ha BC (of unspecified source) improved the photosynthetic electron transfer rate and the proportion of open PSII reaction centres in leaves of peanut (Arachis hypogaea L.) plants and reduced energy dissipation in the form of heat, allowing the full use of the light energy absorbed by leaves for photosynthesis. These authors also indicated that BC applications increased N uptake from the soil and improved the leaf chlorophyll content, which stimulated the synthesis of various enzymes and electron transporters that enhance the photosynthetic function in leaves. Similar trends were also observed in this study, especially with applications above 8 t/ha BC that caused higher Phi2 and lower PhiNPQ values in coffee trees. These results agree with those reported by Tang et al. (Reference Tang, Zhang, Zhang, Chen, He and Zhang2020), who indicated that applications of 5% w/w BC (obtained from Canadian goldenrod, Solidago canadensis L.) favoured the proportion of open PSII reaction centres and reduced NPQ in Brassica chinensis L. plants compared to plants which did not receive BC.
Foliar analysis is commonly used to determine the nutritional status of crops (level of deficiency or excess) and develop nutrition management programmes based on soil fertility (Zabini et al., Reference Zabini, Martinez, Neves, Cruz and Valadares2021). The results obtained in this study suggest that, in general, the foliar concentration of macro and micronutrients were within the optimal ranges for coffee cultivation in both years of evaluation according to the information reported by Sadeghian (Reference Sadeghian, Gast, Benavides, Sanz, Herrera, Ramírez, Cristancho and Marín2013). However, foliar concentrations of N and K in coffee trees treated with 0 and 4 t/ha BC + CF levels of less than 66% showed lower values (within the deficiency ranges) compared to the other treatments, especially in the 2nd year of the trial (2020). The results of this study agree with those reported by El-Mageed et al. (Reference El-Mageed, Taia, Belal, Rady, El-Mageed, Shimaa and Semida2021), who indicated that applications from 0 to 5 and 10 t/ha of BC increased the N concentration by 20.9 and 22.5%, P by 25.4 and 16.9%, K by 20.7 and 28.0%, and Ca by 48, 2 and 76%, respectively, in Vicia faba L. plants. The increased N, P, K and Ca uptake in plants coincided with a high crop yield and was associated with a higher total concentration of N, available P2O5, ECEC and soil pH. A similar trend was observed in this research, suggesting that the increase in DPC yield is related to high values in the foliar concentration of macro (N, K and Mg) and micronutrients (Cu, Fe, Mn, B and Zn), especially in 2020.
A higher crop yield in response to the application of BC has been documented in different plant species (Ye et al., Reference Ye, Camps-Arbestain, Shen, Lehmann, Singh and Sabir2019; Gao et al., Reference Gao, Shao, Lu, Zhang, Wu and Wang2020; Farhangi-Abriz et al., Reference Farhangi-Abriz, Torabian, Qin, Noulas, Lu and Gao2021). Our results suggest that 8 and 16 t/ha BC accompanied by 66 and 100% CF generate higher DPC production compared to trees treated with 0 t/ha and 0% CF. Sadaf et al. (Reference Sadaf, Shah, Shahzad, Ali, Shahid and Ali2017) compared the use of 20 t/ha of four different BCs (obtained from poultry manure, farmyard manure, kitchen waste and wood chips) in addition to chemical synthesis fertilizers (87, 87 and 30 kg/ha NPK, respectively) in wheat plants. In general, the co-application of BC and fertilizers produced a higher soil carbon content, N uptake and yield compared to the control (without nutrients or amendments) or the single application of BC. This suggests that the complement of BC amendments with CF may be the most appropriate strategy to achieve higher grain yield in the short term and an improvement in the quality of infertile soils. The results of this study agree with those reported by Gebre et al. (Reference Gebre, Singh and Zewide2021), who found that the highest potato tuber yield was recorded in plants treated with 8 t/ha BC (from coffee husks) and 363 kg/ha of an inorganic fertilizer mixture (NPS). This response could be attributed to (i) the role of S to promote better partitioning of photoassimilates in shoots and tubers, and (ii) the development of lateral and fibrous rootlets by the addition of P, which contributes to water and nutrient uptake and increases photosynthesis.
The information obtained from this research shows several interesting advantages of the use of BC to manage the nutrition of coffee crops. It is important to indicate that the application of BC to the soil in combination with chemical synthesis fertilizers is an interesting option that has been used in other crops to improve their agronomic performance and plant yield (Ye et al., Reference Ye, Camps-Arbestain, Shen, Lehmann, Singh and Sabir2019; Gao et al., Reference Gao, Shao, Lu, Zhang, Wu and Wang2020; Abbas et al., Reference Abbas, Javed, Ali, Chaudhary and Rizwan2021), which is consistent with similar trends observed in coffee cultivation. Another remarkable contribution of this study is that the use of BC, in combination with CF, can improve the physiology of coffee trees through better stomatal conductance and nutritional status of plants (higher foliar concentration of P, Ca, Mg, Fe, Mn and B) (Fig. 5). This research also provides information that makes it possible to recommend the transformation of coffee pulp into BC through the process of pyrolysis and the use of this product in soils of coffee-growing areas since said amendment favours nutrient recycling and generates a positive impact on the plant–soil relationship (Kammann et al., Reference Kammann, Linsel, Gößling and Koyro2011; Lehmann et al., Reference Lehmann, Rillig, Thies, Masiello, Hockaday and Crowley2011; Das et al., Reference Das, Ghosh and Avasthe2020).

Fig. 5. (Colour online) Conceptual model of the physiological responses of the co-application of BC and CF in coffee trees. Blue or red arrows indicate the positive or negative effect of adequate or low mineral fertilization in coffee trees on the physiological and agronomic variables, respectively: g s: stomatal conductance; Chl: chlorophyll content: F v/F m: maximum quantum efficiency of PSII; DPC yield: dry parchment coffee yield; AE: agronomic efficiency and foliar nutrient concentration.
Conclusion
This study showed that the use of BC obtained from coffee pulp as a complement to inorganic fertilization generates a positive effect on the physiological responses of coffee trees. The application of 8 t/ha BC along with CF levels of 66 and 100% of the nutritional requirements generated a positive effect on different physiological variables. These results were mainly evidenced by the increasing in the DPC yield, AE, stomatal conductance, chlorophylls, chlorophyll fluorescence and foliar nutrient concentration in ‘Castillo’ coffee trees. In addition, this trend was observed even 2 years after the application of BC. This research also suggests that the use of BC manufactured with coffee pulp, especially at a dose of 8 t/ha, may be a complementary option in the management of mineral nutrition of commercial coffee crops. The application of this product would help reduce the use of CF in the medium term while utilizing waste produced within the same production chain.
Acknowledgements
The authors acknowledge the support of the Government of Tolima, the Administrative Department of Science, Technology and Innovation (COLCIENCIAS, 755-2016, for the training of high-level human capital for Tolima, Colombia) now known as the Ministry of Science, Technology and Innovation (Minciencias) for the funding support, and the Soil Sciences Research Group – GRICIS from the Universidad del Tolima.
Author contributions
A. D. S.-R. wrote the manuscript. H. R.-D. and L. L. revised and critically evaluated the manuscript. All authors contributed to the article and approved the submitted version.
Financial support
Funding support of the Government of Tolima, the Administrative Department of Science, Technology and Innovation (COLCIENCIAS, 755-2016, for the training of high-level human capital for Tolima, Colombia).
Conflict of interest
The authors declare no conflicts of interest exist.


