

Social science researchers are fundamentally interested in inferring causal relationships. In some disciplines, this is primarily achieved by experimental manipulation. By randomly assigning units to treatment conditions, experimentation allows researchers to isolate the effect of the treatment on the observed outcome. This allows researchers to have confidence that any differences in the outcome demonstrated by observations in the treated and control conditions were in fact caused by the treatment. While the value of randomized experimentation for causal inference is beyond debate, not all social science questions permit experimental manipulation. This problem is particularly acute for political science, where the nature of the subject matter frequently forecloses traditional randomized experimentation. Granted, political scientists can address certain questions with “natural” or “quasi-experiments” that replicate some (but not all) of the benefits of randomized experimentation (Sehkon Reference Sehkon2009; Gerber and Green Reference Gerber and Green2012; Sekhon and Titiunik Reference Sekhon and Titiunik2012). However, for many research questions, political scientists are forced to rely on exclusively observational data.
Political scientists are nevertheless just as interested in demonstrating causal relationships as are social scientists whose subject matter lends itself to greater control over experimental conditions. The demands of drawing appropriate causal inferences has spurred recent work in political science that has pointed to difficulties associated with inferring causality in observational studies where experimental manipulation is untenable (see Green and Gerber Reference Green and Gerber2002; Cook, Shadish and Wong Reference Cook, Shadish and Wong2008; Imai et al. Reference Imai, Keele, Tingley and Yamamoto2011; Keele and Minozzi Reference Keele and Minozzi2013). Though some of these difficulties have been addressed by methodological advances reviewed in Morgan and Winship (Reference Morgan and Winship2007) and Rosenbaum (Reference Rosenbaum2010), confounding by an unobserved variable remains a particularly vexing threat to inference. To interpret a statistical association between X and Y as causal, a researcher must be confident that there is no confounder that affects both X and Y. In observational studies, such confidence is often unwarranted. After all, the characteristics of confounders are, by nature, difficult to assess: scholars typically lack either the theoretical foresight necessary to anticipate a confounder’s presence, the tools necessary to measure its impact, or both. This limitation poses a fundamental problem for any causal claim using observational data.
Here, we introduce to the political science literature simultaneous sensitivity analysis—a tool specifically designed to help overcome this limitation. Simultaneous sensitivity analysis allows scholars to assess an inference’s sensitivity to unobserved confounders (Small et al. Reference Small, Gastwirth, Krieger and Rosenbaum2009). This is true, even absent any a priori expectations regarding the nature of the relationship between a potential confounder and the variables of theoretical interest. This tool is thus among recent methodological advances (see, e.g., Rosenbaum Reference Rosenbaum2010) that have the potential to drastically improve political scientists’ confidence in drawing causal inferences using observational data.
The article proceeds as follows. First, we situate simultaneous sensitivity analysis within a family of methodological tools designed to explore the robustness of causal inferences to confounding by unobserved covariates. Second, we sketch some basic theory of simultaneous sensitivity analysis and of the methodological context within which it is applied. Next, we apply the method to assess the sensitivity of an observed relationship between the quality of oral argument presentation and Supreme Court justice voting. We then present two empirical tests that indicate the presence of a confounder that, the sensitivity analysis suggests, threatens inference; in addition, we make a theoretical case for legal quality as a candidate confounder. We conclude with methodological and substantive implications.
Sensitivity Analysis: Overview and Intuition
With greater emphasis on drawing causal inferences has come more attention to the impact of unobserved covariates on such inferences. Various tools often subsumed under the label “sensitivity analysis” serve to quantify the impact of a hypothesized confounder—that is, an unobserved covariate that is theorized to be associated with a treatment and the response—on a putative causal effect’s statistical significance or size. The approach we use below is one of the so-called “Rosenbaum-style” sensitivity analyses.Footnote 1 Sensitivity analyses in this class are typically based on randomization inferenceFootnote 2 conducted after stratifying observations into sets within which observations are matched on observed covariates, and allow the analyst to specify at least one of two parameters, indicating a hypothesized confounder’s relationship to treatment (the cause of interest) and/or response (the outcome of interest).Footnote 3 Given this hypothesized confounder, the output from the sensitivity analysis is usually the maximum probability that the null holds, a point estimate for the minimum effect size, or an associated confidence interval. Figure 1 depicts a generic case in which the sensitivity analysis is useful.
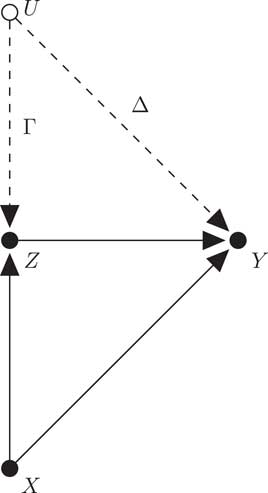
Fig. 1 An unobserved covariate U confounds the effect of treatment Z on outcome Y, despite adjustment for measured covariates X Note: In a simultaneous sensitivity analysis, analyst-specified parameters Γ and Δ quantify the strength of the hypothesized confounding relationships, thereby allowing inference about the true effect of Z on Y.
We now discuss some specifics in an informal manner; technical details are available in the cited sources and reviewed as needed for our application in third section. The Supporting Information describes relevant software.
A simple (though somewhat unsubtle) way to classify Rosenbaum-style sensitivity analyses is by the sensitivity parameters that are specified by the analyst, by the type of treatments and responses (i.e., ordinal/continuous or binary) that are admissible, and by the type of matching (e.g., pair, 1:k, or full) after which it is employed. We sketch basic developments, focusing on these distinctions. Foundational work in sensitivity analysis is reviewed in Rosenbaum (Reference Rosenbaum2002, 105–70) and focuses on primal sensitivity analysis for matched pairs. In a primal sensitivity analysis, the hypothesized confounder is assumed to have a near-perfect association with response, and the analyst specifies a single sensitivity parameter that indicates how much more likely an observation is to be assigned to treatment (and not control) due to the unobserved confounder.Footnote 4 Thus, the analyst specifies only a single parameter. Primal sensitivity analysis for matched pairs is probably the best known of the Rosenbaum-style sensitivity analyses; applications in political science include Hainmueller and Hangartner (Reference Hainmueller and Hangartner2013) and Sen (Reference Sen2014). Though these studies, like most applications, consider a binary treatment, ordinal or continuous treatments can also be analyzed: Rosenbaum (Reference Rosenbaum1989) gives clear and detailed discussion. Gastwirth, Krieger and Rosenbaum (Reference Gastwirth, Krieger and Rosenbaum2000) extends primal sensitivity analysis beyond pair matching. The case of matching (each treated subject) with multiple controls is detailed, though analysis after full matching is closely analogous. The authors consider a binary treatment with a continuous response.
Closely parallel to primal sensitivity analysis is dual sensitivity analysis (see Gastwirth, Krieger and Rosenbaum Reference Gastwirth, Krieger and Rosenbaum1998). As in a primal sensitivity analysis, a single parameter is specified, but in a dual sensitivity analysis the analyst-specified parameter indicates the degree of association between the confounder and response, and it is the relationship between the confounder and treatment that is assumed to be nearly perfect. Though dual sensitivity analysis is relatively rarely used, Gastwirth, Krieger and Rosenbaum (Reference Gastwirth, Krieger and Rosenbaum1998, 918) discusses designs for which it is appropriate, and cites an application.
Simultaneous sensitivity analysis for matched pairs is introduced by Gastwirth, Krieger and Rosenbaum (Reference Gastwirth, Krieger and Rosenbaum1998). In a simultaneous sensitivity analysis, the analyst specifies two parameters: one (Γ) describes the association between a hypothesized confounder and treatment, and the other (Δ) the association between confounder and response. Thus, primal and dual sensitivity analysis can be thought of as special cases of simultaneous sensitivity analysis. Gastwirth, Krieger and Rosenbaum (Reference Gastwirth, Krieger and Rosenbaum1998, sec. 3) presents applications with binary treatments, but the method can be used with any combination of binary or ordinal/continuous treatments and responses (Gastwirth, Krieger and Rosenbaum Reference Gastwirth, Krieger and Rosenbaum1998, 908). Small et al. (Reference Small, Gastwirth, Krieger and Rosenbaum2009) extends simultaneous sensitivity analysis to 1:k matching, matching with a variable number of controls, and full matching. The case of binary treatment and continuous/ordinal response is developed.Footnote 5
Simultaneous Sensitivity Analysis After Full Matching: Notation, Assumptions, Basic Theory
In this section, we specify some of the basic theory of simultaneous sensitivity analysis. We draw very heavily on Gastwirth, Krieger and Rosenbaum (Reference Gastwirth, Krieger and Rosenbaum1998) and Small et al. (Reference Small, Gastwirth, Krieger and Rosenbaum2009), to which we refer the reader for additional results and important details. Because, in our application, we use full matching, we present only the result from Small et al. (Reference Small, Gastwirth, Krieger and Rosenbaum2009). However, the discussion is largely applicable to other Rosenbaum-style sensitivity analyses as well. Specifically, the “Randomization Inference and Hypothesis Testing” and “A Model for Simultaneous Sensitivity Analysis” sections are wholly consistent with simultaneous sensitivity analysis after pair matching (Gastwirth, Krieger and Rosenbaum Reference Gastwirth, Krieger and Rosenbaum1998).Footnote 6
Full Matching
Full matching was introduced by Rosenbaum (Reference Rosenbaum1991), and is implemented in software written by Hansen (Reference Hansen2007); Hansen (Reference Hansen2004) gives an application of full matching, and describes some of its key properties for applied research. Full matching constructs a collection of matched sets containing either of one treated unit and any positive number of controls, or one control and any positive number of treated units (Hansen Reference Hansen2004, 613). Unlike 1:1 matching, full matching in general does not require that the analyst discard observations. Unlike fixed ratio matching (or any other matching), full matching guarantees that the weighted average distance between treated and control units is minimized, for any reasonable weight, for any match of the same size (Hansen Reference Hansen2004, 613).Footnote 7 Simply put, “a stratification that makes treated subjects and controls as similar as possible is always a full matching (Rosenbaum Reference Rosenbaum2010, 183).”
Randomization Inference and Hypothesis Testing
A full matching, then, constructs I matched sets, i=1, … , I each containing n i ≥2 units, of which m i are treated and n i −m i are controls. In each set, n i =1 or m i −n i =1, or both. Let Z ij =1 if unit j in set i is treated and Z ij =0 if it is control. r Cij is the response that unit j in set i would exhibit if placed in the control group—we will call r Cij “response under control.” r Tij the response that would be exhibited if unit j in set i were exposed to treatment. Only one of r Cij or r Tij is observed for a given unit: call this R ij —response under treatment assignment actually received (e.g., Rosenbaum Reference Rosenbaum2010, 21–63). Let r Ci be the n i -dimensional vector of responses under control in group i, and r C =[r C1 T , … , r CI T ] T . Define Z i and Z analogously.
Fisher’s (Reference Fisher1935) null hypothesis of no treatment effect states that r Tij =r Cij , ∀i, j (implying r Cij =R ij ). If treatment assignment within sets is random, this hypothesis can be assessed via randomization inference. In an observational study, there is no random assignment; however, by matching on all relevant pre-treatment covariates x, we assume that the probability of assignment to treatment within matched groups is equal (Rosenbaum Reference Rosenbaum2010, 65–90). Randomization inference can then proceed by “shuffling” treatment assignment, taking every permutation of each Z i while holding r Cij fixed, and calculating a test statistic t(Z, r C ), for each of these equiprobable shuffles, thereby determining a null distribution of the test statistic. The null hypothesis is tested by calculating a significance level: the proportion of the time t(Z, r C ) is greater than or equal to the observed test statistic. For larger data sets, calculating t(Z, r C ) for every possible treatment assignment is impractical, so computational shortcuts to calculate significance levels have been developed (e.g., Rosenbaum Reference Rosenbaum2010, 21–63).
A Model for Simultaneous Sensitivity Analysis
Randomization inference requires that all relevant pre-treatment covariates have been taken into account when constructing the matched sets. How can inference proceed when this requirement is not met? We are concerned here with a confounder that was not considered in the matching, and thus may be associated with both treatment and response, thereby violating the requirement that treatment assignment be random within strata.
More specifically, consider a binary confounder u ij . (This assumption is a conservative one, and not as limiting as it might seem at first glance.Footnote 8 ) Assume that u ij is the relevant confounder, in that, for every subject, treatment assignment is conditionally independent of response under control, given the observed covariates and u ij . Let u i be the n i -dimensional vector of u ij in group i, and u=[u 1 T , … ,u I T ] T .
In a simultaneous sensitivity analysis, two sensitivity parameters are specified. The sensitivity parameter γ describes the strength of the relationship between u ij and assignment to treatment, and the sensitivity parameter δ describes the relationship between u ij and response under control, as follows. Assume the following holds in the population before matching:
 $${\rm Pr}(Z_{{ij}} \,{=}\,1\!\mid\!\:\:\:{\bf x}_{{ij}} ,u_{{ij}} ){\,=\,}{{{\rm exp}(\beta _{i} {\plus}\gamma u_{{ij}} )} \over {1{\plus}{\rm exp}(\beta _{i} {\plus}\gamma u_{{ij}} )}},$$
and Pr(Z ij =0|x ij , u ij )=1−Pr(Z ij =1|x ij , u ij ).
Assume further that in the population, letting ζ i (u ij ) be a normalizing constant and κ i (r) an unknown function,
 $${\rm Pr}(r_{{Cij}} \,{=}\,r\:\!\mid\!\:{\bf x}_{{ij}} ,u_{{ij}} ){\,=\,}{\rm exp}\{ \zeta _{i} (u_{{ij}} ){\plus}\kappa _{i} (r){\plus}\delta ru_{{ij}} \} .$$
Any number of outcome models, including the logit, multinomial logit, Poisson, normal, and gamma can be written in the form of (2) (see Gastwirth, Krieger and Rosenbaum Reference Gastwirth, Krieger and Rosenbaum1998, 909). Note that β i and κ i vary with i because they are functions of x i .
The most directly relevant implications of this model are as follows. First, Γ≡e γ is, for any pair of observations with the same values of the observed covariates, but with different values of the confounder, the maximum ratio of the odds that one is treated, to the odds that the other is treated (e.g., Rosenbaum Reference Rosenbaum2002, 106–9). Also, if responses are binary, Δ≡e δ is, for any pair of observations with the same values of the observed covariates, but with different values of the confounder, the maximum ratio of that odds that one has higher response, to the odds that the other has the higher response. If responses are not binary, and one unit has response r and the other r*>r, the maximum ratio is e (r*−r)δ (see the discussion in Gastwirth, Krieger and Rosenbaum Reference Gastwirth, Krieger and Rosenbaum1998, 909–10, 916).
Simultaneous Sensitivity Analysis After Full Matching
Our ultimate quantity of interest is the maximum probability of obtaining the observed test statistic T=t(Z, r
C
)=Z
T
q under the null, for specified γ and δ. In other words—given a hypothesized confounder—we seek the maximum probability that we would obtain a test statistic associated with the treatment effect that is at least as large as the one present in the observational data, even if in fact the treatment has zero effect on the outcome. The key step in approximating this probability is finding, for each stratum i, the values of the confounder u
ij
that maximize μ
i
, the expectation of the test statistic’s null distribution (Gastwirth, Krieger and Rosenbaum Reference Gastwirth, Krieger and Rosenbaum2000; Small et al. Reference Small, Gastwirth, Krieger and Rosenbaum2009). (When more than one possible u
i
maximizes μ
i
, then—of such u
i
—the one that maximizes
 $$\sigma _{i}^{2} $$
, the variance of the null distribution, is used in approximating the maximum probability (for theoretical justification, see Gastwirth, Krieger and Rosenbaum Reference Gastwirth, Krieger and Rosenbaum2000, sec. 4).) A formal presentation of the approximation, from Small et al. (Reference Small, Gastwirth, Krieger and Rosenbaum2009, 205–6), is given in the Appendix.
$$\sigma _{i}^{2} $$
, the variance of the null distribution, is used in approximating the maximum probability (for theoretical justification, see Gastwirth, Krieger and Rosenbaum Reference Gastwirth, Krieger and Rosenbaum2000, sec. 4).) A formal presentation of the approximation, from Small et al. (Reference Small, Gastwirth, Krieger and Rosenbaum2009, 205–6), is given in the Appendix.
An Application: Oral Argument Quality and Supreme Court Justice Voting
As an application, we use simultaneous sensitivity analysis to reexamine the relationship between quality of oral argument and Supreme Court justice voting. Johnson, Wahlbeck and Spriggs (Reference Johnson2006) recently demonstrated a statistical relationship between oral argument quality and justice vote choice. This finding was contrary to the (then-)conventional wisdom that largely dismissed the influence of oral arguments on judicial behavior. Given the relatively limited role of legal argumentation in theories of Supreme Court decision making, this result has led many scholars of judicial politics to substantially reevaluate how they approach the study of judicial behavior and has spurred an active line of research, including examinations of how oral arguments reflect justices’ emotions (Black et al. Reference Black, Truel, Johnson and Goldman2011), indicate issue salience (Black, Sorenson and Johnson Reference Black, Sorenson and Johnson2013), and influence coalition formation (Black, Johnson and Wedeking Reference Black, Johnson and Wedeking2012).
Johnson, Wahlbeck and Spriggs (Reference Johnson2006) demonstrates this relationship by making use of novel data: oral argument “grades” assigned by Justice Harry Blackmun. Throughout his tenure on the Supreme Court, Justice Blackmun assigned each attorney presenting oral arguments either a numeric or letter grade. These grades, Johnson, Wahlbeck and Spriggs (Reference Johnson2006, 100, 111) explains, offer unique insight into Justice Blackmun’s substantive evaluation of the quality of the oral argument presented by each attorney. After standardizing these grades onto a common metric, the authors create an “oral argument grade” measure by subtracting the appellees’s standardized grade from the appellant’s (for additional details concerning the Blackmun grades, see Johnson, Wahlbeck and Spriggs Reference Johnson2006, 104). The authors then include this measure, along with a host of control variables, in a regression model predicting the likelihood of a party’s victory before the Court. The results indicate that parties represented by attorneys receiving relatively “better” oral argument grades were significantly more likely to win in the final vote.
Johnson, Wahlbeck and Spriggs (Reference Johnson2006, 100, 111) invites the reader to infer a causal effect from the statistical relationships presented. (In particular: “this analysis is the first study to demonstrate a causal relationship between oral arguments and justices’ votes [… and offers] systematic evidence of exactly how justices evaluate these arguments and whether they directly influence decisions” (Johnson, Wahlbeck and Spriggs Reference Johnson2006, 100).) However, as we have suggested above, statistical relationships consistent with causal effects do not imply them. To assert that the quality of an attorney’s relative oral argument presentation affects justice votes, we, at a minimum, must address the threat posed by an unobserved covariate that affects both relative oral argument quality and justice voting.Footnote 9 We now assess the extent of this threat with simultaneous sensitivity analysis.
The specific steps are as follows. First, we discuss the basic design of our observational study, and then explain and justify our approach to matching. After evaluating balance (and finding it satisfactory), we present a series of sensitivity analyses based on the matched data.
Data
Treatment
We are interested in comparing cases similar in terms of observed characteristics, but differing in terms of parties’ relative oral argument quality. We therefore define the following treatment and control groups. In every analysis we present, the control cases are those in which the plaintiff and the respondent attorneys had the same oral argument grade. In one set of analyses, we consider the treated group to be the cases in which the petitioner’s attorney had the better oral argument. In the other, we consider the cases in which the respondent’s attorney had the better oral argument to be the treated group. To compactly refer to these analyses, we write “petitioner-better” and “respondent-better,” respectively.
We further consider three thresholds for categorization as a treated case. According to the first, any case in which the petitioner (respondent) had a better argument grades is considered treated. Per the second, only cases in which grades differed by at least a half of a standard deviation are considered treated (and cases with smaller, but non-zero, differences are dropped). According to the third, only cases in which the difference in grades was at least 1 SD are considered treated. In short hand, we will call these analyses, respectively, “positive-difference,” “medium-difference,” and “large-difference.”
Response
The response (dependent variable) is the proportion of votes in favor of the party with the better oral argument. That is, in the petitioner-better analyses, the response is the proportion of votes in favor of the petitioner. In the respondent-better analyses, the response is the proportion of votes in favor of respondent. Thus, treated cases are expected to have greater responses than controls.
Observed covariates
We consider the set of covariates in the second column of table 3 in Johnson, Wahlbeck and Spriggs (Reference Johnson2006, 109), with one exception. Because we conduct a court-level—not a justice-level—analysis, instead of the justice-level Ideological Compatibility with Appellant, we balance on Court Median Ideology—as measured by the median justice’s Martin and Quinn (Reference Martin and Quinn2002) score—and whether there was a Liberal Decision Below (Spaeth Reference Spaeth2007).
Matching
We use full matching, matching cases—within propensity score calipers—on the Mahalanobis distance, with the optmatch package for R (Hansen and Klopfer Reference Hansen and Klopfer2006).Footnote 10 In constructing the matched sets, we are mindful of two, potentially competing, considerations: not discarding data, and achieving good balance on observed covariates between the control and treated groups. To these ends, we specify two ways of constructing matched sets.
Matching Specification 1
The first specification emphasizes matching all observations. The caliper is one-fifth of the standard deviation of the propensity scores. If two observations’ propensity scores differ by more than this amount, a large penalty (1000) is added to the Mahalanobis distance between the observations (e.g., Small et al. Reference Small, Gastwirth, Krieger and Rosenbaum2009, 207). In practice, this means that any treated observation can be matched to any control observation, but observations whose propensity scores differ by more than the caliper will be matched only if no match within the caliper is feasible, given the constraints of the problem. Following the recommendation in Hansen (Reference Hansen2004, 614), we use a thinning cap of 1/2 and a thickening cap of 2: informally, we allow “the number of treated subjects divided by the number of controls [to range in a set] from about half up to about twice what that ratio is in the sample as a whole.”
Matching Specification 2
The second specification favors better balance, at the cost of discarding observations. Again, a penalty is added to the Mahalanobis distance between two observations that differ in propensity scores by more than one-fifth of the standard deviation. However, matches between two observations that differ in propensity score by more than three-tenths of the standard deviation are absolutely barred (for a similar approach, see Haviland et al. Reference Haviland, Nagin, Rosenbaum and Tremblay2008).Footnote 11 As well, we impose a weak common support requirement, such that any treated observation with a greater propensity score than the control with the greatest propensity score, and any control with a smaller propensity score than the treated observation with the smallest propensity score, is dropped from the analysis. Lastly, we relax the restriction on the sizes of matched sets, allowing up to eight observations in a matched set.
Balance
Balance on observed covariates is evaluated in the supplementary material; we use the R package RITools (Hansen and Bowers Reference Hansen and Bowers2008; Bowers, Fredrickson and Hansen Reference Bowers, Fredrickson and Hansen2010; Koenker and Ng Reference Koenker and Ng2012). We report two statistics for each covariate, pre- and post-matching: the standardized difference of means and a p-value associated with a randomization inference-based test for conditional independence of treatment status and the covariate within a matched set.Footnote 12 Referring the reader to the supplementary material for details, we make a few observations. Every full matching does a credible job of improving balance. However (as expected), balance is better for the set of matchings in Specification 2 (where we are not constrained to keep all observations). Under Specification 2, every covariate in every analysis (i.e., petitioner-better, respondent-better, positive-, medium-, and large-difference) is balanced, according to conventional interpretations of our balance statistics. Under Specification 1, post-matching balance tends to be marginal for at least one covariate; in particular, US Appellant, US Appellee, SG Appellant, SG Appellee, and Relative Experience are occasionally problematic.
Sensitivity Analysis
Having constructed matched sets, we conduct a series of simultaneous sensitivity analyses (Small et al. Reference Small, Gastwirth, Krieger and Rosenbaum2009). In particular, we are interested in the maximum probability of obtaining the observed test statistic Z T q, given that the null hypothesis of no treatment effect holds, for specified levels of unobserved confounding. Here, Z T q is a version of the Hodges–Lehmann test statistic that is constructed by taking the sum of the aligned ranks for each treated observation’s response, and dividing this sum by half the maximum of the aligned ranks (Small et al. Reference Small, Gastwirth, Krieger and Rosenbaum2009, 208).Footnote 13 Defining Z T q in this way, and replacing each response with its aligned rank for the purposes of the sensitivity analysis, allows for a convenient interpretation of the sensitivity parameter Δ=exp(δ) (Small et al. Reference Small, Gastwirth, Krieger and Rosenbaum2009, 208).Footnote 14 In particular, Δ can be interpreted as the maximum factor increase in the odds that, for a typical treatment-control pair of observations in the same matched set, the observation with the greater value of the unobserved covariate u ij also has the higher response r Cij . For example, a hypothesized confounder that, in a typical pair of observations, doubled the odds of having a greater response would correspond to Δ=2.Footnote 15 We interpret Γ=exp(γ) as the maximum factor by which odds of assignment to treatment can vary for any two observations in a matched set. For example, a confounder that tripled the odds of being treated would correspond to Γ=3.
We implement Small et al.’s (Reference Small, Gastwirth, Krieger and Rosenbaum2009) sensitivity analysis in arsimsens, our user-written program for Stata (included with the replication materials).Footnote 16 Tables 1–3 present the results of the petitioner-better analyses for Matching Specification 2, for a range of Γ and Δ; the other analyses are relegated to Supplemental Tables 7–15 in the supplementary material. For each combination of Γ and Δ, the tables give a p-value: the maximum probability that the null holds, given the specified Γ and Δ. We highlight some key trends. For most specifications, the inference of a non-zero effect is sensitive to an unobserved confounder, even one that has only a weak-to-moderate relationship to both oral argument quality and Court voting. Generally, we can be more confident in the inference that oral argument has an effect when it is the petitioner who has the stronger oral argument. In particular, as Table 3 shows, if we compare only cases in which the petitioner had a much better argument than the respondent to cases where the parties’ oral arguments were of equal quality, the inference that oral arguments—in this subset of cases—affected justice voting is fairly robust. Nonetheless, even this inference would be sensitive to an unobserved confounder that has either (1) a moderately strong relationship to oral arguments and a very strong relationship to justice voting or (2) a very strong relationship to oral arguments and a moderate relationship to justice voting. (For example, p>0.05 for Γ=∞, Δ=1.5, and for Γ=1.5, Δ=∞.)
Table 1 Simultaneous Sensitivity Analysis for Selected Values of Δ and Γ, Matching Specification 2

Note: petitioner-better, positive-difference cases are considered treated; balance is evaluated in Supplemental Table 1. See text for details.
Table 2 Simultaneous Sensitivity Analysis for Selected Values of Δ and Γ, Matching Specification 2

Note: petitioner-better, medium-difference cases are considered treated; balance is evaluated in Supplemental Table 2. See text for details.
Table 3 Simultaneous Sensitivity Analysis for Selected Values of Δ and Γ, Matching Specification 2

Note: petitioner-better, large-difference cases are considered treated; balance is evaluated in Supplemental Table 3. See text for details.
How might one assess whether a particular combination of Γ and Δ is plausible? Given the nature of confounding, direct empirical assessment will not be available. Rather, theory- and subject-specific knowledge (Does the literature suggest the presence of a relevant unmeasured covariate?) is required; ideally, this can be supplemented with indirect empirical tests used to give some sense of a confounder’s characteristics. Continuing with the case of oral arguments, we next suggest how such an inquiry could proceed, examining a possible confounder theoretically and empirically.
Evaluating the Confounder: Theory and Evidence
The results of our sensitivity analysis prompt two broad questions. First: What could be a confounder? Below, we offer an some theoretically informed speculation, based on our reading of existing scholarship on judicial decision making, that legal quality is a candidate confounder. Second: Can we detect the presence of a confounder that threatens inference about the effect of oral arguments? We do so by presenting two empirical tests suggesting an affirmative answer.
It is crucial to distinguish between the means by which we address these questions. Our empirical tests will show that a confounder exists, but can say nothing about what the confounder is. We rely on a review of relevant literature to make a theoretical case for legal quality as an intuitively plausible confounder, but our argument is only speculative. We must be clear that we are in no position to make causal claims about legal quality.Footnote 17
Theoretical Expectations
Dominant theories of judicial behavior agree that Supreme Court justices are motivated by their policy preferences when casting votes (Rohde and Spaeth Reference Rohde and Spaeth1976; Segal and Spaeth Reference Segal and Spaeth1993; Epstein and Knight Reference Epstein and Knight1998; Maltzman, Spriggs and Wahlbeck Reference Maltzman, Spriggs and Wahlbeck2000; Segal and Spaeth Reference Segal and Spaeth2002). According to these perspectives, legal factors—which represent the unique considerations associated with the jurisprudential nature of judicial decision making—play at most a minor role in constraining the choices of justices (for discussion, see Segal and Spaeth Reference Segal and Spaeth2002, 92–6). But as noted above, a recently resurgent literature in the field of judicial politics examines the possible influence these legal factors (oral arguments among them) on Supreme Court decision making (Gillman Reference Gillman2001; Richards and Kritzer Reference Richards and Kritzer2002; Friedman Reference Friedman2005; Bailey and Maltzman Reference Bailey and Maltzman2008; Hansford and Spriggs Reference Hansford and Spriggs2008; Bartels Reference Bartels2009; Lax and Rader Reference Lax and Rader2010; Bailey and Maltzman Reference Bailey and Maltzman2011).
As difficult as it is to evaluate whether legal factors matter for Supreme Court decision making (Segal and Spaeth Reference Segal and Spaeth2002, 48–53), assessing how legal factors matter poses a distinct set of complications. To effectively address either of these questions, it is important to distinguish conceptually between the different types of legal factors. Our theoretical framework is inspired by discussion in Baum (Reference Baum1997, 72–6), which considers legal influence in general, and offers some guidance in distinguishing between legal factors. Our framework examines, in turn, three types of legal factors: legal doctrine, case facts, and legal argumentation.Footnote 18
The possible influence of legal doctrine is an outgrowth of the common law nature of the American legal system. In such a system, policy develops not only through legislation but through the aggregation of judicial decisions. This process creates a corpus juris that evolves slowly and is fundamentally resistant to radical change (Stone Reference Stone1936). Judges operating within this type of legal system are therefore expected to demonstrate strict fidelity to legal precedents. Scholars attempting to verify the influence of legal doctrine have examined a number of potential mechanisms, including jurisprudential regimes (Richards and Kritzer Reference Richards and Kritzer2002, but see Lax and Rader Reference Lax and Rader2010), precedent (Spaeth and Segal Reference Spaeth and Segal1999; Bailey and Maltzman Reference Bailey and Maltzman2008; Hansford and Spriggs Reference Hansford and Spriggs2008; Bartels Reference Bartels2009; Bailey and Maltzman Reference Bailey and Maltzman2011) and theories of constitutional interpretation (Howard and Segal Reference Howard and Segal2002).
A related, but distinct, set of legal factors stem from the nature of the case itself. Case facts are not the result of choices made by judges or the parties to the case; rather, they are the independent set of facts that existed before the dispute rose to the status of a legal challenge. Scholars have examined the possible influence of case facts in a variety of circumstances, such search and seizure (Segal Reference Segal1984),Footnote 19 the death penalty (George and Epstein Reference George and Epstein1992), establishment of religion (Ignagni Reference Ignagni1994), and obscenity (McGuire Reference McGuire1990). Legal doctrine is frequently dependent on case facts. Most legal doctrines compel future judges to approach different fact situations through the lens of a test or rule laid down in a previous decision(s). Therefore, while conceptually distinct, legal doctrine and case facts are typically dependent on one another.
The final set of legal factors, legal argumentation, describes the possible influence of external players on the choices of judges. Legal argumentation is distinct from both case facts and legal doctrine. While the latter two are a function—at least in part—of the case itself, the former is entirely a function of the advocates before the court. The effect of legal argumentation can be observed when advocates, presenting case facts and legal doctrine in a manner favorable to their preferred outcome, persuade a court previously disinclined to adopt that preferred outcome to do so. There are a variety of opportunities for this type of persuasion, and scholars have examined how considerations like lawyer experience (Galanter Reference Galanter1974; McGuire Reference McGuire1995; McAtee and McGuire Reference McAtee and McGuire2007), briefs on the merits (Corley Reference Corley2008; Wedeking Reference Wedeking2010), on petition for certiorari, and as amici (Spriggs and Wahlbeck Reference Spriggs and Wahlbeck1997; Collins Reference Collins2004; Corley Reference Corley2008), influence the decision-making process. Clearly, oral arguments (Johnson Reference Johnson2001; Johnson Reference Johnson, Wahlbeck and Spriggs2004; Johnson, Wahlbeck and Spriggs Reference Johnson2006) fall in the category of legal argumentation as well—thus, we can think of oral arguments as one element of one set (legal argumentation) of legal factors.
We urge that scholars examining the influence of legal factors (either generally or specifically) consider their potentially interdependent nature. If certain (or even most or all) legal factors are inherently inseparable, this presents a (potentially unsolvable) challenge for drawing casual inferences concerning the unique influence of a single factor. (This threat looms especially large, of course, when not all relevant factors can be measured.) We suggest that the extent to which one party has a more viable legal position is unlikely to be driven by any one legal factor alone. One might reasonably expect that the individual elements of legal argumentation (e.g., oral arguments, merits briefs, cert briefs) are at least moderately associated with one another. And because legal argumentation is dependent on case facts and governing legal doctrine, it may well be that evaluations of oral argument quality will be related to an evaluations of the overall legal quality of the party’s position.Footnote 20 Assuming we are right about this, it is useful to conceptualize legal quality as lying in the intersection of a set of closely related legal factors.
The relationship between legal quality and justice voting should be weaker than the relationship between oral arguments and legal quality. Many theories of Supreme Court decision making allow for the possibility that legal factors could influence judicial choices. In perhaps the most famous formulation, Gibson notes that “judges’ decisions are a function of what they prefer to do, tempered by what they think they out to do, but constrained by what they perceive is feasible to do” (Reference Gibson1983, 9). Legal factors are theorized to potentially limit the choices justices make, either because they believe that legal factors compel them to behave in a certain manner or constrain them in pursuing their policy goals.Footnote 21
The above discussion is inherently speculative in nature. We must emphasize again that theory, by itself, can never definitively answer whether a confounder is present, and if so, what that confounder is. But theory is nonetheless useful (perhaps even necessary) for interpreting the results of a sensitivity analysis—that is, assessing whether a confounder with the characteristics that, according to the sensitivity analysis, threaten inference is likely to exist. In our application, we will be able to present ancillary empirical tests that indicate the presence of a confounder and give some sense of its characteristics. But such an exercise will not always be possible, and it is then, especially, that subject-specific theory becomes indispensable for evaluating the confounding threat.
A Test at the Certiorari Stage
Our first test designed to probe for a confounder begins in what is, at first glance, an unlikely place: the agenda-setting stage of the judicial decision-making process. The certiorari (cert) vote affords a critical test for the independence of oral arguments from legal quality (or some other factor observable to the justices at the agenda-setting stage). This is because of the temporal ordering of the events—cert voting occurs before oral arguments. Therefore, if oral argument grades are truly independent of all potential confounders—including other unmeasured legal factors—there should be no relationship between the grades and the likelihood of a justice voting to grant cert. However, if oral argument grades are confounded, we may observe such a relationship at the agenda-setting stage.
Data and measurement
To test our hypotheses, we analyze individual justice cert and jurisdictional votes in cases heard by the Burger Court (1970–1985), for which oral argument grades are publicly available.Footnote 22 Our dependent variable is whether a justice votes to hear a case (=1) or not (=0). The key independent variable is oral argument grade. When the petitioner receives a higher score than the respondent, we expect the justices to be more likely to vote for a grant (i.e., in favor of the petitioner). If our intuition is correct, oral argument grade should be positively signed.
We include a number of other variables that have been demonstrated in the agenda-setting literature to influence certiorari voting (Caldeira and Wright Reference Caldeira, Wright and Zorn1988; Caldeira, Wright and Zorn Reference Caldeira and Wright1999). All of the variables, unless otherwise noted, are drawn from the Expanded Burger Court Judicial Database (Spaeth Reference Spaeth2007). Several variables stem from the actions of the lower courts. These include Conflict, which takes the value of one if the Court reported to hear a case to resolve a conflict between or among circuits, Unconstitutional, which takes the value of one if a city, state, or federal law was declared unconstitutional by any court below, Intermediate Reversal, which takes the value of one if the court being reviewed by the Supreme Court reversed a lower court decision and Dissent, which takes the value of one when the Supreme Court noted a dissent in the court whose decision it reviewed. Variables capturing characteristics of legal parties have also been demonstrated to affect cert voting. These include US Petitioner, which takes the value of one if the appellant was the US government and Amicus Brief, which is coded one if at least a single amicus brief was filed in a court below. Further, we control for case characteristics. Specifically, as there have been suggestions that civil liberties cases may be more likely to be heard (Tanenhaus et al. Reference Tanenhaus, Schick, Muraskin and Rosen1963; Caldeira, Wright and Zorn Reference Caldeira and Wright1999), we include a variable that indicates whether a case involves Civil Liberties. Finally, we include a control variable that accounts for a justice’s ideological relationship to the parties. We follow the modification of Martin and Quinn (Reference Martin and Quinn2002) (MQ) scores made by Johnson, Wahlbeck and Spriggs (Reference Johnson2006). MQ scores are a vote-based ideal point estimate scaled so that the mean score is near 0, and the more conservative a justice, the higher his score. We rescale these scores to indicate Ideological Affinity with the petitioner: for conservative lower court decisions (where the petitioner presumably seeks a liberal outcome at the Supreme Court), we take the negative of each justice’s MQ score, and for conservative lower decisions, we utilize the unmodified MQ score.Footnote 23 Because the dependent variable is dichotomous, logistic regression (logit) techniques are employed. To account for possible non-independence of errors, standard errors are clustered by justice.
Results
The maximum likelihood estimates from a logit model predicting individual justices’ votes to hear a case are presented in Table 4.Footnote 24 Most of the control variables behave as expected. Most importantly, oral argument grade is positively signed and statistically significant. All things being equal, justices are more likely to vote to grant a petition for cert when the attorney for the petitioner ultimately earns a higher grade in oral argument than the attorney for the respondent. Although the association is relatively modest when a justice and the petitioner are ideologically aligned, when a justice is only “somewhat close” or “very far” from the petitioner, changing the relative oral argument grade from its minimum to its maximum is associated with a 20 percentage points increase in the likelihood of a vote to grant. The result is robust to a number of model specifications. Even if we add to our baseline model the full suite of control variables from Johnson, Wahlbeck and Spriggs (Reference Johnson2006, 109) designed to control for lawyer quality, the relationship remains.
Table 4 Relationship Between Oral Argument Grade and Justice Cert Voting

Note: dependent variable: Did justice vote to hear case? (1=yes). Logit coefficients; standard errors in parentheses, clustered on justice. N=2843.
*p<0.05, **p<0.01, ***p<0.001.
How should we interpret the demonstration of a significant relationship between oral argument grades and the decision to grant cert? Plainly, it cannot be oral argument performance that affects the cert vote. Rather, the results can only be explained by the existence of a confounder that is significantly associated with oral arguments and observable to the justices before the cert vote. Thus, we think that legal quality remains a plausible candidate confounder: cases in which the petitioner occupies the preferable legal position are more likely to be granted cert, and the strength of the parties’ respective legal positions is known to the justices before cert voting. We hasten to add, though, that all the empirics show here is that a confounder observable to justices at the cert stage exists.
As relevant to our sensitivity analyses, we thus draw the following conclusions. There is an unobserved confounder that is—at least—substantially related to oral argument quality; moreover, this confounder has an appreciable impact on voting. And though this test shows the relationship between the confounder and cert voting, not merits voting, the association between these two sets of votes has been well demonstrated (see e.g., Caldeira, Wright and Zorn Reference Caldeira and Wright1999). In the next section, we explore further the relationship between the confounder and oral arguments, presenting a test that suggests that this relationship is very strong indeed.
A Test Comparing Two Votes at the Merits Stage
What can we say about the structure of the relationship between oral argument grades and our confounder? We proceed by comparing two stages of merits voting: the justices’ preliminary, conference vote on the merits and justices’ final, report vote on the merits. Here, we hypothesize that if oral arguments are appreciably distinct from our confounder (say, legal quality) oral argument grades should have a greater impact on the conference vote than on the final report vote. The logic is straightforward. Psychologists have long demonstrated (Ebbinghaus Reference Ebbinghaus1913) a strong correlation between memory and recency of exposure to information. Because oral argument occurs at a fixed point in time, its impact should be greatest at temporally proximate stages of the decision-making process (the conference vote) and fade overtime (the report vote). On the other hand, if the effect of oral argument is strongly confounded with that of legal quality or some other factor that consistently influences justices throughout the period between the two votes, we would expect the strength of the correlation between oral argument grade and voting to remain similar in the conference and final votes.
Data and measurement
To test this hypothesis, we estimate separate logit models predicting conference votes and final report votes. In addition to oral argument grade, we include the control variables specified by Johnson, Wahlbeck and Spriggs (Reference Johnson2006, table 1, column 2) in their original model of oral argument influence on merits votes.
Results
Column 1 of Supplemental Table 16, in the supplementary material, presents the results for votes cast at conference, and Column 2, the results for the final, report vote. The results are quite similar across both models. Oral argument grades correlate with merits votes both at the conference and report vote stages. However, we are chiefly interested in the substantive magnitude of the (putative) effect of oral argument grade. If the effect of oral argument grade on the probability of voting for the petitioner is appreciably stronger in the conference vote model, this would offer indirect evidence of the unique contribution of oral arguments to the decision-making process. Thus, in Figure 2 we plot the relationship between oral argument grades and the conference and report votes.Footnote 25 Figure 2 suggests there is very little appreciable difference in the impact across votes. The slopes of the predicted probabilities as they range from the minimum to the maximum values of oral argument grade are almost perfectly parallel for the two votes.Footnote 26
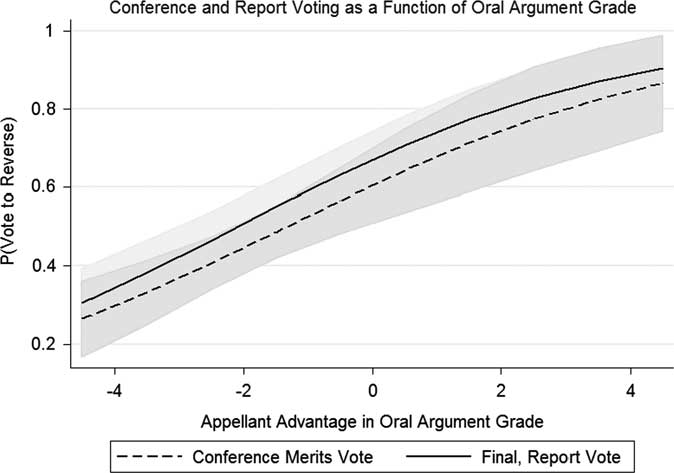
Fig. 2 Probability of voting to reverse, at conference, and at the final, report vote, as a function of oral argument grade
This result lends itself to two potential interpretations. First, it is theoretically possible that the estimated impact is consistent across decision-making stages because the effect of oral argument does not fade: it is not attenuated by the introduction of other influences on the process that are likely to be consulted between the conference vote and the report vote. In practice, this seems unlikely. At the latter stage, the effect of oral arguments should decrease as these arguments fade from memory; and it is exactly between the two stages that the justices begin to bargain over, persuade, and influence the votes of other justices (and the content of the majority opinion).Footnote 27 Scholars have consistently demonstrated that this collection of behaviors, frequently described as “the collegial game,” exerts a substantial influence on the choices justices make (Maltzman, Spriggs and Wahlbeck Reference Maltzman, Spriggs and Wahlbeck2000). Throughout the game, justices can readily refer to other potential influences, including the lower court opinions, merits and amicus briefs, and legal argumentation made by other justices through inter-chamber memoranda. This should attenuate the effect of oral argument.
A second, more likely, interpretation is that the putative effect of oral arguments is confounded by some other factor prominently before the Court between votes. That is, the observed consistency of the effect is driven not by the unique influence of oral arguments, but the effect of a confounder strongly associated with oral argument grades. We again speculate (but cannot prove) that legal quality is a plausible candidate confounder: a party who has the better oral argument is also more likely to be defending a position of higher legal quality as reflected in records, briefs, and memoranda. As justices refer to these documents, the inclination to favor the party with stronger legal support is reinforced.
But whatever the confounder, we believe that our result here (that the impact of oral argument grade essentially does not diminish between the two sets of merits votes) has clear implications for the relationship between the confounder and oral argument grades: that the relationship between two is very, very strong. In the language of our sensitivity analysis, it suggests a very high value of Γ. And our sensitivity analysis has shown that, given such a relationship between treatment and confounder, even a moderate relationship between the confounder and outcome threatens inference.
Can Some Confounders be Ruled Out?
We have argued that the preceding analyses are at least not inconsistent with the interpretation that legal quality is confounding the relationship between oral arguments and justice voting. But, given the unobserved nature of confounders, we cannot make an empirical case for any specific confounder. Acknowledging this reality, can we nonetheless narrow future inquiry by ruling out some potential confounders?
The relationship between cert voting and oral argument grades implies that some of the confounding is due to a variable, or variables, observable to justices before the cert vote. In principle, the confounder could be any single legal factor (or other covariate) then observable to the justices. But empirical assessment of the possibilities presents serious challenges. First, consider legal doctrine: it exists before the cert stage, but developing a test for its unique influence has proven difficult. Scholars have disagreed on the proper way to assess the constraining influence of precedent (see the debate between Spaeth and Segal (Reference Spaeth and Segal1999) and Gillman (Reference Gillman2001)) or doctrine (see the debate among Bartels (Reference Bartels2009), Richards and Kritzer (Reference Richards and Kritzer2002), and Lax and Rader (Reference Lax and Rader2010)).Footnote 28 A second potentially confounding legal factor that exists before cert are the facts of the case itself. We attempted to specifically test the role of case facts by examining whether oral argument grades would continue to predict final votes on the merits once we controlled for case facts. To do so, we focused on our analysis exclusively on search and seizure cases. We did so because of the well-developed case facts model Segal (Reference Segal1984) created to predict votes on search and seizure cases. Unfortunately, oral argument grade fails to predict final votes in this subset of cases before the inclusion of any case fact variables. As a result, no significance can be imputed to a null finding for oral argument’s effects after controlling for case facts, and so we are left unable to foreclose the possibility that case facts could account for the confounding we observe. A final potential factor is legal argumentation, which includes argumentation contained directly in the cert and reply briefs (and indirectly reflected in lower court opinions) and lawyer quality (as reflected in the preparation of briefs and the identity of the lawyers filing briefs). Because the relationship between oral argument grades and cert voting is robust to inclusion of controls for lawyer quality, we believe that the characteristics of the lawyers cannot be the confounder.
Thus, we are limited in what we can say about the factors that account for the confounding. We cannot offer a conclusive series of tests eliminating legal doctrine, case facts, or alternative forms of legal argumentation as factors individually responsible for the results. Indeed, as we have noted, it is possible that a covariate heretofore uncontemplated by scholars is the confounder.
Our case for thinking about the confounder as legal quality is essentially theoretical. We have argued that the components of legal quality may well be closely inter-related. After all, it is difficult to understand the relevance of case facts independent of the legal doctrine that structures how they should be considered, just as it is difficult to consider the proper application of legal doctrine in the absence of relevant case facts. And all of this has the potential to be shaped by the manner through which it is presented to a court. If we are right, it is appropriate to give consideration to legal quality as the confounder we have demonstrated. But no stronger claim can be made until a measure of legal quality is developed, its effect is isolated by adjusting for the other potentially relevant covariates, and that influence is found reasonably robust to confounding.
Conclusion
To recap, we have introduced and then applied a method of sensitivity analysis to assess the characteristics that a confounder would have to have, for it to threaten the inference that oral arguments affect justice voting. Next, we made a theoretical case for legal quality as a candidate confounder. We then presented two tests that indicated the presence of a confounder (plausibly, our candidate confounder)—one that appears to influence the judicial decision-making process both before “A Test at the Certiorari Stage section” and after “A Test Comparing Two Votes at the Merits Stage section” oral arguments; more to the point, the tests suggested that the relationship of this confounder to treatment and outcome are of a character that the sensitivity analysis had indicated threaten inference.
Substantively, the nature of the confounding relationship we uncover makes drawing inferences about the effect of oral arguments on justice voting problematic. Suppose momentarily, for the sake of concreteness, that we are correct to speculate that legal quality is the confounder. To validly conclude that oral arguments affect changes in justice votes, one must be confident that justices are influenced significantly through oral arguments, instead of through the variety of other mechanisms by which they may come to understand the parties’ relative legal quality. Moreover, even if such a conclusion could be validly drawn, it leaves unaddressed what is, arguably, the truly interesting counterfactual: would justice votes would be different if there were no oral arguments? To show this counterfactual dependence, in addition to causality, (e.g., Hitchcock Reference Hitchcock2007) one must show that a justice would not be influenced by the legal quality of a party’s position in the absence of oral arguments. Demonstrating this lack of influence would be difficult, both theoretically and practically.Footnote 29
In sum, given our empirical tests, we believe there is yet no warrant for the claim that oral arguments affect justice votes, let alone the claim that the votes are counterfactually dependent on oral arguments. But a door to further inquiry is opened. Identifying the confounder, perhaps by operationalizing and disentangling heretofore unmeasured legal factors, will no doubt require researchers to confront serious measurement and statistical challenges. But we anticipate that the importance of this line of research will be commensurate with its difficulty.
Methodologically, we have introduced to the political science literature a method of quantifying a putative causal effect’s sensitivity to unobserved confounding that is particularly useful when an analyst has a reasoned basis for approximating the relationship between a proposed confounder and the outcome of interest, and the confounder and the independent variable of interest. We then proposed two indirect tests for assessing the strength of these relationships; although our exact approach will not generalize to all similar problems, these tests may serve to motivate appropriate exercises in other applications. It is worth emphasizing that we went beyond the typical approach to sensitivity analysis, in that we actually attempted to empirically assess characteristics of the confounder. Additionally, note that our application is one that is particularly well suited for a sensitivity analysis: we have an unobserved confounder we cannot measure—and thus cannot directly adjust for—but we can still say something about the confounder’s strength of association with outcomes and (putative) causes of interest. In such situations, a simultaneous sensitivity analysis has much to recommend it. But we encourage that it be used to ensure that results are not fragile, even in cases where an unobserved confounder is merely a theoretical or hypothetical concern.
Supplementary Material
To view supplementary material for this article, please visit http://dx.doi.org/10.1017/psrm.2015.74
Appendix
The maximum probability of obtaining the observed test statistic, under the null, given confounding as specified by the model for simultaneous sensitivity analysis (A Model for Simultaneous Sensitivity Analysis section), is formally given as follows. Let m
i
be the number of treated units in set i, and m=[m
1, … , m
I
]
T
. For any vector w, define Orb(w) as the set containing every vector that can be obtained by permuting the coordinates of w. Let
 $${\bf \vec {r}}_{{Ci}} $$
be the vector of r
Ci
’s coordinates arranged in increasing order. In set i, for k=0, … , n
i
, define
$${\bf \vec {r}}_{{Ci}} $$
be the vector of r
Ci
’s coordinates arranged in increasing order. In set i, for k=0, … , n
i
, define
 $${\tilde{\bf u}}_{k} $$
as the vector with k zeros followed by n
i
−k ones. Small et al. (Reference Small, Gastwirth, Krieger and Rosenbaum2009, 205–6), relying in part on Gastwirth, Krieger and Rosenbaum (Reference Gastwirth, Krieger and Rosenbaum2000), shows
$${\tilde{\bf u}}_{k} $$
as the vector with k zeros followed by n
i
−k ones. Small et al. (Reference Small, Gastwirth, Krieger and Rosenbaum2009, 205–6), relying in part on Gastwirth, Krieger and Rosenbaum (Reference Gastwirth, Krieger and Rosenbaum2000), shows
 $$\mu _{{ik}} {=}\mathop{\sum}\limits_{{\bf z}_{i} \in{\rm Orb}({\bf Z}_{i} )} \mathop{\sum}\limits_{{\bf r}_{i} \in{\rm Orb}({\bf \vec {r}}_{{Ci}} )} {\bf z}_{i}^{T} {\bf q}_{i} ({\bf r},{\bf m})\:{{{\rm exp}(\gamma {\tilde{\bf u}}_{k} ^{T} {\bf z}_{i} )} \over {\mathop{\sum}\limits_{{\bf b}_{i} \in{\rm Orb}({\bf Z}_{i} )} {\rm exp}(\gamma {\tilde{\bf u}}_{k} ^{T} {\bf b}_{i} )}}{{{\rm exp}(\delta {\tilde{\bf u}}_{k} ^{T} {\bf r}_{i} )} \over {\mathop{\sum}\limits_{{\bf w}_{i} \in{\rm Orb}({\bf \vec {r}}_{{Ci}} )} {\rm exp}(\delta {\tilde{\bf u}}_{k} ^{T} {\bf w}_{i} )}}$$
and
 $$\sigma _{{ik}}^{2} \,{=}\,\mathop{\sum}\limits_{{\bf z}_{i} \in{\rm Orb}({\bf Z}_{i} )} \mathop{\sum}\limits_{{\bf r}_{i} \in{\rm Orb}({\bf \vec {r}}_{{Ci}} )} \left\{ {{\bf z}_{i}^{T} {\bf q}_{i} ({\bf r},{\bf m}){\minus}\mu _{{ik}} } \right\}^{2} \:{{{\rm exp}(\gamma {\tilde{\bf u}}_{k} ^{T} {\bf z}_{i} )} \over {\mathop{\sum}\limits_{{\bf b}_{i} \,\in\,{\rm Orb}({\bf Z}_{i} )} {\rm exp}(\gamma {\tilde{\bf u}}_{k} ^{T} {\bf b}_{i} )}}{{{\rm exp}(\delta {\tilde{\bf u}}_{k}^{T} {\bf r}_{i} )} \over {\mathop{\sum}\limits_{{\bf w}_{i} \,\in\,{\rm Orb}({\bf \vec {r}}_{{Ci}} )} {\rm exp}(\delta {\tilde{\bf u}}_{k} ^{T} {\bf w}_{i} )}},$$
with
 $$r{\,=\,}[{\bf \vec {r}}_{{C1}} ,\:\,\ldots\,,\,{\bf \vec {r}}_{{C,i{\minus}1}} ,\:\,{\bf r}_{i} ,\:\,{\bf \vec {r}}_{{C,i{\plus}1}} ,\:\,\ldots\,,\:\,{\bf \vec {r}}_{{CI}} ]^{T} $$
. Call
$$r{\,=\,}[{\bf \vec {r}}_{{C1}} ,\:\,\ldots\,,\,{\bf \vec {r}}_{{C,i{\minus}1}} ,\:\,{\bf r}_{i} ,\:\,{\bf \vec {r}}_{{C,i{\plus}1}} ,\:\,\ldots\,,\:\,{\bf \vec {r}}_{{CI}} ]^{T} $$
. Call
 $$\eqalignno{ & \mu _{{imax}} {\,=\,}\mathop {max}\limits_{k\,\in\,\{ 0,1,\:\,\ldots\,,\,n_{i} \} } \mu _{{ik}} \cr & A_{i} {\,=\,}\{ k\,\colon\,\mu _{{ik}} {\,=\,}\mu _{{imax}} \} \cr & \sigma _{{imax}}^{2} {\,=\,}\mathop {max}\limits_{k\,\in\, A_{i} } \sigma _{{ik}}^{2} . $$
Then, the maximum probability of obtaining test statistic T≥s, under the null, given confounding, is approximated by:
 $${\rm Pr}(T\geq s\:\!\mid\!\:{\bf \vec {r}}_{C} ,{\bf m},{\bf X},{\bf u}){\,=\,}1{\,-\,}\Phi \left( {{{s{\,-}\mathop{\sum}\limits_{i\,{=}\,1}^I \mu _{{imax}} } \over {\sqrt {\mathop{\sum}\limits_{i\,{=}\,1}^I \sigma _{{imax}}^{2} } }}} \right),$$
for any number s.


