Introduction
In organic vegetable production, many farmers rely on mechanical control practices such as tillage and postplanting cultivation, but they also employ hand weeding, flame weeding, mulching, and various cultural management practices aimed at preventing weed establishment and reducing weed–crop competition (Baker and Mohler Reference Baker and Mohler2015). Despite the variety of practices that organic farmers use, weeds are a major production constraint (Jerkins and Ory Reference Jerkins and Ory2016), and some management practices are labor intensive, potentially degrade soil health, or lead to large additions of weed seeds to the seedbank (Havlin et al. Reference Havlin, Kissel, Maddux, Claassen and Long1990; Lal Reference Lal1993). Long-term research is required to understand the cumulative effects of different management practices on weed communities. Long-term studies are also valuable because weed population and community dynamics are complex and are affected not only by the practices used, but also by the timing of practices relative to the life cycles of the weeds present in a field (Bond and Grundy Reference Bond and Grundy2001; Buhler et al. Reference Buhler, Kohler and Thompson2001; Cordeau et al. Reference Cordeau, Smith, Gallandt, Brown, Salon, DiTommaso and Ryan2017c). Although consumer demand for organic fruits and vegetables has increased steadily over the past three decades (USDA ERS 2017), long-term research on weeds in organic vegetable cropping systems is limited, especially in the northeastern United States.
Previous research on grain crops has shown that weed abundance and species richness in organic production is typically greater compared with conventional production (Cavigelli at al. Reference Cavigelli, Teasdale and Conklin2008; Davis et al. Reference Davis, Renner and Gross2005; Ryan et al. Reference Ryan, Smith, Mortensen, Teasdale, Curran, Seidel and Shumway2009). Results from the Sustainable Agriculture Farming Systems project at the University of California at Davis showed consistently greater weed cover and higher weed management costs in organic compared with conventional tomato (Solanum lycopersicum L.) production (Poudel et al. Reference Poudel, Horwath, Lanini, Temple and Van Bruggen2002). Weed density also tends to be more variable from year to year in organic compared with conventional crop production. Variability often stems from weather events that constrain weed management practices. For example, excessive rain after crop planting can delay or prevent mechanical weed management practices (Cavigelli et al. Reference Cavigelli, Teasdale and Conklin2008; Mohler et al. Reference Mohler, Frisch and Mt Pleasant1997; Posner et al. Reference Posner, Baldock and Hedtcke2008).
Weed communities in organic grain cropping systems are often dominated by spring-emerging, annual weeds that set seed late in the season but before cash crop harvest. For example, common lambsquarters (Chenopodium album L.), foxtail (Setaria spp.), and pigweed (Amaranthus spp.) have been reported in long-term experiments in Pennsylvania (Ryan et al. Reference Ryan, Mortensen, Bastiaans, Teasdale, Mirsky, Curran, Seidel, Wilson and Hepperly2010), Maryland (Cavigelli Reference Cavigelli, Teasdale and Conklin2008), and Michigan (Davis et al. Reference Davis, Renner and Gross2005). However, in vegetable cropping systems, both the timing of crop harvest and the frequency of tillage tend to select for a different set of weed species. Baker and Mohler (Reference Baker and Mohler2015) reported that organic vegetable farmers considered common purslane (Portulaca oleracea L.), common chickweed [Stellaria media (L.) Vill.], and hairy galinsoga (Galinsoga quadriradiata Cav.) as weed species that are problematic for production. Jabbour et al. (Reference Jabbour, Gallandt, Zwickle, Wilson and Doohan2014) interviewed 23 organic farmers in New England (19 of whom grew primarily vegetables), and they reported crabgrass (Digitaria spp.) and G. quadriradiata as their most problematic weed species. In that analysis of seedbanks, Digitaria spp. and G. quadriradiata were more abundant (mean 2,456 and 840 seeds m−2, respectively) than P. oleracea and S. media (mean 284 and 239 seeds m−2, respectively). All of these species tend to set seed rapidly after emerging. For example, G. quadriradiata can produce viable seeds within 35 to 40 d of plant emergence (Kumar et al. Reference Kumar, Brainard and Bellinder2009; Warwick and Sweet Reference Warwick and Sweet1983).
Weeds in vegetable crops originate primarily from the soil weed seedbank, especially when periodic soil tillage prevents perennial weeds from becoming established. In their assessment of weed seedbanks on organic farms in New England, Jabbour et al. (Reference Jabbour, Gallandt, Zwickle, Wilson and Doohan2014) reported that total weed seedbank density ranged from 2,800 to 24,700 seeds m−2, illustrating a large range of weed management efficacy among organic farmers. This study also highlights the potential for successful organic weed management, because the range of values overlap with those observed in conventional production (Dessaint et al. Reference Dessaint, Chadoeuf and Barralis1997).
In general, organic farmers typically cluster into two groups in regard to their perspective on weed management. Jabbour et al. (Reference Jabbour, Gallandt, Zwickle, Wilson and Doohan2014) found lower weed seedbank densities on organic farms where farmers were concerned about the negative impact of weeds and had a long-term view of weed management. In contrast, seedbank densities were greater on farms where farmers were more concerned about the negative impact of cultivation practices on soil health and valued the benefits that weeds provide (e.g., reduce soil erosion, nectar provisioning for beneficial insects). Given the different approaches that organic farmers use to manage weeds in vegetable fields; the potential impact of weed management on soil health, labor, and profitability; and the effects of weather on weed management outcomes, long-term research is needed to identify successful strategies. The purpose of the research presented here was to evaluate the effects of four organic vegetable management systems that differed in crop rotation, tillage, cover crops, and weed management tactics on weed seedbanks during a 10-yr experiment.
Materials and Methods
Location, Soil, and Cropping Systems
The Cornell Vegetable Cropping Systems Experiment was conducted at the Cornell Organic Research Farm near Freeville, NY (42.522°N 76.329°W). The soil was a Howard gravelly loam (loamy-skeletal, mixed, active, mesic Glossic Hapludalfs), except that part of replication 4 was a Phelps gravelly silt loam (fine-loamy over sandy or sandy-skeletal, mixed, active, mesic Glossoboric Hapludalfs). Plots were 7.5 by 19.5 m and arranged in a split-plot replicated block design with four replications. The main plot factor was the four organic cropping systems, and the split-plot factor was two entry points into the 4-yr crop rotation.
Before 2002, the field used for the experiment was in a conventional corn (Zea mays L.)–alfalfa (Medicago sativa L.) rotation with applications of dairy manure during the corn years. Transition to organic certification began in 2002. In that summer, sorghum-sudangrass [Sorghum bicolor (L.) Moench × S. sudanense (Piper) Stapf] was grown as a cover crop and mowed in late summer. In 2003, red clover (Trifolium pratense L.) was sown with an oats (Avena sativa L.) nurse crop that was mowed before maturity. In 2004, the plots in entry point 1 (EP1) were planted with sweet corn to begin the experiment (Table 1). Plots in entry point 2 (EP2) were tilled fallow during the summer of 2004 and planted with rye (Secale cereale L.) plus hairy vetch (Vicia villosa Roth.) in the fall.
Table 1 Crop sequences of the Cornell Organic Vegetable Cropping Systems experiment.Footnote a
a Cover crop abbreviations: ARG, annual ryegrass [Lolium perenne L. ssp. multiflorum (Lam.) Husnot]; BB, bell bean (Vicia faba L.) (a small-seeded fava bean); BW, buckwheat (Fagopyrum esculentum Moench); CC, crimson clover (Trifolium incarnatum L.); FP, field pea (Pisum sativum L.); FT, forage turnip (Brassica rapa L.); HV, hairy vetch; JM, Japanese millet [Echinochloa esculenta (A. Braun) H. Scholz]; O, oat; R, rye; RC, red clover; S, spelt; SB, soybean [Glycine max (L.) Merr.]; WP, Austrian winter pea (Pisum sativum L.); YM, yellow mustard (Sinapis alba L.). Symbols: +, crops planted together; /, crops in sequence; +/, cover crop interseeded into cash crop and remaining after harvest of cash crop; X, crop tilled under due to poor establishment.
The systems were designed by a collaboration of scientists and farmers to represent well-managed but contrasting approaches to organic vegetable production. The four systems varied in their use of land, type of tillage, and nutrient inputs. After the initial year with sweet corn, the systems followed a rotation built around the sequence: cabbage (Brassica oleracea var. capitata L.), lettuce (Lactuca sativa L.), potato (Solanum tuberosum L.), and winter squash (Cucurbita maxima Duchesne), with additional crops added to the Intensive system and the cabbage and potato replaced with cover crops and tilled fallows in the Bio-extensive system (Table 1).
System 1 (Intensive) simulated farms with limited arable land and focused on maximizing income via multiple cropping when growing-season time permitted. Thus, snap peas (Pisum sativum var. macrocarpon L.) were grown before cabbage, and spinach (Spinacia oleracea L.) was grown after lettuce for a total of six crops in 4 yr. Because time was unavailable for legume cover crops, usually the only cover crop was winter rye or the plots were left bare. The system relied on composted livestock manure and bedding as a nutrient source. Moldboard plow, rotary tiller, chisel plow, and harrows were used for tillage. Weeds were controlled by cultivation and usually one, but occasionally two, hand hoeings.
System 2 (Intermediate) simulated a relatively land-limited farm, but attempted to obtain substantial nitrogen from legume cover crops. A single cash crop was grown each year. Tillage and weed management were similar to those of the Intensive system.
System 3 (Bio-extensive) was based on the approach to crop rotation and weed management developed by Eric and Anne Nordell (Nordell and Nordell Reference Nordell and Nordell2007). In this system, a cash crop was grown every other year. In the alternate years, cover crops and lightly tilled fallow periods were aimed at building soil organic matter and reducing the weed seedbank. Cover crops before the summer fallow were grains, typically rye plus spelt (Triticum spelta L.), because no crop followed to use the nitrogen from a legume. After the summer fallow, legumes were planted to provide nitrogen for the cash crop the next year. Shallow rotary tillage and plowing were used to reduce tillage intensity. In addition to tilled fallow periods for flushing weeds out of the seedbank, an attempt was made to prevent weed seed production by hand roguing weeds that escaped the usual cultivation and hoeing. The intent was to obtain nitrogen primarily from legume cover crops, but compost was often necessary when cover crops had to be incorporated early to avoid weed seed production.
System 4 (Ridge tillage) reduced the intensity of tillage and controlled wheel traffic with the intention of improving soil quality. One crop was grown each year, and weed management in the crop was similar to that of the Intermediate system. Cover crops paralleled those in the Intermediate system, except that winter grains and red clover were avoided, because they would have been too hard to kill with the reduced tillage regimen. So, for example, hairy vetch plus winter-killed oats was used in the Ridge-tillage system when hairy vetch plus rye was used in the Intermediate system (Table 1). After crop harvest, cover crops were drilled, and then ridges were built with a potato hiller. The cover crops were scraped into the valleys before the next cash crop was planted. When long periods occurred before or after a cash crop (e.g., before cabbage, after lettuce), an extra scraping and hilling was used to control weeds. Nitrogen supplied by legume cover crops was supplemented with compost. Ridge tillage is not a typical practice in vegetable production; unlike the other systems, which reflect practices of real farms, it was highly experimental.
The cropping systems differed in tillage methods, cover crops, cropping intensity, amount of compost applied, and weed management strategies (Tables 1 and 2). Pest management, crop varieties, and irrigation were held constant across systems. Additional details on practices are given in Jernigan et al. (Reference Jernigan, Caldwell, Cordeau, DiTommaso, Drinkwater, Mohler and Ryan2017).
Table 2 Total number of cash crops, cover crops, primary tillage events, secondary tillage events, cultivation events, and hours of hand weeding in each system by entry point combination over the life of the experiment (modified from Jernigan et al. Reference Jernigan, Caldwell, Cordeau, DiTommaso, Drinkwater, Mohler and Ryan2017).
a Includes the cover crop grown before the initial sweet corn crop, but does not include cover crops planted after the final crop in the second crop rotation. Mixed species cover crops are counted as one crop. Consequently, the count is of the number of times cover crops were grown, rather than the number of cover crop species grown.
b Primary tillage events include moldboard plowing, chisel plowing, rotary tillage, and potato harvesting.
c Secondary tillage events include disking, harrowing, ridge scraping, ridge hilling, and use of a field cultivator, but not use of a roller harrow, because it was only used as a firming tool with the tines raised.
d These postplanting cultivation events include tine weeding, interrow cultivation, and potato hilling.
e Hours of hand weeding is measured in hours per 0.04-ha plot.
Weed and Seedbank Assessment
Weeds were sampled by randomly placing one 0.5 m−2 quadrat in each quadrant of each plot a few days before crop harvest or, for winter squash, immediately after harvest. Weeds with stems greater than 5-cm long were counted by species, and aboveground biomass was collected, dried at 60 C for 3 d, and weighed. Weeds smaller than 5 cm at harvest were not counted, because they would not have had appreciable impact on the crop and would not have produced seeds before postharvest cleanup.
To assess the weed seedbank, twelve 6.9-cm-diameter, 17.5-cm-deep cores were bulked together from each plot in late March or early April as soon as the soil was sufficiently dry. Cores were taken in a double-zigzag pattern that excluded areas within 1.5 m of the plot edges and 2 m of the plot ends. The bulked samples of 12 cores were weighed, screened through 1.2-cm hardware cloth to remove rocks and break up clods, and mixed by repeatedly rolling the sample about on a sheet of heavy plastic. A subsample of approximately 2.5 kg was weighed out for elutriation. Subsamples were spread and dried at 40 C for 2 to 3 d and then refrigerated at 4 C until elutriated. Organic matter was separated from the soil using a hydraulic elutriator built by the authors but similar to that described by Gross and Renner (Reference Gross and Renner1989), except that increased water flow was used instead of injection of air. The organic matter was dried at 40 C and screened to remove coarse fragments and dust <0.5 mm. None of the species present in the field during the course of the experiment had seeds that would pass a 0.5-mm screen. Seeds were sorted from the remaining organic material by hand, and each was pressed with a finger to determine if it was intact (Anderson and Miller Reference Anderson and Miller1998; Dessaint et al. Reference Dessaint, Chadoeuf and Barralis1997; Mirsky et al. Reference Mirsky, Gallandt, Mortensen, Curran and Shumway2010). Seeds were sorted by species and counted. Counts per subsample were converted to density per square meter using the areas of the cores and the weights of the whole sample and subsample. Lack of funding precluded processing samples between 2010 (EP1) or 2009 (EP2) and the end of the second crop rotation.
Data Analysis
Weed biomass data were analyzed by ANOVA using SAS PROC GLM (SAS Institute, Cary NC). The data had a time dimension, but because the crop differed among years, a repeated-measures design was not appropriate. To solve this problem, in addition to factors for crop type, system, and entry point, a factor was added for whether the crop was in the first or second turn of the rotation. Because sweet corn was only grown once, it was left out of the analyses to avoid a highly imbalanced design. Because weed biomass was only sampled during years when crops were grown, the Bio-extensive system created a potentially highly unbalanced design. To avoid this problem, the analysis was run in two ways: first, with only the Intensive, Intermediate, and Ridge-tillage systems included (ANOVA 1); and second, with all systems, but only lettuce and winter squash, these being the crops grown in the Bio-extensive system (ANOVA 2). To obtain mean separations for system and entry point in a consistent manner, separate ANOVAs were run on each crop in the rotation sequence. To stabilize variance, biomass data were log transformed before analysis, and back-transformed means are reported.
The effectiveness of the four systems for decreasing total seedbank density was evaluated by analyzing the seed densities after the final winter squash crops of 2012 and 2013. Because plots differed substantially in their initial seedbank densities, plot density in the final sample was standardized by dividing the total density in that year by the total density in the initial 2005 sample. The resulting standardized values were subjected to ANOVA using SAS PROC GLM, with means for system and entry point separated by LSD. An additional analysis compared the average seed density over the 10 yr of the experiment, with yearly total seed density again standardized against the initial 2005 samples. This allowed evaluation of the overall effectiveness of the four cropping systems for weed management. Relative seedbank density for years for which data were missing were estimated by straight-line interpolation between years with data for that plot. The resulting standardized averages over years were analyzed as for the standardized final densities.
Three species, large crabgrass [Digitaria sanguinalis (L.) Scop.], P. oleracea, and G. quadriratdiata only became abundant in the seedbank near the end of the experiment. To compare systems in each year by entry point by species subset for these species, the seedbank density data set was analyzed using generalized linear models with a Poisson distribution, which is appropriate for counts of weed individuals. We used ANOVA with the ‘Car package’ (Fox and Weisberg Reference Fox and Weisberg2011) and Tukey’s pairwise multiple comparison tests with the ‘Agricolae packages’ (De Mendiburu Reference De Mendiburu2014) in R to determine significant differences between systems. The test was not applicable for one situation (G. quadriadiata, 2009, EP1), because the species was below the detection threshold in the seedbank in all systems.
Weed seedbank density was log10 transformed and then subjected to a principal coordinates analysis (PCoA) with Bray-Curtis distance metric implemented in the ‘Vegan’ package (Oksanen et al. Reference Oksanen, Blanchet, Kindt, Legendre, O’Hara, Simpson, Solymos, Stevens and Wagner2010) in R software (R Core Team 2015). Only the 28 species occurring in more than 2 of the 32 plots were included in the analysis. To make entry points more comparable, data collected from the same point in the crop rotation for the two entry points were included in each analysis rather than comparing entry points within a given year. In other words, we analyzed data by crop instead of by year. The significance of cropping system, entry point, and their interaction was tested with a permutation-based multivariate ANOVA (Anderson Reference Anderson2001) using the Adonis function of the ‘FactomineR’ package (Le et al. Reference Le, Josse and Husson2008).
Results and Discussion
The overall pattern of change in the aboveground and seedbank weed community in the experiment reflects a shift from species typical of a corn–alfalfa rotation for feeding dairy cows to species typical of high-diversity vegetable farms in the northeastern United States. In particular, annual species that require a long period for development and seed maturation, like C. album and Amaranthus spp. (mostly Powell amaranth [Amaranthus powellii S. Watson], with lower numbers of redroot pigweed [Amaranthus retroflexus L.] and smooth pigweed [Amaranthus hybridus L.]), declined greatly in abundance. In contrast, species that mature rapidly and can produce seeds in midsummer, like G. quadriradiata, P. oleracea, and D. sanguinalis and the facultative winter annual S. media, increased in abundance during the course of the experiment. The increase in these species is not surprising, because as noted in the “Introduction,” these species commonly occur in vegetable cropping systems. Changes in these abundant species were paralleled by shifts in less abundant species commonly found in the two types of cropping systems. These overall changes can be attributed to a shift from long-season corn and perennial alfalfa to a rotation that included shorter-season vegetables, especially lettuce and cabbage, which allowed midseason tillage (Table 3), and winter cover crops with a variety of preplanting tillage and incorporation times. A long-term vegetable experiment in England found similarly dramatic shifts in community composition of seedbanks following a shift from cereal grains to a vegetable crop rotation (Roberts and Stokes Reference Roberts and Stokes1965).
Table 3 Dates of field operations critical to weed management for major crops.Footnote a
a Planting, hoeing and harvest usually required several days, and operations were conducted in order from replicate 1 through replicate 4. Harvest dates indicate time of harvest data collection; removal of the remaining produce from the field usually took at least several days and generally delayed postharvest operations. Cultivation and postharvest management were typically done one system at a time due to different machinery requirements and planting times for postharvest cover crops. Postharvest indicates the date of the first postharvest tillage operation unless otherwise specified.
b Organic sweet corn is not usually hand hoed, so it was not hoed in this experiment.
c Cabbage was planted later in the Intensive system than in others to allow time for snap pea harvest.
d Lettuce heads were harvested as they reached marketable size.
e Winter squash in the Intensive system was planted on black plastic.
The validity of any study of seedbanks depends on the adequacy of the sampling program. The minimum sample size required to accurately indicate the density of a species in the soil depends on both the mean density of the species over the area sampled and the spatial variability in density (Dessaint et al. Reference Dessaint, Barralis, Beuret, Caixinhas, Post and Zanin1992). If density is low or spatial variability of density is high, then the sample must be larger. Most studies of sample adequacy have used small cores 2- to 5-cm in diameter and found that 60 to several hundred were needed to estimate the seedbank (Benoit et al. Reference Benoit, Kenkel and Cavers1989; Dessaint et al. Reference Dessaint, Barralis, Beuret, Caixinhas, Post and Zanin1992). However, collection of, say, 100 cores per plot in 32 plots each year would have been so prohibitively time-consuming as to interfere with other time-sensitive activities. With 12 cores spread systematically over each plot, we probably averaged across meso-scale variability created by weed patches, and the large diameter of the cores (7-cm diameter) would have averaged over fine-scale variation in seed aggregation caused, for example, by bits of inflorescence from the previous year or seed collections in earthworm burrows. With a sample area of 460 cm2 plot−1, our sample was substantially larger than previous investigators have considered adequate (Ball and Miller Reference Ball and Miller1989; Benoit et al.Reference Benoit, Kenkel and Cavers1989; Gross Reference Gross1990), but would have been inadequate to quantify the species studied by Champness (Reference Champness1949), which had high patchiness and only a few hundred seeds per square meter. The discussion in the following sections focuses on the most abundant species, and the sample is more than adequate for quantifying those and for quantifying the total seedbank. Forcella (Reference Forcella1984) and Gross (Reference Gross1990) determined that 200 cm2 and 436 to 449 cm2, respectively, were adequate to measure species diversity of a plot. Our samples substantially exceeded these values, and thus are adequate for study of the change in species composition of the seedbanks over time.
Aboveground Weed Biomass
Weed biomass varied significantly among systems, entry points, crops, and the first rotation crop of a given type versus the second rotation crop of that type (hereafter abbreviated crop#) (Table 4). Only system did not enter into interaction terms of the ANOVAs. Thus, weed biomass was usually lowest in the Bio-extensive system, highest in the Ridge-tillage system and intermediate in the Intensive and Intermediate systems. The relatively low weed biomass in the Bio-extensive system indicates that the focus on weed management in that system bore fruit. The relatively higher biomass in the Ridge-tillage system relative to the others was due to a combination of (1) weeds on the sides of ridges that were not killed during scraping but were too close to the row to be reached by subsequent interrow cultivation, (2) occasional poor performance of the cultivator in the double rate of residue in the interrow areas, and (3) reduced crop competition due to poorer early growth of some crops, possibly due to nitrogen deficiency, given that most of the legume biomass was in the interrow areas.
Table 4 Mean total aboveground weed biomass of all species arranged by crop, cropping system, and entry point.Footnote a

a Data for the minor crops of snap pea and spinach in the Intensive system are not included. Sampling was done just before (sweet corn, cabbage, lettuce, potato) or just after (winter squash) harvest. Weeds were not sampled in the Bio-extensive system in years when no cash crop was grown. Systems followed by the same lowercase letter did not differ at the P<0.05 level by LSD. Entry points followed by the same capital letter did not differ at the P<0.05 level. ANOVA 1 is the analysis for the Intensive, Intermediate, and Ridge-tillage systems for all crops except sweet corn. ANOVA 2 is the analysis for all systems for lettuce and winter squash, which were grown in all systems. See “Materials and Methods” for details.
b First rotation crop of a given type vs. second rotation crop of that type.
The interaction between crop, crop#, and entry point was highly significant for both ANOVAs of weed biomass. This significance indicates the high variability in weed biomass between entry points and crops, both within and between turns of the rotation. The most obvious variation was that weed biomass tended to be large in winter squash, small in lettuce and cabbage, and intermediate in potato. Weed biomass was particularly low in cabbage, because the large thick leaves of the cabbages covered the ground well soon after the final cultivation and hand hoeing, thereby blocking weed growth. With the exception of cabbage just noted, the longer the period of growth between planting and harvest (Table 3), the more weed biomass was present by harvest. This occurred because as the period the crop was in the ground increased, so did the time from last cultivation to harvest (Table 3), which was the time weeds had to grow larger. Once crops reached a certain size, they could not be cultivated without sustaining unacceptable damage, and the longer-season crops reached this critical size at a relatively earlier stage in their phenology. These differences among crops were generally reflected in similar differences in aboveground weed counts of major species (Supplementary Appendix 1).
Although crops differed substantially in weed biomass, these differences were affected by interactions with crop# and entry point. Thus, for example, weed biomass was greater in EP2 than in EP1 for lettuce during the first turn of the rotation, but did not differ between entry points for the following potato crop. The difference in biomass between entry points for lettuce can be attributed to more Amaranthus spp. (overall mean of 84 vs. 10 in EP2 and EP1; Supplementary Appendix 1). The abundant Amaranthus in EP2 lettuce was from seeds shed during a cultivation failure 2 yr before (see next section). However, lettuce did not provide sufficient time for maturation of Amaranthus spp., and following the advice of our farmer-advisors, large Amaranthus were hand rogued out of the potatoes in 2008 to prevent interference with the potato digger. Consequently, weed biomass did not differ between the two entry points in 2007 and 2008 potatoes (Table 4). Interactions between entry point and crop# also affected weed biomass. Thus, mean biomass in EP1 decreased from 29 g m−2 in the first turn of the rotation to 11 g m−2 in the second turn of the rotation from cabbage to winter squash, whereas in EP2, overall mean biomass increased from 30 g m−2 to 40 g m−2 (computed from Table 4). The source of these changes are related to shifts in seedbank density and community composition.
Changing Seedbank Density of the Most Abundant Species
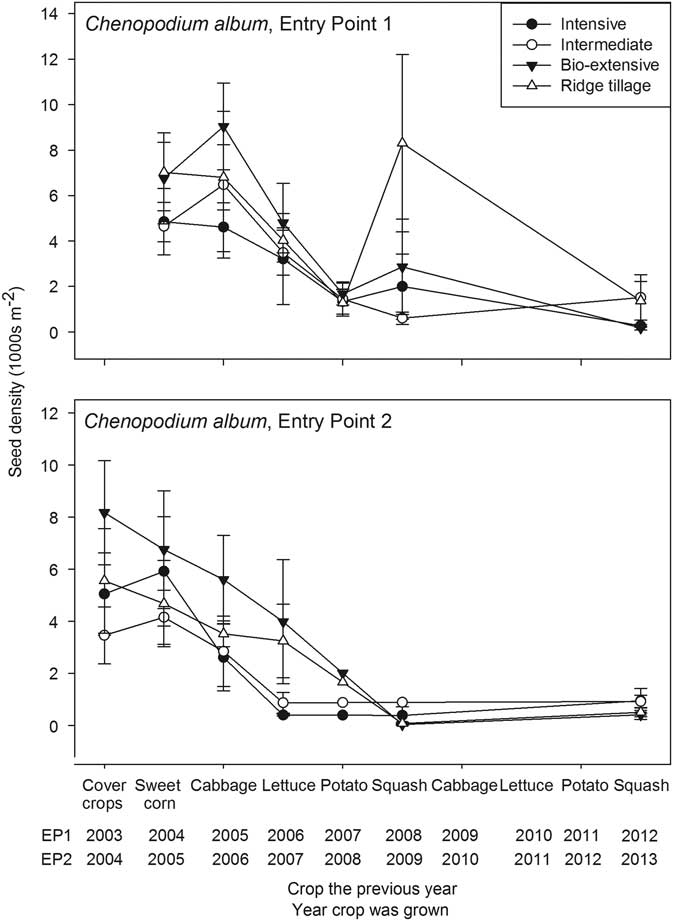
Over the 10-yr life of the experiment, the three most abundant taxa were C. album, Amaranthus spp., and S. media (Figures 1–3). Chenopodium album is frequently found in corn-based systems (Forcella et al. Reference Forcella, Wilson, Dekker, Kremer, Cardina, Anderson, Alm, Renner, Harvey, Clay and Buhler1997) and potentially has a highly persistent seedbank (Gardarin et al. Reference Gardarin, Dürr, Mannino, Busset and Colbach2010; Lutman et al. Reference Lutman, Cussans, Wright, Wilson, McN Wright and Lawson2002; Roberts and Feast Reference Roberts and Feast1972). Nevertheless, the C. album seedbank declined precipitously during the first few years of the experiment, and C. album was an insignificant part of the community by the end (Figure 1). The rapid decline in the seedbank density can be attributed to (1) frequent soil disturbance (Table 2) and (2) rotations that included crops whose phenology prevented seed production by this species. For example, the 2006 and 2007 lettuce crops averaged only 2.3 and 1.4 plants m−2 of C. album at harvest, all of which were killed before reproduction by postharvest tillage. As with many other species, seedbank density of C. album declines more rapidly with increasing frequency of soil disturbance. Annualized decline rates, which are computed from initial density and density several years later under the assumption that seed persistence in soil follows an exponential decline function (Roberts and Dawkins Reference Roberts and Dawkins1967; Roberts and Feast Reference Roberts and Feast1973), show loss rates from 8% to 35% from undisturbed soil (Chepil Reference Chepil1946; Conn et al. Reference Conn and Werdin-Pfisterer2010; Gardarin et al. Reference Gardarin, Dürr, Mannino, Busset and Colbach2010; Roberts and Feast Reference Roberts and Feast1972), with most values closer to the lower end of this range. However, when soil was tilled once per year, loss rates were 14% to 42% (Barralis et al. Reference Barralis, Chadoeuf and Lonchamp1988; Lutman et al. Reference Lutman, Cussans, Wright, Wilson, McN Wright and Lawson2002; Schweizer and Zimdahl Reference Schweizer and Zimdahl1984), with most rates closer to the higher end of the range; and when soil was stirred four or more times per year, loss rates were 31% to 52% per year (Popay et al. 1994; Roberts 1964; Roberts and Feast Reference Roberts and Feast1972). Soil disturbance associated with incorporation of cover crops, seedbed preparation, postplanting cultivation and hand hoeing for weed control, and tillage before planting winter cover crops apparently produced loss rates closer to the high end of the ranges computed from the literature.

Figure 1 Seedbank density of Chenopodium album (thousands per square meter to a depth of 17.5 cm) plotted against the crop grown in the previous year. Error bars are 1 standard error of the mean.
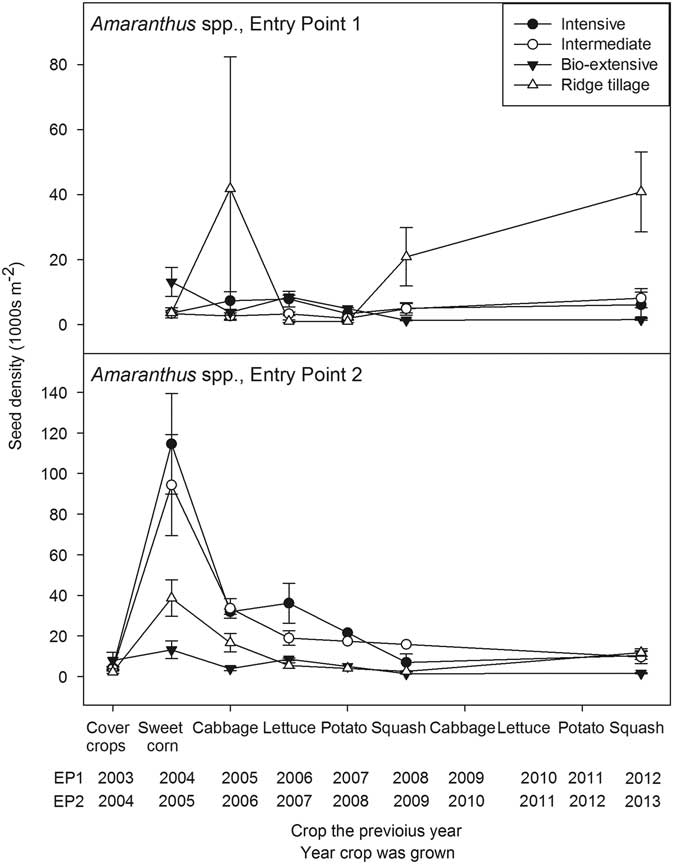
Figure 2 Seedbank density of Amaranthus spp. (thousands per square meter to a depth of 17.5 cm) plotted against the crop grown in the previous year. Error bars are 1 standard error of the mean.
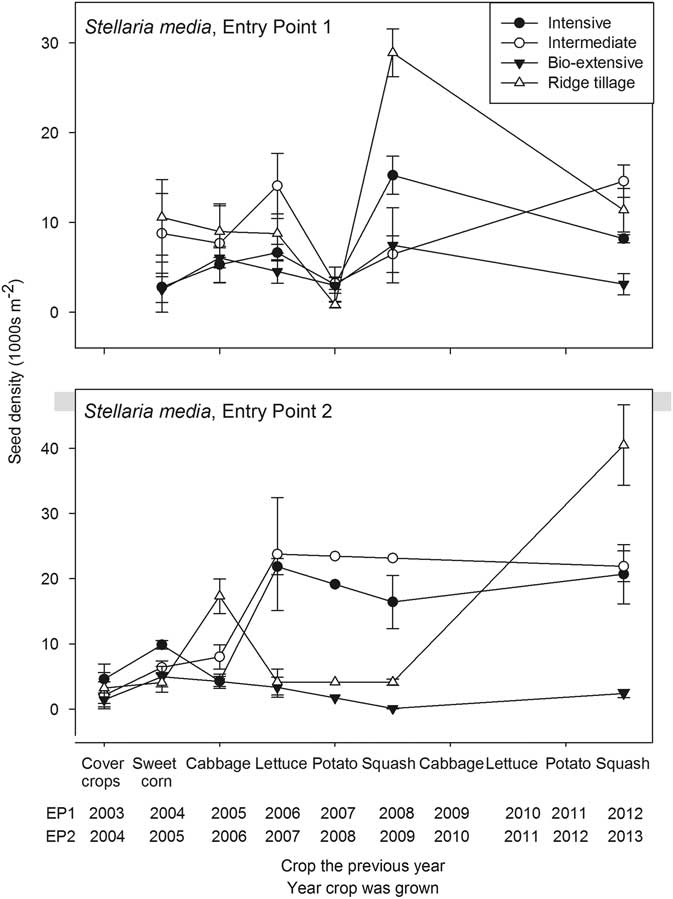
Figure 3 Seedbank density of Stellaria media (thousands per square meter to a depth of 17.5 cm) plotted against the crop grown in the previous year. Error bars are 1 standard error of the mean.
Only winter squash and sweet corn had sufficiently long growing seasons to allow maturation of large plants of C. album. Consequently, most systems in EP1 had an increase in seed density following the first squash crop. A similar moderate increase in seed density may have occurred following the final squash crops, but data are unavailable for the immediately previous years. Because the squash was not planted until the first week of June, many C. album seedlings had already emerged by the time of final bed preparation (Cordeau et al. Reference Cordeau, Smith, Gallandt, Brown, Salon, DiTommaso and Ryan2017b; Henry and Forcella Reference Henry and Forcella1993). This low emergence, coupled with cultivation and hand hoeing, led to a relatively low density of C. album at harvest (1.4 plants m−2 averaged over the whole experiment in both 2008 and 2009). Because all plants >5 cm were counted, some of these low-density plants were not mature, and the resulting low density of mature plants limited increase in the seedbank, particularly in EP2. The final cultivation occurred nearly a week earlier in EP1 than in EP2 (Table 3), except for the Intensive system. The earlier cultivation in EP1 allowed more time for weed growth and seed maturation, and this is reflected in the greater weed biomass in EP1 (Table 4). Although the Intensive system received final weed control at similar times in the two entry points, the winter squash was stunted and less competitive in EP1, because the preceding rye cover crop was allowed to grow large before incorporation, and it apparently tied up nitrogen needed for the squash.
A modest increase in C. album seed density also occurred in some systems following the first cabbage crop in EP1. Although the late planting date of the cabbage (mid-July) and mechanical control measures precluded the development of large plants, unlike the other major crops, cabbage was harvested too late to allow planting of a winter cover crop. Consequently, no tillage occurred after harvest, and some plants matured, thereby maintaining or increasing seed density. The difference between EP1 and EP2 (Figure 1) was that cultivation and hand weeding occurred later for EP2 than EP1 (Table 3), resulting in fewer C. album escapes in EP2 (overall mean of 0.5 plants m−2 in EP2 versus 5.8 plants m−2 in EP1; Supplementary Appendix 1), less time for seed maturation, and better crop competition from the cabbage, which was larger in EP2 at the time of the weed management operations. A lack of decline occurred in sweet corn in EP2 due to a cultivation failure, as explained in the discussion of Amaranthus spp. that follows. The overall decline of C. album despite some seed rain indicates that the seedbank can be effectively managed even for species whose seeds are potentially highly persistent in the soil.
The general pattern of decline found for C. album was paralleled by Amaranthus spp. (Figure 2), but with some interesting differences. First, and most notably, in 2005, during the experiment’s initial sweet corn crop in EP2, the corn was tine weeded but cultivated only once, except in the Ridge-tillage system. The necessary equipment for cultivating the other three systems was not available, and by the time a machine could be brought from another farm, the corn was too tall to allow passage by a tractor without breakage. Consequently, many large Amaranthus plants went to seed in the Intensive and Intermediate systems, and the seedbank reached very high densities. In the Bio-extensive system, we hoed and hand weeded the corn to prevent seed production in accord with the philosophy of the system. The density of the Amaranthus seedbank increased moderately even in the Bio-extensive system, probably due to seed rain from the dense infestations in adjacent plots. In the Ridge-tillage system, corn plants were smaller, allowing for a second standard and third hilling cultivation (Table 3). Escaped Amaranthus created a dense seedbank, but the seedbank was, nevertheless, lower than in the Intensive and Intermediate systems.
Following the extraordinary pulse of seed input, the seedbank declined precipitously the following year when cabbage was grown. The cabbage was planted in mid-July following incorporation of hairy vetch in the Ridge-tillage system, hairy vetch plus wheat in the Intermediate system, and fresh snap pea residue in the Intensive system (Table 2). The Bio-extensive system had a midsummer-tilled fallow that year. Tilled fallows are effective for reducing weed seed density in the soil (Mirsky et al. Reference Mirsky, Gallandt, Mortensen, Curran and Shumway2010; Roberts Reference Roberts1962) and, because Amaranthus species germinate well in warm, summer conditions (Costea et al. Reference Costea, Weaver and Tardif2004), additional Amaranthus seeds were likely eliminated during the tilled fallow period. In the other systems, seedlings emerging after cover crop incorporation in June were killed by bed preparation for planting the cabbage in July. The release of nitrogen from the legumes may have triggered substantial fatal germination of these nitrate-sensitive Amaranthus species (Mohler et al. Reference Mohler, Taylor, Hahn, DiTommaso and Bellinder2018), and the fresh residue would have promoted attack on seedlings by pathogenic fungi that the cabbage transplants were robust enough to resist (Mohler et al. Reference Mohler, Dykeman, Nelson and DiTommaso2012). The cabbage crop itself was cultivated, hand hoed, and then cultivated late (September 1, 2006). Although an average of 9 plants m−2 that were >5 cm were present at harvest (Supplementary Appendix 1), these were all small and few matured before being killed by frost. The same factors worked against Amaranthus establishment in EP1, but the EP1 crop received its final cultivation earlier (August 23, 2005) than the EP2 crop, and some of the 8 Amaranthus plants m−2 (Supplementary Appendix 1) apparently matured in all but the Bio-extensive system, which was in cover crops and tilled fallow. Consequently, the seedbank about doubled in the Intensive system and increased greatly in the Ridge-tillage cabbage (Figure 2). As discussed earlier, mechanical weed management and crop competition was often poorer in the Ridge-tillage system than in other systems. These factors led to high weed biomass in the Ridge-tillage system, particularly after the first squash crop (Table 4). One consequence was that Amaranthus seed density was high in later years in the Ridge-tillage system in EP1. However, seed density of Amaranthus spp. did not increase in later years of EP2, indicating the highly contingent interactions of weather, mechanical management, and crop competition on long-term weed management.
Unlike C. album and the Amaranthus spp., S. media was favored by the crop rotations used in the experiment. Whereas tillage in preparation for planting winter cover crops often interrupted development of late-maturing summer annuals, including Amaranthus and C. album, the winter cover crops favored growth and reproduction of S. media. Other fall-emerging, cold-tolerant species, including Persian speedwell (Veronica persica Poir.) and shepherd’s purse [Capsella bursa-pastoris (L.) Medik.], maintained populations throughout the experiment but did not increase like S. media (Supplementary Appendix 1). Unlike these other two species, S. media often grew during the summer in the shade of crops, which, for example, accounts for its increase in the seedbank following the first squash crop in EP1 (Figure 3). Moreover, S. media roots at the nodes to form clonal patches. Consequently, when tillage for planting winter cover crops was superficial, as in the Ridge-tillage system, parts of some plants were left exposed, regrew in the fall, and produced many seeds. Although seed densities of S. media were generally lower in the Bio-extensive system than in the others, the lower densities were only achieved through extreme measures, including additional hand hoeing and early incorporation of some cover crops (Table 1). The protocol for the Bio-extensive system included brief tilled fallow periods during the summer to reduce the seedbank, but management of S. media required addition of spring-tilled fallows, for example, before squash. Stellaria media posed a negligible competitive threat to the crops grown in this experiment, and a farmer who grew only these crops could largely ignore the species. The high S. media densities found in most systems through most of the experiment would, however, cause difficulty for crops like onion (Allium cepa L.) or early plantings of carrot (Daucus carota L.).
Species That Became Important in Later Years of the Experiment
Portulaca oleracea and D. sanguinalis were present in the experiment from the beginning (Figure 4), but occurred in only a few plots and at low abundance (Supplementary Appendix 1). Populations of these species increased slowly and consequently; they were not detected in the seedbank samples until 2009. Galinsoga quadriradiata did not appear in the aboveground samples until 2007 (Figure 4) and was not present in seedbank samples in 2008 and 2009 (Table 5). This species likely dispersed into the experiment from the adjacent conventionally managed experiment station vegetable farm, where it is abundant. Tractors and other machinery on the farm are washed between operations on different fields, and this practice probably slowed the arrival of G. quadriradiata and other weeds as well (Moerkerk Reference Moerkerk2006). Eventually, however, its arrival on vehicle tires and shoes was inevitable. By 2012, all three species had spread into most of the experiment plots (Figure 4), and the final seedbank samples showed that all three species had reached densities of thousands per square meter in at least some systems (Table 5). These species mature rapidly but continue to produce seeds until killed by frost or human agency (Baskin and Baskin Reference Baskin and Baskin1981; Ivany and Sweet Reference Ivany and Sweet1973; Miyanishi and Cavers Reference Miyanishi and Cavers1980; Peters and Dunn Reference Peters and Dunn1971). Consequently, they are common on many diversified vegetable farms in New York State (Baker and Mohler Reference Baker and Mohler2015), where they are able to reproduce even in short-season crops and then achieve high seedbank density when a longer-season crop enters the rotation.
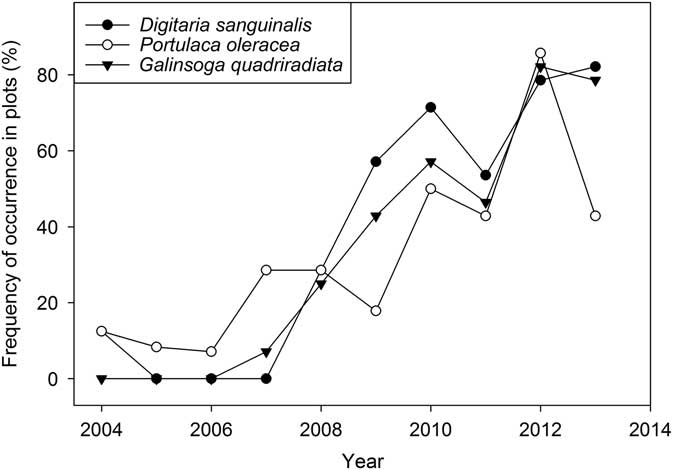
Figure 4 Spread of Digitaria sanguinalis, Portulaca oleracea, and Galinsoga quadriradiata during the course of the experiment (% of all plots that had at least 1 plant >5 cm of the indicated species in the four 0.5-m2 sample quadrats).
Table 5 Mean seed density (1 SE) and frequency of occurrenceFootnote a in the seedbank for three weed species that only became abundant near the end of the experiment (none of these species was recorded in the seedbank of either entry point in 2008).Footnote a
a The previous crop in all year by entry combinations was winter squash. ANOVAs using generalized linear models with Poisson distribution were significant at P <0.001 (see “Materials and Methods”). If ANOVA was significant, then Tukey’s pairwise tests were used to compare systems. For each species by year by entry point sub–data set, similar letters within a column indicate no significant differences between values (α=0.05).
b A few samples were partially lost during seed extraction and had to be excluded, leading to frequencies of 33% and 67% (i.e., occurrence in one or two of the three remaining samples).
Although D. sanguinalis, P. oleracea, and G. quadriradiata were all present in most plots of the experiment by the end, their density in the seedbank and aboveground samples was far from uniform. As would be expected, all three species had low seed density in the Bio-extensive system (Table 5). In contrast, D. sanguinalis averaged more than 16,000 seeds m−2 in the Ridge-tillage system, and both P. oleracea and G. quadriradiata also had several thousand seeds per square meter in the Ridge-tillage system of EP1. High seed densities in the Ridge-tillage system were probably due to poor crop competition and difficulties with mechanical weeding, as discussed earlier. Seedbank density of D. sanguinalis and P. oleracea in the Intensive system tended to be greater than in the Intermediate and Bio-extensive system. Although a high plant abundance of the three late, dominant species in the final squash crops probably contributed substantially to their high final density in the seedbank, the overall rise in abundance in the aboveground weed community (Supplementary Appendix 1) roughly paralleled their rise in frequency (Figure 4). The occurrence and abundance of G. quadriradiata was patchier than for the other two species. Note, for example, its high seedbank density in the Ridge-tillage system in EP1 but its apparent absence from the seedbank of that system in EP2 (Table 5). It was present in the aboveground samples in the EP2 Ridge-tillage plots, but at a much lower density than in EP1 (Supplementary Appendix 1). Galinsoga quadriradiata was first observed in the Ridge-tillage system of EP1 in 2009, but not in EP2 until 2011 (Supplementary Appendix 1). It was the only one of the three species to arrive from outside the experiment field, and its patchiness resulted from chance spread on shoes, tires, and machinery. Once it arrived in one plot of a system in an entry point, however, its spread to other plots in that entry point was probably facilitated by the use of cultivation equipment on successive plots of a system.
Comparison of Overall Seedbank Density between Systems and Entry Points
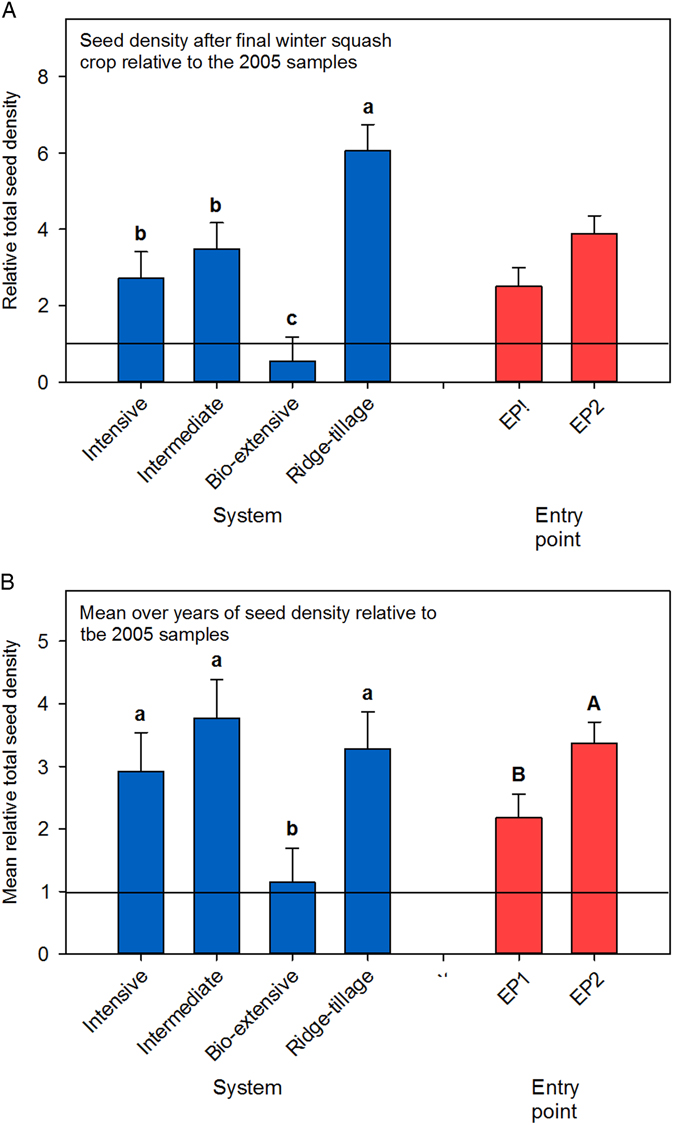
To compare the overall effectiveness of weed management in the four cropping systems, we compared the total seedbank density after the final winter squash crop and computed the mean total weed seed density over years. Because plots began with different initial seedbank densities (e.g., see Figure 1), values were standardized to the total seedbank density in the first samples collected in spring of 2005. The final standardized total seed density differed greatly among systems, with the Bio-extensive system having only about half the density of seeds it started with and seed density in the Ridge-tillage system increasing about 6-fold. The decline in seed density in the Bio-extensive system was expected, given the system’s focus on weed management, and the increase in the Ridge-tillage system was the result of difficulties with mechanical weed management discussed earlier. Seed density in the Intensive and Intermediate systems also increased. Conversion to organic farming practices often results in increased weed density (Graziani et al. Reference Graziani, Onofri and Pannacci2012; Rasmussen and Ascard Reference Rasmussen and Ascard1995), and that was the case for the Intensive, Intermediate, and Ridge-tillage systems. Although the 3- to 4-fold increase in the Intensive and Intermediate systems is undesirable, it does not represent a complete loss of weed control, particularly because a large portion of the increase can be attributed to S. media (Figure 3), which was not very competitive with the crops grown in the experiment.
Although understanding trends is critical, a grower would want to know the average weediness of a system as well. Seedbank density averaged over years differed among systems (P=0.04) and between entry points (P=0.04) (Figure 5). On average, over the 10 yr of the experiment, the seedbank density in the Intensive and Intermediate systems was about equal to the final density in those systems. In contrast, the Ridge-tillage system had a lower average seed density than its final seed density, indicating that weed control was relatively good at the beginning of the experiment but declined at the end. On average, seed density in the Bio-extensive system was about equal to the initial seedbank density. However, this was largely the result of averaging early years, when the seedbank was higher than in the initial samples, with later years, when it was lower (Figures 1–3). Only the Bio-extensive system had weed management as a primary goal, but developing procedures to implement the intention of not allowing seed rain in that system was challenging. In particular, seed production by facultative winter annuals like S. media and V. persica was difficult to prevent in winter cover crops (Teasdale Reference Teasdale1996). To manage this problem, we had to terminate cover crops earlier than in other systems (e.g., lettuce, 2006, EP1; Table 1) and include spring- and fall-tilled fallow periods to reduce the seedbank density of such species (e.g., winter squash, 2009, EP2; Table 1). As our procedures improved, seedbank density in the Bio-extensive system declined.

Figure 5 Seedbank density relative to 2005 samples. (A) Seed density after the final winter squash crops relative to the 2005 samples; (B) mean seed density over year relative to the 2005 samples. Data were standardized to the initial density (2005) for each plot. For B, seedbank densities for years without samples were estimated by straight-line interpolations between the nearest years with available data. Interpolations were not possible for later years for two plots that lacked data for the final sample year (Intensive, EP1, replicate 1; Intermediate, EP1, replicate 3), and these were not included in the data set. Least-square means are reported for both plots. Error bars are 1 SE. Values followed by the same letter do not differ (i.e., P>0.05). Entry points in A differed at P=0.06. System by entry point interactions were not significant for either analysis.
The overall difference in seedbank density between EP1 and EP2 was largely due to peculiarities of the interaction between crops, weather, and management practices. Although we tried to implement the same practices in successive years of the same crop, variation in weather between years affected the planting date and competitiveness of cover crops, emergence pattern of the weeds, and growth rate of crops, and hence the timing and number of cultivations. One of the largest contributors to the higher overall weed density in EP2 was the large Amaranthus seed rain in the sweet corn (Figure 2), but note also that S. media was higher in EP2 than in EP1 in the later years of the experiment in most systems (Figure 3). To some extent, the lower seedbank density in EP1 can be attributed to more hours of hand hoeing in EP1 in the Intensive, Intermediate, and Ridge-tillage systems (Table 2). However, hoeing was always aimed at removing all observable weeds from the uncultivated in-row zone, so this is probably not the whole explanation. Moreover, the number of postplanting cultivations was actually greater in EP2 than EP1 (Table 2).
Changes in Community Composition
Species composition of the seedbank at the beginning of the experiment varied substantially among plots. As would be expected, however, systems did not differ significantly in their composition at the beginning of the experiment (P=0.55; Figure 6A). Probably due to the weed control failure in sweet corn in EP2 in 2005, weed communities of the entry points had already begun to diverge (P<0.001; Figure 6A).
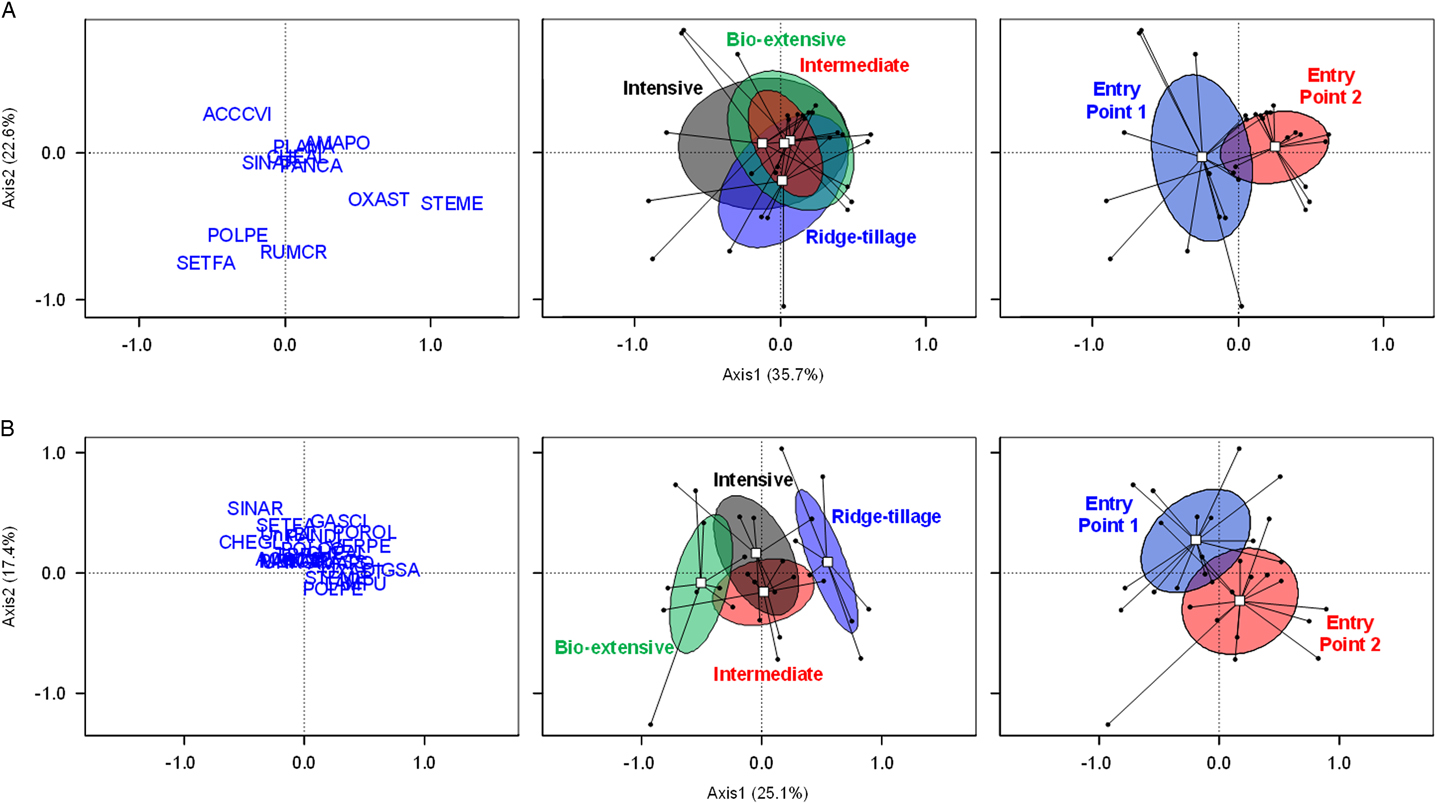
Figure 6 Weed seedbank communities following initial crop of sweet corn (A) and following the final crop of winter squash (B) as shown by principal coordinates analysis with Bray-Curtis distance. Left: position of species (named by Bayer codes) in the ordination space. Middle: position of systems in the ordination space. Right: position of entry points in the ordination space. Dots represent plots; white squares are the centroids of all plots belonging to the cropping system or entry point; ellipses show 95% confidence intervals. The significance of differences among cropping systems, entry points, and their interaction were estimated by permutation-based multivariate ANOVA: system (P=0.55 following the initial crop of sweet corn, P<0.001 following the final crop of winter squash); entry point (P<0.001, P<0.001, respectively); and their interaction (P=0.14, P=0.19, respectively). Bayer code abbreviations for species discernible in the ordination are: ACCVI, Virginia copperleaf (Acalypha virginica L.); AMAPO, Amaranthus powellii (with a few seeds of other Amaranthus spp.); CHEGL, Chenopodium glaucum; DIGSA, Digitaria sanguinalis; GASSCI, Galinsoga quadriradiata; OXAST, yellow woodsorrel (Oxalis stricta L.); PLAMA, broadleaf plantain (Plantago major L.); POLPE, ladysthumb (Persicaria maculosa Gray); POROL, Portulaca oleracea; RUMCR, curly dock (Rumex crispus L.); SETFA, giant foxtail (Setaria faberi Herrm.); SINAR, Sinapis arvensis; STEME, Stellaria media VERPE, Veronica persica.
By the end of the experiment, the species composition of the seedbanks differed between both systems (P<0.001) and entry points (P<0.001) (Figure 6B). At this late point in the experiment, the Bio-extensive and Ridge-tillage systems had developed compositions that were distinct from each other and from the Intensive and Intermediate systems. Oakleaf goosefoot (Chenopodium glaucum L.) and wild mustard (Sinapis arvensis L.) were associated with the Bio-extensive system (Figure 6B). These species were present but never abundant in the Bio-extensive system due to the zero seed rain policy practiced in that system. However, they were never abundant in any of the other systems either, though they were occasionally present at various locations in the field from the beginning of the experiment. Low density of the many other species in the Bio-extensive system made that system distinctive, but it also caused C. glaucum and S. arvensis, which are more or less constant across systems, to have a higher relative density in the Bio-extensive system. The Ridge-tillage system was associated with D. sanguinalis, P. oleracea, G. quadriradiata, and V. persica. Because tillage and cultivation were less effective for weed management in Ridge tillage, the first three species became especially abundant there (Table 5). The facultative winter annual V. persica proliferated in the Ridge-tillage system for the same reasons discussed earlier for S. media.
The divergence in entry points is not easily explained in terms of behavior of species. Galinsoga quadriradiata and P. oleracea have relatively high loadings on the second PCoA axis (Figure 6B), and they are more frequent and abundant in EP1 (Table 5). We attempted to duplicate practices in the two entry points as exactly as possible, but vagaries of weather, timing of operations, and their interaction with weed emergence (Cordeau et al. Reference Cordeau, Smith, Gallandt, Brown, Salon, DiTommaso and Ryan2017a) and growth put the entry points on divergent paths. In addition to a difference in composition, entry point 2 had consistently higher weed biomass (Table 4) and mean seedbank density (Figure 5). Once a difference exists, it can compound, as more biomass of a species leads to more seeds, which leads to greater abundance in the following year. Thus, the data expressed in Figure 6B demonstrate the important influence on weed communities of compounding historical effects into results that appear essentially random at some later point in time.
Implications for Weed Management in Organic Vegetable Production
The shift from a corn–alfalfa rotation to a rotation of vegetable and cover crops shifted the community from dominance by summer annuals like Amaranthus spp. and C. album, which set seed only near the end of their life spans, to a community dominated by the facultative winter annual S. media and summer annuals like D. sanguinalis, P. oleracea, and G. quadriradiata, all of which produce seeds early in their life spans and continue to produce seeds until killed by unfavorable weather or human agency. The vegetable crop rotation, which required tillage at various times during the growing season, interrupted the life cycle of species that delay reproduction while favoring species with early reproduction. The shift in community composition included the rapid decline of species like C. album that are known for the persistence of their seeds in the soil. Depletion of recalcitrant seedbanks in this experiment through a crop rotation that allows multiple, appropriately timed tillage, emphasizes the importance of crop rotation for weed management (Mohler Reference Mohler2009).
This experiment also demonstrated the effectiveness of tilled fallow combined with prevention of seed rain for the reduction of both aboveground weed biomass and seedbank density. Due to the small area of the plots, seed movement into the Bio-extensive system from adjacent plots could not be prevented, and we believe that the system would work better at a farm scale than it did in this experiment. Nevertheless, both the final seedbank density and the average seedbank density over the life of the experiment were substantially lower in the Bio-extensive system than in the others (Figure 5). Moreover, the overall trends in seedbank density, weed biomass, and aboveground weed density in this system were downward (Figures 1–3; Table 4; Supplementary Appendix 1). Although inclusion of years with tilled fallow and multiple cover crops in the rotation would not be practical on many farms, the success of weed management in the Bio-extensive system indicates the general usefulness of preventing seed rain and flushing seeds out of the soil with tilled fallows whenever practical. For example, seed rain can often be greatly reduced by prompt cleanup of fields after harvest. Moreover, because seed production increases exponentially with the size of the weed (Mohler and Callaway Reference Mohler and Callaway1995), rouging the largest weeds out of a crop can have a large impact on seed rain per hour invested. We recognize that tilled fallows can damage soil health and should be avoided on sloping land, where erosion is a potential problem. Other potential damage, such as loss of active organic matter, aggregation, and aggregate stability, can be limited by shallow tillage and compensated for by the frequent incorporation of cover crops (Mirsky et al. Reference Mirsky, Gallandt, Mortensen, Curran and Shumway2010). Cover crops can more than compensate for loss of soil productivity due to tilled fallows, as is demonstrated by the high per-crop productivity of the Bio-extensive system relative to the other systems in this experiment (Chan et al. Reference Chan, Caldwell, Rickard and Mohler2011). The maintenance of high productivity in the Bio-extensive system despite the tilled fallow occurred even though the amount of time in tilled fallow plus cash crops in that system was similar to the time in cash crops in the other systems. Part of the success of the Bio-extensive system was probably due to the shallow tillage, which kept cover crop residue on or close to the soil surface during the tilled fallows. Like other organic weed management tactics, tilled fallows need to be implemented intelligently as part of an integrated system. Tilled fallow periods with multiple cover crops are not practical on many farms due to limited land availability. However, in much of the northeastern United States and adjacent parts of Canada, many organic vegetable farms are limited by labor rather than land area. Because producing 10 ha of vegetables on 20 ha of tilled land is a lot easier than producing the same produce on 10 ha, many of the best organic farmers in the Northeast are adopting crop rotations that include tilled fallows and extended periods in cover crops (Johnson Reference Johnson2009). The experiment described here indicates some of the reasons this trend is likely to continue.
Author ORCIDs
Stephane Cordeau, http://orcid.org/0000-0003-1069-8388; Antonio DiTommaso, http://orcid.org/0000-0001-8215-2777.
Supplementary material
To view supplementary material for this article, please visit https://doi.org/10.1017/wsc.2018.52
Acknowledgments
We thank D. Glabau, M. Park, H. Spalholz, S. Hall, L. Zakrzewski, S. Mulkey, L. Mohler, S. Peever, T. Prado, V. Otero, D. Her, D. Demeree, S. Pietstruska, C. Dykeman, T. Paul, B. Karlovitz, K. C. Alvey, L. Moshman, J. Huang, C. Carlton, A. Saffer , L. Demander, K. Ellis, S. Orlowski, L. Woodruff, C. Jennison, E. Kennedy, J. Shen, K. Bitter, V. Wikel, and B. Binkerd-Dale for their assistance with weed sampling and the sorting and counting of elutriated seedbank samples. This work was supported by grants from the USDA Organic Research and Extension Initiative (project numbers 2004-51300-02230 and 2009-51300-05586); by a grant from the New York Farm Viability Institute (project number ARP 08 007); by funds from the Cornell Agricultural Experiment Station (Multi-State Hatch projects NE-1000, NE-1026, and NE-1047, project numbers 125450, 3120006036 NYC-145843 NE1026, and 231327 NYC-125800 NE1047, respectively); by the French ANR COSAC (ANR-14-CE18-0007); by the Burgundy Region in France (FABER project Couv’Herbi); and by the Higher Education Commission of Pakistan. No conflicts of interest have been declared.