
China's recent leadership transition has been accompanied by renewed and vigorous policy discussions. A central topic of discussion has been inequality. Gaps between socioeconomic groups – urban versus rural, coastal versus inland, those with privileged status and those without – are thought to have widened to unacceptable levels. Policy solutions have been proposed, some within the standard policy toolkit such as improvements in social welfare programmes, tax measures and labour market protections, and some more fundamental, including major structural and institutional changes and political reform.
Policy discussions about inequality in China have been hampered by incomplete and sometimes inconsistent information. Exactly how high is the level of inequality, and is it increasing or decreasing? Which groups have fared well or poorly? What factors underlie gaps in income? To what extent have government policies moderated or exacerbated inequality? Measurement of inequality is inherently difficult, and full answers to these questions remain elusive. Still, ongoing efforts by researchers have provided a growing body of relevant evidence. The aim of this article is to take stock of the available evidence on recent trends in household income inequality and poverty in China. Other dimensions of inequality such as in health, education and wealth are also important, but beyond the scope of this article. These other dimensions, however, are usually correlated with income.
Income inequality in China has evolved over time and has been shaped by past policies and patterns of growth. In the 1990s, major structural reforms in government finance, foreign trade and the urban enterprise sector facilitated rapid economic growth, but were accompanied by rising inequality. In the early 2000s, under the leadership of Hu Jintao 胡锦涛 and Wen Jiabao 温家宝, China adopted the “harmonious society” (hexie shehui 和谐社会) or “scientific outlook on development” (kexue fazhan guan 科学发展观) policy agenda, which emphasized sustainable and equitable growth. Under this new agenda, the central government implemented a range of measures to reduce disparities and protect the economically vulnerable, including agricultural support policies, social welfare transfer programmes, targeted tax reductions, minimum wage increases and increased spending on poverty alleviation. In general, the new measures reflected a shift towards universal programmes applicable to all eligible individuals and households.Footnote 1
The world financial crisis created new challenges. During the crisis, China actively pursued stabilization policies, including a major fiscal stimulus of 4 trillion yuan mainly for infrastructure investment, accompanied by monetary easing, tax cuts and other measures.Footnote 2 Social programmes were not a central component of the stabilization programme, but the planned expansion of pre-existing social programmes continued, and 3.8 per cent of the fiscal stimulus package was allocated for new spending on education and health.Footnote 3 Some other components of the stimulus programme, for example investments in rural roads and village infrastructure, also may have had beneficial effects by generating local employment to offset job losses from the macroeconomic downturn.
In early 2013, only months after the leadership transition installing Xi Jinping 习近平 as China's leader, the State Council issued a circular specifically on the topic of income distribution.Footnote 4 The circular acknowledged that income inequality was a problem and laid out 35 “points” for deepening the reform of China's system of income distribution, including tax reform, raising the minimum wage, protection of rural land rights, reform of the household registration or hukou 户口 system, increased control of state-owned enterprise (SOE) salaries and profits, and improvements in social welfare programmes. Many of these points were reiterated at the Third Plenum in the autumn of 2013, which laid out China's policy agenda for the coming years.Footnote 5
So as to provide a context for these recent developments, this article begins with a discussion of data and measurement issues. Most analysts agree that the standard estimates of inequality in China are understated, although disagreement exists over the extent of understatement. We then review the evidence on national, as well as rural and urban, inequality and poverty. The article then continues with a discussion of a selection of policies pursued during the Hu–Wen decade that had explicit distributional objectives: individual income tax, the elimination of agricultural taxes and fees, minimum wage policies, the relaxation of restrictions on rural–urban migration, the minimum living standard guarantee programme, the “open up the west” strategy (xibu dakaifa 西部大开发), and China's development-oriented rural poverty reduction programme. For each, we review available evidence regarding the policy's impact on income inequality or poverty. The State Council's 2013 circular on income distribution proposes use of the same, or similar, policy instruments.
A central conclusion is that income inequality in China increased substantially from the mid-1990s through to 2008. Although official estimates suggest that inequality stabilized and perhaps declined slightly from 2008 to 2012, the level of inequality remains moderately high by international standards. Examination of urban and rural household incomes reveals some factors that have contributed to inequality: specifically, the ongoing urban–rural income gap and growth in income from private assets and wealth. Rapid growth in rural incomes from migrant employment has moderated inequality.
Future trends in China's income distribution will depend on how different underlying equalizing and unequalizing factors play out. Distributional policies could play a role here. Our review of selected distributional policies suggests that not all policy approaches are equally effective in ameliorating inequality and poverty.
Data and Measurement
Tracking inequality and poverty is an empirical exercise that employs household-level survey data and requires decisions about measurement. Here, we discuss some key data and measurement issues relevant to the analysis of national inequality and poverty in China since the mid-1990s. Most studies of inequality and poverty in China draw on estimates and data from the National Bureau of Statistics (NBS), and consequently much of our discussion is about, or with reference to, the NBS data and estimates. We also discuss some alternative data and estimates, most importantly, those of the China Household Income Project (CHIP).
Estimation of national inequality and poverty requires a survey dataset that is nationally representative and with a broad enough coverage to capture substantial variation. Ideally, the dataset should be available for, and reasonably consistent over, multiple years so as to allow analysis of trends over time. For China, the survey datasets that come closest to satisfying these criteria are from the NBS. The NBS conducts annual nationwide urban and rural household surveys which collect extensive data on incomes and other household characteristics.Footnote 6 Based on these survey data, the NBS calculates and publishes aggregate descriptive statistics on urban and rural household incomes, as well as estimates of inequality and poverty. Most analyses of national inequality in China use or refer to these official statistics and estimates.
The underlying household survey data collected by the NBS are not publicly available. Some independent researchers have been given access to subsets of the data, but those subsets have in general been limited to one or a few provinces and years. An exception is the CHIP, a long-term collaborative research project that has collected nationwide household survey data suitable for analysis of incomes and inequality, with the object of addressing deficiencies in the NBS data and of providing household-level data for scholarly research. The CHIP has conducted four survey rounds collecting data for the years 1988, 1995, 2002 and 2007; another survey round is taking place in 2014.Footnote 7
Owing to the demands involved in such a large survey effort, as well as the constraints on international survey research in China, the CHIP surveys have been carried out in cooperation with the NBS and have piggybacked onto the NBS household surveys. The CHIP urban and rural survey samples are subsets of the NBS urban and rural household survey samples. The CHIP samples do not cover all provinces, and their provincial coverage has changed over time. Nevertheless, the CHIP samples are quite large, cover all of China's major regions and, with weights, are thought to be nationally representative. In early rounds, the CHIP survey data were collected separately from the NBS surveys through household interviews conducted using an independent survey instrument designed by the CHIP researchers. In recent rounds, the CHIP data have combined information collected by the NBS and provided to the CHIP with information collected through interviews using an independent survey instrument.Footnote 8
Weaknesses of the NBS household surveys have been discussed at some length in the literature.Footnote 9 Here, we mention two related to sampling. One is the underrepresentation of rural–urban migrants. Until recently, the sample frame of the NBS surveys has been based on China's household registration system, and rural–urban migrants do not have formal registration in the cities. To some extent, migrants have been covered by the NBS rural household surveys, which include migrants who maintain an economic connection with their households of origin. Nevertheless, coverage of migrants has been incomplete and is becoming increasingly so owing to the substantial growth in rural–urban migration over the past decade. Starting in 2013, the NBS adopted a new sampling frame based on the census rather than on household registrations; this sampling approach should provide better representation of migrants.Footnote 10
The incomes of migrants tend to be higher than the incomes of rural residents, but lower than the incomes of formal urban residents. Inadequate coverage of migrants therefore leads to the overstatement of rural–urban income differences and of national income inequality. The extent of the bias would depend on the size of the migrant population relative to the national population. In order to overcome this weakness in the NBS surveys, starting in 2002 the CHIP added a special survey of rural–urban migrants. The CHIP migrant survey data are collected from an independently constructed sample of migrants using a survey questionnaire designed to collect information that is comparable to that in the urban and rural household datasets. Estimates of the urban–rural income gap and of inequality incorporating the CHIP migrant survey data indicate that the bias is not overly large.Footnote 11
A second sampling-related weakness is the underrepresentation of the poorest and richest households.Footnote 12 Constructing a sample that adequately represents the poorest and richest groups is a challenge for any household survey; China's large population, geographic and socioeconomic diversity, and rapidly changing economy add to the challenge. With the expansion of wealth at the top tail of China's income distribution, and because wealthy households are less likely to participate in the surveys, underrepresentation of the richest groups has become a more serious problem in recent years. The CHIP surveys, as subsets of the NBS surveys, also suffer from this problem.
Estimation of inequality and poverty involves measurement choices. First is the choice of variable of interest. Household income per capita, despite certain limitations, is the most common choice in studies of China, and most studies use estimates of household income constructed by the NBS.Footnote 13 The NBS measure of urban income, which it refers to as “disposable income” (ke zhipei shouru 可支配收入), includes income from employment (wages, salaries and other subsidies and compensation), self-employment, assets and net transfers from public and private sources, minus taxes and fees. The NBS measure of rural income, which it refers to as “net income” (chun shouru 纯收入), includes income from employment, self-employment, assets, household business and production activities such as farming (including the monetary value of agricultural output retained by the household for its own consumption), minus production costs, taxes, fees and depreciation of productive assets. Net public and private transfers are also included.Footnote 14
Azizur Khan et al. point out several flaws in the NBS's income measures. One is the exclusion of imputed rent from owner-occupied housing.Footnote 15 This category of income is typically included in international studies so as to avoid inconsistent treatment of renters versus homeowners.Footnote 16 Another shortcoming is the understatement of consumption subsidies. This was more serious in the past when consumption subsidies were associated with the planned provision of low-priced consumer goods and subsidized rental housing, mostly to urban households. However, by the late 1990s, the planned allocation of consumer goods had been eliminated and the privatization of urban housing had greatly reduced rental housing subsidies.
In order to address these shortcomings, the CHIP researchers have calculated alternative estimates of income. For recent years (2002 and 2007), the CHIP studies use a measure of income equal to NBS income plus imputed rents on owner-occupied housing and implicit subsidies on subsidized urban rental housing.Footnote 17 As discussed more fully below, these differences in income measurement cause inequality as measured by the CHIP to be somewhat higher than that measured by the NBS, but trends in inequality over time are similar.
Neither NBS nor CHIP income fully includes the market value of social welfare and public spending programmes. Both count income received through transfer programmes such as unemployment insurance, the minimum living standard guarantee programme and grain production subsidies to farmers. Current pension income is also included. Not included are employers' contributions to pension and social insurance programmes for their employees, and subsidies implicit in public services such as education and transportation. The exclusion of these subsidies causes underestimation of nationwide income inequality, because lower-income rural and migrant households receive fewer benefits of this sort. However, estimation of their value is difficult and necessarily imprecise. Shi Li 李实 and Chuliang Luo's 罗楚亮 Reference Li, Luo and Whyte2010 study incorporates the implicit value of social welfare and public services, and concludes that if the value of these benefits were to be included in urban incomes, then in 2002 the urban–rural income gap would be 40 per cent greater, and national income inequality would increase by 11 per cent, yielding a Gini coefficient of 0.51.Footnote 18
Underreported income of high income groups in urban China, sometimes referred to as “grey” or “hidden” income, has been the topic of considerable discussion in recent years. Although not unique to China, the extent of such underreporting there has increased over time owing to the expansion of private businesses and privately owned assets, the rapid emergence of an ultra-rich segment of society, and growing corruption and illegal activity. Underreporting of grey income applies equally to the NBS and CHIP survey data. A few studies have attempted to estimate grey income and its impact on inequality in China, but they differ in methodology and provide substantially different estimates.Footnote 19
Several measurement issues arise with respect to prices. One is the treatment of non-marketed goods, and in particular, farm products produced for own consumption by rural households. This topic is discussed by Benjamin, Brandt and Giles,Footnote 20 who report that prior to 1997 the NBS valued retained farm products at average quota and above-quota state procurement prices, in 1997 at market prices, and after 1997 at 85 to 90 per cent of market prices, depending on the product (grain and meat at 90 per cent and other products at 85 per cent of the market price). In general, use of planned and below-market prices causes understatement of the farm component of rural incomes, and changing pricing conventions create inconsistencies over time. With the decline of the relative importance of farming as a source of income for rural households the impact of these pricing conventions on measured inequality will have lessened.
A second price issue arises owing to spatial differences. In China, prices vary geographically and in a way that is correlated with incomes: prices in higher-income, urban areas are higher than prices in lower-income, rural areas. Adjusting incomes for spatial price variation substantially reduces measured inequality and also the gap between urban and rural incomes. Spatial price adjustments, however, do not much alter inequality within urban and within rural areas, nor do they change the finding that inequality nationwide has increased over time.Footnote 21
Incomes and Inequality
In this section, we review the evidence on national trends in household incomes and income inequality since the mid-1990s. China is characterized by an urban–rural divide, with many differences between urban and rural areas in terms of incomes, institutions, policies and level of economic development. Nationwide patterns of income distribution reflect the different sources and patterns of income in the two sectors. We therefore also discuss the urban and rural sectors separately.
We use the Gini coefficient as our index of inequality. The Gini coefficient is common in analyses of inequality and has the advantage that it uses information for all households and is sensitive to income differences across the entire income distribution. The Gini coefficient ranges from zero, which represents perfect equality, to one, which represents perfect inequality. Estimates of the Gini coefficient for countries generally fall in the range of 0.20 to 0.70.
National income inequality in China
Figure 1 shows estimates of China's national Gini coefficient measured over household income per capita. The NBS Gini estimates are based on data from the annual NBS rural and urban household surveys, and income is measured using the NBS income definition. The CHIP estimates are calculated with data from the 2002 and 2007 CHIP surveys and incorporate migrants using information from the CHIP migrant sample; income is measured using the CHIP income definition.

Figure 1: Income Inequality in China as Measured by the Gini Coefficient, 1995–2012
The two sets of estimates are fairly consistent and indicate that inequality increased from about 0.40 in the mid-1990s to nearly 0.50 in 2007–08. After 2008, the NBS estimates show that inequality declined slightly, but remained above 0.47. With a Gini coefficient of 0.47, China's level of inequality ranks among the most unequal third of all countries. Inequality in China is in the same ballpark as that of relatively high-inequality Latin American countries such as Mexico and El Salvador (both 0.47), although lower than Brazil and Colombia (0.55 and 0.57, respectively).Footnote 22
The Gini estimates in Figure 1 are, of course, subject to the biases discussed above. However, these biases do not alter the basic conclusion that inequality in China has increased over time and is now at least moderately high. Bias owing to the under-coverage of the richest and poorest segments, problems with “grey” income and the exclusion of subsidies associated with social welfare and public service subsidies all imply that the level of inequality is higher and recent increases more rapid than is shown in Figure 1. Spatial price differences, however, cause a different direction of bias. Estimates of China's Gini coefficients adjusted for spatial price variation shown in Figure 1 are 12 to 15 per cent lower than unadjusted estimates, although still increasing over time.
Income growth of the poor versus the rich
What underlies the increase in national inequality in China, as shown in Figure 1? Analysis based on household-level data from the CHIP 2002 and 2007 surveys points to several factors. First, rising inequality was not the result of stagnant or declining incomes for poorer segments of the population, but of more rapid growth in the incomes of richer segments. Between 2002 and 2007, households poorer in income distribution experienced substantial income growth (Figure 2). During this five-year period, income of the poorest decile increased by nearly 50 per cent, and of the second-poorest decile by nearly 60 per cent, in real terms. As discussed later, this income growth for low-income groups contributed to reductions in absolute poverty.

Figure 2: Per Capita Household Income by Decile, 2002 and 2007
However, incomes of richer groups grew even faster. Between 2002 and 2007, income per capita of the richest deciles nearly doubled. As a consequence, both the relative and absolute income difference between poorer and richer segments widened, and national inequality increased.
The urban–rural income gap
A second factor underlying rising inequality in China is the gap between urban and rural incomes. Figure 3 shows estimates of the ratio of average urban income per capita to average rural income per capita. Calculated using official statistics from the NBS, the urban–rural income ratio increased from less than 3.0 in the late 1990s to a peak of more than 3.3 in 2007–2009; thereafter it declined slightly but remained above 3.0. An urban–rural income ratio exceeding 3.0 is very high by international standards.Footnote 23

Figure 3: China's Urban–Rural Income Ratio, 1995–2012
Also shown in Figure 3, the CHIP urban–rural income ratio is, in general, higher than that calculated using NBS income and shows a more marked increase between 2002 and 2007. The larger gap for CHIP estimates reflects the inclusion of imputed rents on owner-occupied housing, which are larger for urban than rural households and which increased fairly rapidly in urban areas after 2002.
Urban prices are higher than rural prices, so adjusting for spatial price differences reduces the urban–rural income ratio substantially, by about 30 per cent. Nevertheless, as with the unadjusted ratio, the price-adjusted ratio also increased. At 2.68 in 2007, the price-adjusted urban–rural income ratio was still high by international standards.
Using the CHIP data, an inequality decomposition analysis by Li, Luo and Sicular finds that the share of national income inequality contributed by the urban–rural income gap was 43 per cent in 2002 and 49 per cent in 2007.Footnote 24 Adjustment for spatial price differences reduces the size of this contribution, but the increase over time becomes more pronounced. With spatial price adjustments, the contribution of the urban–rural gap to national inequality was 27 per cent in 2002, and increased to 38 per cent in 2007.
What explains China's large and widening urban–rural income gap? These trends do not reflect stagnant rural incomes. As discussed more fully below, rural incomes have been growing quite rapidly, but not as rapidly as urban incomes. Part of the explanation is a gap in labour earnings, including those from wage and self-employment. This urban–rural gap in labour earnings reflects ongoing differences in educational opportunities between urban and rural areas, as well as higher returns to education for urban residents.Footnote 25
Labour earnings are not the whole story. The urban–rural income gap is also owing to differences in non-employment income such as pension income, government transfers and income from assets. By 2007, non-employment income accounted for 40 per cent of urban income but just 15 per cent of rural income. Much non-employment income is associated with government policies that have disproportionately benefited the registered urban population, for example the privatization of urban housing, pension programmes and various subsidies and social welfare programmes.Footnote 26
China's urban–rural income gap has a distinct regional dimension. The urban–rural income ratio is largest in west China (in 2007, adjusted for spatial price differences, 3.0, as compared to 2.3 in eastern regions and 2.5 in central China). Between 2002 and 2007, the price-adjusted ratio rose by a remarkable 42 per cent in the east, as compared to 21 per cent in the centre, while remaining unchanged in the west.Footnote 27 These regional differences merit further investigation.
Income from assets
Private property has emerged as a third source of income inequality. During the Maoist era, household ownership of property was extremely limited. Reforms allowing private ownership and supporting the development of asset and financial markets have transformed Chinese households into property owners. In this regard, the privatization of urban housing, which began in the 1990s and was basically completed by 2005, along with complementary policy measures fostering the development of urban real estate markets, has been significant. Housing is the single largest asset owned by households; holdings of other assets, including savings deposits and investments, financial assets and private businesses, have also increased substantially.Footnote 28
Our discussion is about inequality of income, not of wealth, but income derived from assets such as interest earnings, dividends, rents and capital gains that contributes to income inequality. Information in the NBS and CHIP surveys about asset income is unfortunately incomplete and in all likelihood underreported, but available data indicate that asset income has grown. Analysing the CHIP data, Sato, Sicular and Yue report that the share of asset income in total household income nearly doubled in the five years from 2002 through 2007, from about 8 per cent to 15 per cent.Footnote 29
In China and elsewhere, income from assets is distributed more unequally than other components of income. Consequently, increases in asset income have been associated with increased income inequality. Based on calculations using the CHIP data, we find that in 2002 asset income contributed 8 to 10 per cent of national income inequality; by 2007, it contributed 13 to 19 per cent. All signs suggest that the contribution of asset income to inequality will increase in the future.
Rural incomes and inequality
Changes in rural household incomes have played an important role in the evolution of national income inequality. In the late 1990s, concerns about lagging rural incomes were prompted by their slow growth. Following the change in leadership in 2002, there was a renewed emphasis on the rural sector. At this time, the government expanded rural policy initiatives, many under the banner of the “building a new socialist countryside” programme (shehuizhuyi xinnongcun jianshe 社会主义新农村建设). Rural initiatives included the elimination of agricultural taxes and fees, the provision of subsidies for agricultural production, public investment in rural infrastructure, the extension of the minimum living standard guarantee (dibao 低保) programme to rural areas, the formation of a new rural cooperative medical system, and the expansion of universal, free nine-year public education.Footnote 30 Also, restrictions on rural–urban mobility were eased, and steps were taken to improve the working and living conditions of rural migrants.Footnote 31
Rural income growth since 2000 has been robust. As shown in Figure 4, annual growth of rural household incomes rose from about 4 per cent in the late 1990s/early 2000s, to 9.5 per cent in 2007, slowed briefly during the world financial crisis, and then rebounded to an unprecedented 10 per cent in 2009–2012. In 2010–2012, growth in rural incomes outpaced that of urban incomes for the first time in several decades. Figure 4 is based on rural income statistics from NBS publications; estimates calculated using the CHIP data yield growth rates that are similar.Footnote 32

Figure 4: Annual Growth in Rural and Urban Household Incomes per Capita (Constant Prices, 1996–2012)
Analysis of changes in the composition of rural household incomes provides some clues about the factors that have contributed to this income growth. Table 1 shows a breakdown of rural income by source of income in 1995, 2002 and 2007. Slow growth in rural income between 1995 and 2002 was associated with stagnant income from farming, at that time the largest component of rural income. From 1995 to 2002, net income from farming grew by only 1.2 per cent per year. Income from other activities, such as wage employment, assets, imputed rents and non-agricultural household businesses, grew more rapidly so that, by 2002, agriculture contributed less than 40 per cent of rural household income. Wage earnings, still mainly from local employment within rural areas, contributed more than a third of rural household income.
Table 1: Composition and Growth of Rural Household Income per Capita, 1995, 2002 and 2007

Notes and sources:
Numbers in this table are calculated using the CHIP data and CHIP income definition. 2002 and 2007 are from Li, Luo and Sicular Reference Luo, Sicular, Li, Sato and Sicular2013, Table 5.2. For 1995, we use estimates from Khan and Riskin Reference Khan, Riskin, Gustafsson, Li and Sicular2008, Table 3.1, but with some adjustments to income from imputed rents. To make the 1995 estimates consistent with those for later years, we calculate 1995 imputed rent as equal to 2002 imputed rent reported by Li, Luo and Sicular Reference Luo, Sicular, Li, Sato and Sicular2013, divided by real growth in imputed rents between 1995 and 2002 from Khan and Riskin Reference Khan, Riskin, Gustafsson, Li and Sicular2008. This gives a lower estimate of imputed rent and thus also of income in 1995 than that given by Khan and Riskin Reference Khan, Riskin, Gustafsson, Li and Sicular2008. Income composition in 1995 and growth in total income between 1995 and 2002 are adjusted accordingly. Total income for 2002 is equal to that reported by Khan and Riskin Reference Khan, Riskin, Gustafsson, Li and Sicular2008, but replacing the amount of imputed rent with Li, Luo and Sicular's (Reference Luo, Sicular, Li, Sato and Sicular2013) estimate of imputed rent in 2002. Growth in total income from 1995 to 2002 is calculated using this adjusted value of 2002 income and adjusted 1995 total income.
Since 2000, the composition of rural household incomes has shown further change. Income from farming rebounded, growing 5.7 per cent per year from 2002 to 2007. This improvement in farm income was consistent with the pro-agriculture policies adopted at this time, as well as with higher farm prices and technical improvements in agriculture. However, the increases in farm income were outpaced by growth in income from other sources. Wage earnings rose rapidly, with a notable shift in structure from local to migrant wages. By 2007, wage earnings from migrant employment were nearly as large as those from local employment. Income from assets and imputed rents also grew rapidly, although from a small base. By 2007, asset income, including imputed rents, constituted 11.2 per cent of rural household income, up from 5.6 per cent in 1995.
Net transfer income, which includes public transfers such as dibao and wubao 五保 (five guarantees) support, net of taxes, as well as private transfers such as gifts and migrant remittances, also increased, a trend consistent with new rural social programmes and the removal of agricultural taxes and fees. However, on average net transfers remained a relatively small component of income. We note that some of the rural subsidy programmes adopted at this time operated indirectly by reducing household outlays on education, health and production, or by increasing net income from farming, rather than directly through an increase in transfer income.
Trends in rural income inequality from 1995 to 2011 as measured by the NBS are shown in Figure 5. The rural Gini increased from below 0.25 in the 1980s to above 0.30 in the mid-1990s. An important factor contributing to rising rural inequality at this time was the uneven development across regions and provinces of rural township and village enterprises.Footnote 33 Rural inequality dropped briefly in the mid-1990s, reflecting higher incomes owing to improved agricultural product prices, but the decline was short lived.Footnote 34 The Gini coefficient resumed its upward trend and reached 0.38 in 2005. Thereafter, it fluctuated between 0.37–0.39.Footnote 35 While this level of inequality is higher than that in earlier years, it is still relatively low.

Figure 5: Income Inequality in Rural and Urban China as Measured by the Gini Coefficient, 1995–2011
The levelling off of rural inequality since 2002 is in part explained by the rapid expansion of migrant employment, which has disproportionately benefited households from less developed regions. Growth in income from agriculture has also played a role.
Urban incomes and inequality
Figure 4 shows annual growth in urban incomes as reported in NBS sources. The NBS urban income data largely omit migrants; CHIP estimates that include long-term rural–urban migrants are similar.Footnote 36 In the late 1990s, growth in incomes of the urban population was relatively slow. At this time, China carried out a major restructuring of its urban state and collective enterprises, which was accompanied by widespread layoffs of urban workers.Footnote 37 Growth in urban incomes recovered after 2000, when, on average, it exceeded 9 per cent (Figure 4). Estimates of average annual income growth for urban households (not including rural–urban migrants) calculated using the CHIP data and CHIP income are slower for 1995–2002 (5.7 per cent ) and faster for 2002–2007 (11.3 per cent) than the NBS numbers (7.2 per cent and 9.8 per cent, respectively). Like the NBS estimates, the CHIP estimates show the acceleration in urban income growth.Footnote 38
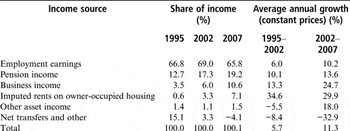
Growth in urban incomes after 2000 was the result of several factors, including the expansion of income from the private and informal sectors, rising wages in the formal sector, and higher pensions (Table 2). Wages, the largest source of urban household income, increased in part as the result of wage policies.Footnote 39 Employment earnings, which had grown relatively slowly in the late 1990s, grew 10 per cent a year from 2002 to 2007. Pension earnings also grew rapidly, reflecting government policies increasing the coverage and level of urban pensions.Footnote 40
Table 2: Composition and Growth of Urban Household Income per Capita, 1995, 2002 and 2007
Notes and sources:
Calculated using the CHIP data and CHIP income definition. 2002 and 2007 are from Deng and Gustafsson Reference Deng, Gustafsson, Li, Sato and Sicular2013, Table 7.4. For 1995, we use estimates from Khan and Riskin Reference Khan, Riskin, Gustafsson, Li and Sicular2008, Table 3.4, but with adjustments because these two sources use different methodologies to estimate imputed rents from owner-occupied housing, as explained in the note to Table 1.
Net transfers and other income declined, owing in part to the reduction in subsidies on rental housing that accompanied the urban housing reforms. As a share of urban household income, rental subsidies had contributed 10.6 per cent in 1995, declining to 2.9 per cent in 2002 and only 0.6 per cent in 2007. An increase in individual income tax payments, which are counted as negative transfers, also contributed to the decline.Footnote 41
Income from investments and property, such as business income, imputed rents on owner-occupied housing and other asset income, grew rapidly. These components of income together constituted 5 per cent of urban household income in 1995 and 19 per cent in 2007. In all likelihood, actual growth in these income components is higher than that shown in Table 2.
Income inequality in urban China has historically been low but has increased over time, as evident in the official estimates of urban income inequality shown in Figure 5. Rising urban inequality is partly due to growth in unequally distributed business and property income. It also reflects the widening dispersion of wage earnings. This is associated with the restructuring of the urban enterprise sector and with labour market and wage reforms that have allowed greater differentiation in pay based on skills and education.Footnote 42 Some observers have argued that urban inequality has been influenced by the earnings differentials between workers in the state and non-state sectors that reflect the unequal distribution of monopoly rents earned in the state sector.Footnote 43
According to the official estimates, after 2005 the urban Gini coefficient stabilized at about 0.34, which is still low by international standards, and declined slightly in 2010–11. In the absence of micro data for more recent years, the reasons for this levelling off and decline are not well understood. Contributing factors may include increases in urban pensions and minimum wage floors, the expansion of social insurance programmes and a narrowing of earnings differentials related to a rapid expansion in the supply of workers with post-secondary education, as well as the impact of the financial crisis. Understatement of income from assets and of the ultra-rich could also play a role.
CHIP researchers have published estimates of urban Gini coefficients that adjust for some of the deficiencies of the official estimates. The inclusion of imputed rents on owner-occupied housing increases estimated urban inequality.Footnote 44 Adjustments for spatial price differences among cities and incorporating rural–urban migrants both reduce estimated inequality. Li, Luo and Sicular, and Quheng Deng 邓曲恒 and Björn Gustafsson report that adjusting for spatial price differences among cities lowers the urban Gini coefficient by 5 to 10 per cent.Footnote 45 Li, Luo and Sicular find that incorporating long-term migrants reduces the urban Gini coefficient by another 7 to 8 per cent. The equalizing impact of including long-term migrants seems counterintuitive, but inequality among migrants is relatively low, and long-term migrants tend to be those that have been more successful in seeking employment in the cities.
Some studies have attempted to correct estimates of urban inequality to allow for the understatement of income of the ultra-rich. Using information for 2011 from an independent survey of households, Xiaolu Wang 王晓鲁 estimates underreported “hidden” income and concludes that the official urban Gini coefficient is biased downward by about 50 per cent.Footnote 46 Shi Li and Chuliang Luo's 2011 article discusses flaws in the Wang study and provides an alternative estimate.Footnote 47 After correcting for sampling bias in the 2007 NBS urban household survey, these authors conclude that the official urban Gini coefficient understates urban inequality by 20 per cent.
Poverty
The literature contains a variety of approaches to measuring poverty – some using poverty measures based on consumption instead of income, some using alternative poverty measures such as the poverty gap, and some using a relative poverty line instead of an absolute poverty line.Footnote 48 Here, we present estimates of income poverty in China measured using household income per capita relative to an income poverty line.
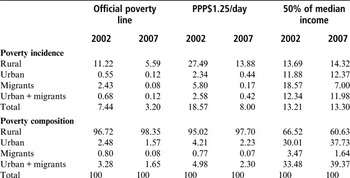
All studies of absolute poverty in China agree that, since the early 1980s, China has achieved substantial and ongoing poverty reduction. This can be seen in Figure 6. Official poverty data are only published for rural China, which has been the focus of much of China's poverty alleviation efforts.Footnote 49 Independent studies provide alternative estimates of rural poverty as well as of urban and national poverty.Footnote 50 Table 3 shows estimates based on the CHIP data for the years 2002 and 2007. CHIP estimates based on the US$1.25 per day international purchasing power parity (PPP) poverty line show a decline in the national poverty rate from 19 per cent in 2002 to 8 per cent in 2007.

Table 3: CHIP Estimates of Poverty Incidence and Composition, 2002 and 2007 (%)

Note:
The official poverty line used in this table is the 2008 official poverty line of 1,196 yuan, adjusted for 2002 and 2007 using the official rural and urban consumer price indexes. For urban areas, the absolute poverty line is equal to the rural poverty line adjusted by the urban–rural cost of living differential. The relative poverty line for rural areas is set at 50% of national average rural household income per capita, and for urban areas at 50% of national average urban household income per capita.
Source:
Li, Luo and Sicular Reference Luo, Sicular, Li, Sato and Sicular2013.
The choice of poverty line makes a noticeable difference in the estimated level of poverty. The official Chinese poverty lines for rural households have been adjusted three times. In 1985, the government set the rural poverty line at 200 yuan per person per year and updated it annually using the rural consumer price index (CPI). By the late 1990s, the share of the population with income below this poverty line had fallen below 5 per cent. In 2000, the government introduced a “low income line” of 865 yuan per year per person as an alternative cut-off. This line was also adjusted annually by the rural CPI, and in 2008 it replaced the old official poverty line for calculation of official estimates of rural poverty. In 2011, the government again raised the official rural poverty line, this time to 2,300 yuan (in 2010 constant prices).Footnote 51 This new poverty line, which was 92 per cent higher than the previous line, was used to calculate the official estimates of rural poverty in 2010, and in ensuing years has been adjusted annually using the rural CPI. Based on this poverty line, in 2011 the number of poor in rural China was 122 million, equivalent to 12.7 per cent of the rural population.
A large proportion of the low-income population in China is close to the poverty line, as revealed by the sensitivity of measured poverty to changes in the poverty line. When the government adopted the new, higher poverty line in 2011, for example, the poverty rate for 2010 increased from less than 5 per cent to nearly 15 per cent. Some studies have also noted the growing importance of short-term poverty among low-income households close to the poverty line, although estimates of the shares of chronic versus transient poverty differ.Footnote 52
After several decades of rapid economic growth, China is considered an upper middle-income country. With development and higher average income levels, the poverty dialogue usually shifts to concerns about relative poverty. A few studies have reported estimates of relative poverty in China. Using 50 per cent of median income as the poverty threshold, Li, Luo and Sicular estimate relative poverty incidence to be about 13 per cent nationwide in 2002 and 2007 (see Table 3). Alternative estimates using 30 per cent of median income as the poverty threshold similarly show no decline between 2002 and 2007. These findings indicate that China has so far had little success in reducing relative poverty.
Redistributive Policies: A Preliminary Assessment
This section reviews a selection of key policy measures from the Hu–Wen decade that had clear redistributive goals. These measures included reforms in personal income taxation, the abolition of the agricultural tax, minimum wage policies, the dibao programme, fiscal transfers to promote regional development, and poverty alleviation programmes. Of course, income distribution was also influenced by overall patterns of macroeconomic growth and by other policy measures, some of which, while not redistributive in aim, had distributional consequences. Notable in this regard, but beyond the scope of this review, were foreign trade and investment reforms associated with China's accession to the World Trade Organization, education reforms such as the implementation of free compulsory nine-year education, expansion of health and pension insurance programmes, general agricultural support programmes and stimulus measures during the world financial crisis.
The individual income tax
The government began to levy an individual income tax in 1981, and in 1986 the State Council issued provisional income tax regulations which marked the formal implementation of an individual income tax policy. Then and now, the tax applies only in urban China, is levied on individual rather than household income, and is progressive, with tax rates ranging from 5 per cent to 45 per cent. When first implemented, the monthly tax exemption, that is, the income threshold beyond which an individual pays income tax, was 800 yuan, considerably higher than the then average monthly urban wage of 110 yuan. Consequently, the proportion of income earners above the threshold was small.Footnote 53 Therefore, at that time, the individual income tax had little effect on the distribution of income, although it was expected that this would change over time with growth in urban incomes.
Urban household earnings have indeed increased since that time, as have the number of taxpayers and tax collections. By 2010, total revenues from the individual income tax had reached 484 billion yuan, implying an average annual growth rate of 23 per cent in real terms (adjusted by the urban CPI) from 1999–2010, outpacing real growth in urban household incomes during that decade.
Studies of the individual income tax rate have found that, although its structure is progressive and tax revenues have grown substantially, its impact on urban inequality is negligible.Footnote 54 There are several reasons for this. First, the individual income tax is a tax on individuals rather than an integrated tax on household income. Consequently, the amount of income tax paid by a wage earner is not affected by the number of dependents he or she supports, and typically the number of dependents is higher for low-income households. Second, tax administration and collection is inefficient, and high-income groups have found ways to avoid paying the tax. Third, increases in the exemption threshold have reduced the number of eligible taxpayers and, indeed, the overwhelming majority of income earners still remain below the threshold. In 2005, the monthly threshold was raised from 800 yuan to 1,600 yuan, in 2007 to 2,000 yuan, and in 2011 to 3,500 yuan. In 2011, the Ministry of Finance estimated that, after the threshold was raised to 3,500 yuan, less than 10 per cent of urban income earners would pay income tax.Footnote 55
Jianwei Xu 徐建炜, Guangrong Ma 马光荣 and Shi Li examine the impact of the individual income tax on inequality by comparing estimates of the Gini coefficient for pre- and post-tax incomes.Footnote 56 The estimates use NBS urban household survey data for the period of 1994–2009. The results, shown in Table 4, reveal that the redistributive effect of the individual income tax has been modest. In most years, the post-tax Gini coefficients have been only 2 to 3 per cent lower than the pre-tax Gini coefficients. The distributional impact appears to have gradually increased between 2002 and 2009, the last year for which their estimates are available. A more recent study by Ximing Yue 岳希明, Jing Xu 徐静 and Qian Liu 刘谦 indicates that the 2011 reform of the personal income tax reversed this trend. According to their estimates, in 2009 personal income taxes reduced the urban Gini coefficient by 3.8 per cent; under the 2011 tax scheme, however, the reduction in the urban Gini coefficient would have been only 1.9 per cent.Footnote 57
Table 4: The Distributional Effect of the Individual Income Tax in Urban China

Source:
Xu, Jianwei, Ma and Li Reference Xu, Ma and Li2013.
Abolition of agricultural taxes and fees
Prior to 1978, China's rural sector was subject to a variety of taxes. Taxes paid by collective farms, and thus by the rural population, included the agricultural tax, special agricultural product tax, slaughter tax and deed tax. These taxes continued into the reform era after decollectivization. In addition, over time local governments levied additional taxes and fees on farmers. A root cause of the additional local taxes and fees was the fiscal relationship between the central and local governments. The central government issued repeated orders and regulations to curb the collection of taxes and fees by local governments, but the problem persisted.
By the 1990s, Chinese farmers were saddled with high levels of taxes and fees. At this time, a research group from the Development Research Centre of the State Council investigated the burden of rural taxes and fees in three rural counties and found that, in 1997, the tax rate (including fees) for farmers in these counties averaged 12 per cent, with the tax rate in one county as high as 28 per cent.Footnote 58 In the late 1990s, the central government took steps to address the problem. In 2006, the central government announced the decision to abolish the agricultural tax and prohibit the collection of fees by local governments, which effectively eliminated the tax burden on rural households.
Table 5 shows the changes in the burden of taxes (including fees) on rural households from 1988 to 2007, as reported by households in the CHIP rural surveys. The average tax rate in 1988 was 5 per cent, and 5.3 per cent in 1995. Between 1988 and 1995, moreover, the distribution of the tax burden became increasingly regressive, as reflected in Table 5 in rising tax rates for the poorest deciles and declining tax rates for the richest deciles of the income distribution. In 1988, the tax rate of the poorest decile group was nearly double that of the highest decile; in 1995, it was roughly four times that of the highest income group. After a pilot reform of agricultural taxation was launched in 2000, the tax burden in some places began to decline, and by 2002 the average tax rate had dropped to 2.8 per cent. Nevertheless, the tax remained regressive. Only in 2007, after the agricultural tax was abolished nationwide, did the average tax burden on farmers drop to 0.3 per cent.
Table 5: Average Tax Rate (Including Fees) Paid by Households in Different Income per Capita Groups in Rural China

Source:
Authors' calculations based on 1988, 1995, 2002 and 2007 CHIP data.
The patterns in Table 5 suggest that the abolition of agricultural taxes and fees should have had positive distributional effects, and indeed, Luo and Sicular find a positive impact on poverty.Footnote 59 Before the abolition of rural taxation, the average amount of taxes and fees paid by the poor was equivalent to a significant share of the average poverty gap, that is, the difference between the poverty line and the average income of poor households. In 2002, for example, taxes and fees paid by households below the official poverty line were equivalent to nearly one quarter of the average poverty gap. By 2007, taxes and fees paid by the poor had been substantially reduced and were equivalent to only 1 per cent of the average poverty gap.Footnote 60
Nonetheless, the overall impact on rural inequality was small. As shown in Table 6, in the years before the elimination of rural taxes, the Gini coefficients for post-tax income are higher than those for pre-tax income, i.e. rural taxes increased the level of inequality. The differences, however, are not large. In 1995, the year with the largest difference, the post-tax Gini coefficient was only 2.7 per cent larger than the pre-tax Gini coefficient. These estimates imply that the potential for reducing rural inequality through the elimination of rural taxes and fees was modest.
Table 6: The Distributional Effect of Agricultural Taxes and Fees within Rural China, 1988–2007

Notes and sources:
Inequality is measured over rural household per capita income. The 1988, 1995 and 2002 estimates are from Sato, Li and Yue Reference Sato, Li and Ximing2006 using CHIP data for those years, and the 2007 estimates are calculated by the authors using CHIP data for 2007.
With respect to national inequality, rural taxation reform may have had some impact through its effect on the urban–rural income gap. In 1995, the ratio of urban to rural income per capita was 2.47. At that time, rural taxes and fees reduced net rural incomes by 5.3 per cent. If those taxes and fees were included in rural incomes, the urban–rural income gap would be reduced to 2.34.Footnote 61
Minimum wage policies
Minimum wage regulations were first introduced in urban China in the late 1990s, but they have only become an active policy tool in recent years. In 2004, the central government issued a formal minimum wage regulation that required provincial governments to set and implement minimum wage standards for their cities. In practice, provincial governments specify a range for minimum wages, and city governments choose the local minimum wage from within this range. Minimum wage standards therefore vary among provinces and among cities within provinces. The variation is fairly substantial. For example, in 2011 the minimum wage in Shanghai was 1,120 yuan per month, and in Kaifeng 开封, Henan, it was 600 yuan.
Distributional objectives are a stated motivation for minimum wage policies, but little empirical evidence exists on the impact of the minimum wage regulations on inequality. Research has identified some problems with the implementation of the regulations that would suggest that the distributional impact has been limited. For example, there is a problem of incomplete coverage and enforcement, especially in the informal sector which employs a disproportionate share of low-income workers, many of whom are migrants.Footnote 62 Another issue is that the minimum wage is low relative to the level of urban wages. As shown in Figure 7, since the early 1990s, relative to the average urban wage, the average minimum wage has declined continuously. In recent years, the average minimum wage has been well below 30 per cent of the average urban wage. Therefore, even with stricter enforcement in recent years, the minimum wage regulations have likely played a limited role in reducing wage inequality.

Figure 7: The Minimum Wage as a Proportion of the Average Wage
A third problem is that the enforcement of minimum wage regulations may have caused job losses for low-wage workers. Although evidence on this point is mixed, recent research by Tony Fang and Carl Lin finds a negative relationship between increases in the minimum wage and employment of urban workers at the bottom end of wage distribution, especially for those with low skills and who are female.Footnote 63
Easing of restrictions on migration
In the decades prior to China's economic reforms, rural–urban migration was minimal. During the late 1990s and especially since 2000, migration has increased markedly, reflecting policy reforms that have loosened household registration (hukou) regulations, supported rural–urban migration and improved employment and living conditions for migrants. Estimates of the number of migrants vary, but all show evidence of substantial increase. According to Laiyun Sheng's 盛来运 estimates based on the number of migrant workers who are registered members of rural households, in 2006 the number of rural–urban migrants reached about 130 million, which is equivalent to 26 per cent of the rural labour force. This is up from about 50 million in 1999, which is equivalent to less than 15 per cent of the rural labour force at that time.Footnote 64
The growth in rural–urban migration has influenced the level and composition of rural incomes. Luo and Sicular, using the CHIP rural survey data, report that in 2002, 36 per cent of the rural population lived in households that participated in migrant employment; in 2007, this share had risen to 48 per cent (see Table 7).Footnote 65 Between these years, wage earnings from migrant work rose from 11 per cent of rural household income to 18 per cent. As these income shares do not include remittances and income from household self-employment or businesses earned in other locations, and as they do not include indirect impacts of migration on incomes, they understate the importance of migrant earnings.Footnote 66
Table 7: The Relationship between Migration and Rural Poverty

Note:
Migration is identified by whether the household reports wage earnings from migrant employment. Poverty is calculated using the PPP$1.25 per-day poverty line.
Source:
Luo and Sicular Reference Luo, Sicular, Li, Sato and Sicular2013.
In principle, one would expect that migration, by allowing workers to move from lower to higher wage opportunities, would tend to reduce inequality and poverty. In fact, measuring the impact of migration on inequality and poverty is difficult.Footnote 67 Nevertheless, survey data provide informative evidence. Luo and Sicular analyse the impact of migration on inequality by examining the composition and distribution of rural household incomes in the CHIP rural survey data.Footnote 68 They find that income from migrant employment contributed to robust and widely shared growth in rural household incomes between 2002 and 2007. Inequality decompositions indicate that earnings from migrant work reduced income inequality. In addition, without earnings from migrant jobs, rural incomes would have grown more slowly, and consequently the urban–rural income gap would have been larger. By moderating the urban–rural income gap, it seems that migrant earnings likely dampened the rise in nationwide inequality.
Luo and Sicular also provide some statistics regarding the relationship between migration and poverty (see Table 7). In 2002, poverty rates for individuals in migrant and non-migrant households were 26 per cent and 28 per cent, respectively. In other words, individuals living in households without migrant earnings were no more likely to be poor than were those living in households with migrant earnings. By 2007, poverty rates had declined both for households with and without migrant earnings, but more so for households with migrant earnings. Consequently, in 2007 the poverty rate for migrant households was lower than that for non-migrant households; also, the share of the poor living in migrant households – 38 per cent – was lower than the share of the population living in migrant households. These statistics are consistent with a scenario in which migrant work provided a path out of poverty. A study by the World Bank similarly concludes that, although the poor continue to face barriers to migration, on balance migration has reduced poverty in rural China.Footnote 69
Minimum Living Standard guarantee programme
The minimum living standard guarantee programme (dibao) was piloted in Shanghai in 1993. After 1999 when the State Council promulgated the Regulations on the Minimum Living Standard Guarantee for Urban Residents, the programme expanded rapidly in urban areas (Table 8). By 2003, the number of urban beneficiaries had reached 22.5 million; since then, the number of participants has remained more or less at this level. According to the Ministry of Civil Affairs, at the end of 2010 a total of 11.5 million urban households (23.1 million individuals) received dibao subsistence allowances, with annual expenditures on urban dibao allowances totalling 52.47 billion yuan, up 8.8 per cent over the previous year. Of this, 36.56 billion yuan came from central government subsidies, accounting for 69.7 per cent of the total expenditure.Footnote 70
Table 8: Number of Urban and Rural Residents Supported by the Minimum Living Standard Guarantee Programme (millions), 2001–2012

Sources:
Ministry of Civil Affairs. 2010. “Minzhengbu fabu 2009 nian minzheng shiye fazhan tongji baogao” (Ministry of Civil Affairs issues statistical report on the development of civil affairs work development), 10 June, http://www.mca.gov.cn/article/zwgk/mzyw/201006/20100600080798.shtml. Accessed 11 December 2013. Ministry of Civil Affairs. 2013. “Minzhengbu fabu 2012 nian shehui fuwu fazhan tongji baogao” (Ministry of Civil Affairs issues statistical report on the development of social services), 19 June, http://www.mca.gov.cn/article/zwgk/mzyw/201306/20130600474640.shtml. Accessed 11 December 2013. NBS 2012.
According to the Ministry of Civil Affairs, the main dibao beneficiaries in urban areas are the unemployed, the elderly without pensions, and children. In 2009, together these three groups of people accounted for more than 70 per cent of all recipients.Footnote 71 In recent years, dibao thresholds and benefits have been increased. For instance, the average urban dibao threshold in 2010 was 251 yuan per person per month, up 10.3 per cent over the previous year; in that year the monthly dibao benefit received by urban recipients averaged 189 yuan per person per month, up 9.9 per cent over the previous year.Footnote 72
Research analysing the impacts of the urban dibao programme on income distribution finds that, despite the programme's aims and large coverage, it does not have a significant impact on urban income inequality. Evidence on its impact on poverty is mixed. Shi Li and Sui Yang's 杨穗 2009 article compares income inequality and poverty calculated using incomes excluding and including the dibao transfers. Estimates are carried out using the CHIP 2007 urban household survey data. The Gini coefficient for incomes including the dibao transfers is lower than that excluding the transfers, but the difference is very small. The poverty impacts, however, are substantial. Using the provincial average dibao thresholds as the poverty lines, Li and Yang find that the poverty headcount is reduced by 42 per cent, on average, when comparing poverty measured over income including the dibao transfers versus excluding the dibao transfers. The poverty gap and squared poverty gap decline by 57 per cent and 63 per cent, respectively.Footnote 73
In contrast, Shaohua Chen, Martin Ravallion and Youjuan Wang 王有捐 find that the urban dibao programme's impact on poverty is more modest.Footnote 74 Like Li and Yang, this study uses the dibao threshold as the poverty line and compares poverty measures using income including and excluding the dibao transfers. The decline in the poverty headcount rate is less than 10 per cent; declines in the poverty gap and squared poverty gap are larger at 10–20 per cent, but still much smaller than Li and Yang's estimates.
Chen, Ravallion and Wang also analyse the targeting performance of the urban dibao programme and find that in this regard the programme performed well. They conclude that the main reason behind the small poverty impact of the urban dibao programme is that the number of beneficiaries was small relative to the total number of people whose incomes fell below the dibao thresholds. The reasons for the differences in estimates between their study and Li and Yang's are not clear, but may have to do with differences in the samples and year.Footnote 75 More research is needed on this question.
China's rural dibao programme was established later than the urban programme and did not extend nationwide until 2007. In the early 2000s, the programme was adopted by some provinces, but the number of participants was less than 5 million. In ensuing years, especially after the programme was adopted nationally in 2007, the number of participants increased rapidly, levelling off at about 53 million in 2011 (Table 8). In 2004, 0.46 per cent of the rural population received the subsistence allowance; this rose to nearly 8 per cent in 2011. Spending on the programme grew apace. In 2011, total spending on the rural dibao programme was 67 billion yuan or, on average, 1,250 yuan per recipient, an amount equivalent to more than half of the official poverty line of 2,300 yuan in that year.Footnote 76
Despite its rapid expansion in terms of both participation and expenditures, the impact of the rural dibao programme on inequality and poverty has been limited. Quheng Deng and Shi Li use data from the 2008 rural poverty monitoring survey data collected by the NBS to analyse the programme's impact on rural poverty in designated poor counties.Footnote 77 Table 9 compares the change in different poverty measures calculated using incomes including and excluding the dibao transfers. For dibao recipients, the dibao allowance has a noticeable impact, reducing poverty incidence by 21 per cent, the poverty gap by 33 per cent and the squared poverty gap by 38 per cent. This change in poverty incidence implies that the rural minimum living standard guarantee system lifted more than 20 per cent of its recipients out of poverty.
Table 9: Poverty Status of Rural Households in Poor Counties before and after Dibao

Source:
Deng and Li Reference Deng and Li2010.
Nevertheless, the impact on overall rural poverty in these poor counties was small. The dibao programme only reduced overall rural poverty incidence by 2.5 per cent, the poverty gap by 3.7 per cent and the squared poverty gap by 2.5 per cent (Table 9). Preliminary research by Jennifer Golan, Terry Sicular and Nithin Umapathi using CHIP data for 2007 through 2009 yields similar results. The rural dibao programme provided substantial income benefits to programme beneficiaries, but, owing to limited coverage and large targeting errors, only reduced national poverty incidence by half a percentage point at most.Footnote 78 Neither of these studies estimates the impact of the rural dibao programme on inequality; however, given the small impact on poverty, one could infer that it is probably unremarkable.
Regional development strategy
Since the beginning of the reform period, China has experienced unbalanced regional development. During the 1980s and 1990s, economic growth was much higher in the coastal region than in the western region, and regional gaps in GDP per capita, government revenues, public services, household incomes and consumption all widened. In 2000, the central government initiated the “open up the west” strategy, which targeted 12 provincial-level units in west China.Footnote 79 The programme encompassed infrastructure investment, preferential policies for foreign investment, ecological protection (such as reforestation), and the provision of public services in areas such as education, health and social welfare. Consistent with this plan, the central government increased public spending in the region. For instance, from 2000 to 2010, the central government spent a total of 2.2 trillion yuan on infrastructure projects in the west.Footnote 80
To support local economic and social development, the central government substantially increased fiscal transfers to western regions. As shown in Figure 8, as a share of provincial fiscal expenditures, central fiscal transfers increased noticeably for most of the western provinces. Poorer provinces such as Qinghai and Tibet benefited most. For example, from 2000 to 2010, fiscal transfers received by Qinghai increased from 52 per cent to 68 per cent of its expenditures, and those received by Tibet rose from 61 per cent to 92 per cent of its expenditures.

Figure 8: Fiscal Transfers from the Central Government as a Percentage of Provincial Fiscal Expenditures in Ten Western Provinces
Available evidence on the impact of the “open up the west” strategy is mixed. During the 1990s, the 12 western provinces lagged behind other provinces in terms of GDP growth, and their share of national GDP declined from 20 per cent in the early 1990s to 17 per cent in 2000. After 2000, the GDP performance of these provinces did not outperform the national average, but kept pace, and their share of national GDP remained stable at 17 per cent. From 2007 onwards, GDP growth in the west began to outpace that in the rest of China, so that by 2011, its share of national GDP had recovered to 19 per cent. It is unclear whether these latter years represent a long-term trend or the short-term effects of the world financial crisis and the government's stimulus programme.Footnote 81
Trends in rural household incomes have been similar to those in GDP. Relative to the national average, rural household income per capita in the 12 western provinces remained fairly stable – equal to 73 per cent of the national average from 2005 to 2007. Some catch up occurred thereafter, so that by 2011, rural income per capita in the west had reached 76 per cent of the national average.Footnote 82 Again, it is unclear whether this catch up reflects long-term or short-term factors.
There is no direct evidence on whether the “open up the west” strategy has reduced income inequality in China. However, some studies provide estimates of the importance of between-region income gaps to overall national inequality. Using the CHIP data for 2002 and 2007, Li, Luo and Sicular find that the contribution of between-region inequality to national inequality is in fact relatively low.Footnote 83 Without adjustments for spatial price differences, regional gaps in household income per capita contributed 15 to 20 per cent of national inequality in both years. With spatial price adjustments, regional income gaps contributed only 11 to 12 per cent of national inequality. These estimates reveal that (a) the contribution of between-region inequality did not decline between 2002 and 2007, and (b) the majority of national inequality was not due to income gaps between regions, but to income inequality within regions. These estimates raise questions about the efficacy of regional fiscal transfers as a policy tool for the reduction of income inequality.
Development-oriented rural poverty programmes
In 1986, the central government established the Leading Group of Poverty Alleviation and Development (Guowuyuan fupin kaifa lingdao xiaozu 国务院扶贫开发领导小组), an inter-ministerial body under the State Council with responsibility for national anti-poverty work, and initiated the “development-oriented poverty reduction” (fupin kaifa 扶贫开发) programme. Under this programme, the government selected a set of poor counties as targets for centrally funded poverty reduction interventions. Provinces also selected provincial-level poor counties for additional, although typically more modest, provincially funded interventions.
The fupin kaifa approach was renewed and expanded in 1994 with the central government's 8-7 Plan for Poverty Reduction (Guojia ba-qi fupin gongjian jihua 国家八七扶贫攻坚计划). The 8-7 Plan aimed to reduce the number of poor by 80 million in a seven-year time frame. The emphasis continued to be on economic development programmes in targeted poor counties, mainly in the form of subsidized loans for local industry and agriculture, grants for industry, agriculture, infrastructure, health and education, and public works/workfare programmes for construction of local infrastructure. At this time, central funding rose sharply and the number of nationally designated poor counties increased to its present number of 592, comprising 28 per cent of China's county-level administrative units.Footnote 84
At the conclusion of the 8-7 Plan, the State Council took stock of poverty outcomes and launched a new ten-year plan, the “Outline of the poverty alleviation and development policies in rural China, 2001–2010” (Zhongguo nongcun fupin kaifa gangyao 中国农村扶贫开发纲要 2001–2010 年, hereafter 2001–2010 Plan), that incorporated new approaches to poverty reduction. The locus of targeting now shifted from poor counties to poor townships, poor villages and poor households. In addition, targeting criteria were broadened to include not only income and grain production levels, but other variables such as health, education and housing conditions. A central, innovative component of this plan was a comprehensive, participatory community-based village programme (zhengcun tuijin 整村推进) supporting infrastructure and social welfare investments in 148,000 poor villages containing 15 per cent of China's rural population.Footnote 85 Like its predecessors, the 2001–2010 Plan emphasized development-based programmes that would benefit households with labour capacity. The rural dibao programme discussed earlier, a separate, complementary intervention managed by the Ministry of Civil Affairs, would address chronic poverty among households with limited labour capacity.Footnote 86
Under the 2001–2010 Plan, government funding of development-oriented poverty reduction programmes under the Leading Group on Poverty increased markedly, from 12.75 billion yuan in 2001 to 34.93 billion yuan in 2010, an average annual increase of 8 per cent per year in real terms. Of this spending, 70 per cent was from the central government; by 2004, the central government was allocating more than 5 per cent of its annual fiscal budget to official poverty programmes.Footnote 87 Although the targeting locus shifted to poor townships and villages, 71 per cent of spending still went to the 592 designated poor counties, which suggests that many of the designated poor villages and townships were located in those counties.Footnote 88
In 2011, the State Council issued a new ten-year poverty reduction plan, the “Outline for development-oriented poverty reduction for China's rural areas (2011–2020).” This new plan aims to eradicate poverty by 2020. It is formulated on the basis of the new, higher official poverty line and explicitly recognizes the different situations of the chronic poor versus low-income households that are vulnerable to short-term poverty. It continues to emphasize a two-pronged approach, with development-oriented poverty reduction projects accompanied by social security programmes that ensure basic subsistence for vulnerable households, and ongoing investments in rural health and education. Development-based poverty reduction programmes will target 600 extremely poor counties in contiguous areas in central and western regions – areas that contain about 70 per cent of China's rural poor.
As discussed earlier, rural poverty has declined substantially during the span of these development-oriented poverty programmes (Figure 6). The extent to which the decline is a result of these targeted development-oriented poverty programmes or other factors such as broader macroeconomic growth is unclear. Only a few studies provide careful evaluations, and most look at targeting performance or the impact on local economic or income growth rather than on poverty.
With respect to targeting, for example, Albert Park, Sangui Wang 汪三贵 and Guobao Wu 吴国宝 analyse the 8-7 Plan and find that the selection of poor counties was reasonably good in the sense that most poor counties were so designated; however, as many as one fifth of designated poor counties had average incomes above the poverty line.Footnote 89 Perhaps more importantly, Park, Wang and Wu report that the majority of the population living in the designated poor counties was not poor, and that most of China's poor rural population lived outside the designated poor counties. Targeting performance is different from poverty impact, but poorly targeted programmes are likely to have a weaker impact on poverty.
Evaluation of the impact of government programmes on incomes or poverty rates requires controlling for systematic differences between recipients and non-recipients. A common approach is simply to compare outcomes for programme recipients to those for non-recipients. For example, according to a government report, during the 2001–2010 decade, per capita GDP grew at an average annual rate of 14 per cent and per capita income of rural households grew at an average annual rate of 8 per cent (in constant prices) within the designated poor counties.Footnote 90 Both these growth rates exceeded the national averages. Such a comparison of poor versus non-poor counties, however, does not correctly measure programme impact because the recipients of targeted programmes usually differ systematically from non-recipients.
Studies of the impact of China's development-oriented poverty programmes that address this “selection” problem generally find smaller impacts. Park, Wang and Wu analyse designated poor versus non-designated counties during the 1980s through to 1995 and find that growth in per capita incomes in the designated poor counties was 1 to 2 per cent per year higher than one would have expected otherwise.Footnote 91 Lingsheng Meng finds significant and substantial growth in per capita incomes from 1994 to 2000 in designated poor counties under the 8-7 Plan.Footnote 92 However, neither study looks directly at poverty impacts. Park, Wang and Wu explicitly note that this income growth may not have translated into a significant reduction in poverty because the majority of the population in the designated poor counties was not poor, and the majority of China's poor did not live in these counties.
A more recent study by Park and Wang, using data from 2001 to 2004, evaluates the impact of the poor village development programme under the 2001–2010 Plan.Footnote 93 It finds that the programme significantly increased average incomes and consumption in recipient villages, but income and consumption gains within the villages mostly went to richer and not to poorer households. The authors conclude that during its first three years, the village development programme did not substantially reduce rural poverty.
Additional research is needed to understand the impacts of China's efforts to address poverty through targeted development-oriented programmes. The central government has demonstrated an ongoing substantial commitment to these programmes, and with attention to the evolving patterns and causes of poverty. Available research generally finds that these programmes have contributed to growth in average household incomes in the recipient counties and villages. Their impact on poverty, however, remains unclear.
Conclusion
A growing body of research provides increasingly detailed information on major trends in income distribution and poverty in China and contains some lessons for future policy. Since the mid-1990s, income inequality among households in China has increased and is now moderately high by international standards. China's level of inequality reflects some persistent factors such as the urban–rural income gap and some new factors such as income from private property and assets. Rising inequality has not been the result of stagnant or falling incomes of lower-income groups; indeed, lower-income groups have experienced substantial income growth, and the poverty rate has declined. However, income growth has been even greater for higher-income groups. Rising inequality also has not been the result of widening interregional income gaps. Although incomes are, on average, lower in the west and higher in the east, inequality among households in China is primarily associated with inequality within regions, rather than among regions.
Our review of selected distributional policies from the Hu–Wen decade reveals that some policy approaches have been more effective than others in addressing inequality and poverty. Owing to their somewhat limited and incomplete coverage, weak administration and uneven enforcement, taxation and minimum wage policies have not been overly effective in this regard. Recent policy documents propose using tax measures such as property and estate taxes as well as minimum wage regulations to moderate inequality. The distributional impact of such measures is not guaranteed and will depend on the details of their design, administration and enforcement.
Broad regional development programmes such as the “open up the west” strategy may have narrowed regional gaps in GDP per capita, but within regions their benefits do not necessarily reach low-income and poor households. From the perspective of national household income inequality, the usefulness of broad regional programmes is limited because inequality among households is mainly within regions.
More narrowly targeted interventions such as the dibao programme and village-level development-oriented poverty programmes are a step in the right direction, and studies of some such programmes, for example the urban dibao programme, have found them to have positive distributional outcomes. In other cases, for example the rural dibao programme, studies have found considerable leakage of benefits to non-poor households and that a high proportion of poor households are not covered. The distributional impacts of targeted interventions depend on local implementation and fiscal capacity, which vary widely in China's decentralized fiscal system.Footnote 94 In some cases, moreover, the large sums of money involved have generated rents and created adverse incentives that encourage the diversion of funds.
Problems of implementation, administration and enforcement are not unique to China. Addressing these problems may require fundamental reforms in governance and the fiscal system. Careful attention in policy design to incentive mechanisms could also be beneficial. In this regard, the positive distributional impact of the relaxation of restrictions on rural–urban migration provides some lessons. Migration occurs through self-selection, rather than through selection of beneficiaries by local officials. The benefits from migration are not in the form of fiscal transfers, but of economic opportunities. Poor and low-income households have disproportionately chosen to pursue these opportunities.
Appendix Table A1: Urban and Rural Income Inequality as Measured by the Gini Coefficient, 1995–2012