


Introduction
Animal growth involves dynamic changes in visceral organ size and body tissue deposition (Crickmore and Mann, Reference Crickmore and Mann2008). The rates of weight gain are greater from birth to puberty due to deposition of bone and muscular tissues (Owens et al., Reference Owens, Dubeski and Hanson1993). However, the rates may differ among sexes, because the rate of adipose tissue deposition differs (Almeida et al., Reference Almeida, Resende, Tedeschi, Fernandes, Regadas Filho and Teixeira2016). Changes in body tissue deposition over time implies differences in energy requirements, for instance older animals have a greater fat deposition rate and consequently greater net energy requirements for growth than young animals (Souza et al., Reference Souza, St-Pierre, Fernandes, Almeida, Vargas, Resende and Teixeira2017). Moreover, the net energy requirements for maintenance are associated with the mass of gastrointestinal tract (GIT) and liver (Baldwin et al., Reference Baldwin, McLeod, Klotz and Heitmann2004), because these visceral organs are metabolically very active and show high energy expenditure for their maintenance functions (i.e. protein synthesis and degradation, nutrient cycling and the sodium–potassium pump activity, among others) (McBride and Kelly, Reference McBride and Kelly1990). In ruminants, the visceral organs may account for up to 0.40–0.60 of the whole body oxygen consumption and ATP use (McBride and Kelly, Reference McBride and Kelly1990; Baldwin et al., Reference Baldwin, McLeod, Klotz and Heitmann2004). Considering the important role the visceral organs play on the energy costs of an animal, their growth pattern needs to be better understood.
The knowledge of growth is an important step for developing models that predict the nutritional requirements of ruminants over time, because they summarize valuable information into a few parameters that have biological meaning (Goliomytis et al., Reference Goliomytis, Orfanos, Panopoulou and Rogdakis2006; Pittroff et al., Reference Pittroff, Dahm, Blanc, Keisler and Cartwright2008). Studies on growth curves of farm animals have been used to assess how body components (e.g. carcass, fat and organs) develop over time (Goliomytis et al., Reference Goliomytis, Orfanos, Panopoulou and Rogdakis2006; Regadas Filho et al., Reference Regadas Filho, Tedeschi, Rodrigues, Brito and Oliveira2014). However, to the authors' knowledge, no studies to date have evaluated the differences of visceral organs growth curve parameters between sexes in goats. Therefore, the objective of the current study was to fit and compare growth curves that best describe body and visceral organs growth over time in Saanen goats of different sexes.
Materials and methods
The procedures were reviewed and approved by São Paulo State University's Ethics and Animal Welfare Commission. Systematization of the results was achieved by applying a comprehensive statistical procedure to obtain the general growth pattern over time of the visceral organs of female, castrated male and intact male Saanen goats from 5 to 45 kg body weight (BW). This weight range corresponded to 0.5- to 19.5-month-old females and 0.5- to 13.5-month-old intact and castrated males. Moreover, allometric coefficients were calculated to explore how body traits change with body size.
Data set
A data set was developed based on seven studies composed of 237 individual records for visceral organ weight of female (n = 71), castrated male (n = 69) and intact male (n = 97) Saanen goats fed ad libitum (Table 1).
Table 1. Summary characteristics of the seven studies used in the data set

a Total number of records in the study.
b Suckling refers to goats that were fed both milk and solid diet and weaned refers to goats that were fed only a solid feed.
c Body weight.
d Empty body weight.
In all studies, goats were fed similar diets that consisted of dehydrated maize (Zea mays, whole maize plants chopped, when the kernel milk line was approximately two-thirds of the way down the kernel and then dehydrated) or Tifton hay (Cynodon spp.), maize grain, soybean meal (Glycine max), soybean oil, limestone and a mineral and vitamin supplement. The roughage-to-concentrate ratio ranged between 25 : 75 and 50 : 50. Crude protein and metabolizable energy composition of the goat diets in the studies ranged from 137 to 204 g/kg dry matter and from 10.0 to 11.3 MJ/kg dry matter, respectively. Further details about the goats and diets used in each study can be found in Gomes (Reference Gomes2011), Bompadre et al. (Reference Bompadre, Neto, Mendonça, Souza, Oliveira, Fernandes, Harter, Almeida, Resende and Teixeira2014), Medeiros et al. (Reference Medeiros, Resende, Teixeira, Araujo, Yanez and Ferreira2014), Almeida et al. (Reference Almeida, Resende, ST-Pierre, Silva, Soares, Fernandes, Souza, Silva, Lima and Teixeira2015), Ferreira et al. (Reference Ferreira, Yanez, Medeiros, Resende, Pereira Filho, Fernandes, Almeida and Teixeira2015), Leite et al. (Reference Leite, Krizsan, Figueiredo, Carvalho, Teixeira and Huhtanen2015a) and Figueiredo et al. (Reference Figueiredo, Berchielli, Resende, Gomes, Almeida, Sakomura and Teixeira2016) (Table 1 and Table A1 of the Appendix). The dry matter intake (DMI) in grams per day per kilogram of empty body weight (EBW) (g/day/kg EBW) was calculated by the sum of the DMI (g) of milk (for pre-weaned goat kids) and the DMI (g) of ration, and the result divided by the days on feed and further divided by final EBW in kg.
In each of the selected studies, serial slaughters at different ages were conducted. Moreover, the slaughter procedures were similar in all studies. In summary, BW was recorded immediately before slaughter, then goats were stunned using a captive bolt pistol, followed by severing the carotid artery and jugular vein. The metabolic EBW (MEBW) was obtained by taking EBW to the power of 0.75. The liver, pancreas, spleen, mesenteric adipose tissue (MAT) and GIT were removed and their weights recorded: the sum constitutes the total visceral organs (Table 2). The GIT was separated into rumen–reticulum, omasum, abomasum, small intestine (SI; sum of duodenum, jejunum and ileum) and large intestine (LI; sum of cecum, colon and rectum). The weight of each segment of the GIT was recorded before and after emptying, to obtain the weight of GIT content. The EBW was calculated as BW minus the weight of wet content of bladder, GIT and biliary vesicle. Stomach weight (STO, g) was composed of the sum of rumen–reticulum, omasum and abomasum, while intestine weight (IN, g) was the sum of SI and LI, and GIT weight (g) was obtained as the sum of STO and IN. Data for the weight of visceral organs and MAT are summarized in Table 2.
Table 2. Summary of statistics related to body weight and empty body weight (kg), visceral organs (g) and dry matter intake (DMI; g/day/kg EBW) of Saanen goats

a Total number of records used in the study, after removing outliers.
Statistical analyses and parameter estimation
Initially, eight models were evaluated: simple linear regression (Eqn (1)), quadratic (Eqn (2)), monomolecular (Eqn (3); Mitscherlich, Reference Mitscherlich1909), Brody (Eqn (4); Brody, Reference Brody1945), Von Bertalanffy (Eqn (5); Von Bertalanffy, Reference Von Bertalanffy1957), logistic (Eqn (6); Verhulst, Reference Verhulst1838), Gompertz (Eqn (7); Gompertz, Reference Gompertz1825) and Richards (Eqn (8); Richards, Reference Richards1959). These models were chosen in order to investigate the carcass and visceral organ growth over time.


where $\hat{y}_{ijk}$ is the value of the dependent variable (the mass of a given organ expressed in g, or as g/kg EBW, or as g/kg GIT (only for rumen–reticulum, omasum, abomasum, SI and LI)), for the i th animal of the j th sex in the k th study; X is the age (months) of the animals; S k is the random effect of the k th study $(S \sim N(0,\sigma _S^2 ))$
 , and e ijk is the residual error $(e \sim N(0,\sigma _e^2 ))$
 ; i = 1,…,n ij; j = 1, 2, 3; k = 1,…,7; a is the regression constant, which represents the intercept of the line with the y-axis; b is a regression coefficient, which represents the slope of the line; c is a constant coefficient; A is the weight of the organ when the age tends to infinity, that is, the asymptotic weight of the organ; B is the constant of integration; e is a base of the natural logarithm; C is the rate that determines the curve span along the x-axis (age), that is, the growth rate relative to the maximum weight; and M is the constant that determines the final BW ratio when the inflection point occurs (only in the Richards model). Additionally, to explore how the visceral organs change with body size, the relationship between the size of visceral organs and the size of the EBW was scaled by fitting allometric models.

where $\hat{y}_{ijk}$ is the value of the dependent variable (the mass of a given organ expressed in g), for the i th animal of the j th sex in the k th study; EBW is the empty body weight of the animals expressed in kg; S k is the random effect of the k th study $(S \sim N(0,\sigma _S^2 ))$
 , and e ijk is the residual error $(e \sim N(0,\sigma _e^2 ))$
 ; i = 1,…,n ij; j = 1, 2, 3; k = 1,…,7; a is the regression constant, which represents the intercept of the line with the y-axis; b is an allometric coefficient, which represents the ‘differential growth ratio’ (Huxley, Reference Huxley1924). Isometric growth was considered when the allometric coefficient was equal to 1 (P ⩾ 0.10), hypoallometric growth when the allometric coefficient b was smaller than 1 (P < 0.10), and hyperallometric growth when the allometric coefficient b was greater than 1 (P < 0.10).
Data were fitted to the models using the NLMIXED procedure in SAS (version 9.4), considering sex as a fixed effect and study and residual errors as the random effects (St-Pierre, Reference St-Pierre2001). The diet used by the studies was not included in the models because only one diet was used per study, thus diet effect was indirectly accounted for in the analysis when the effect of study was considered. Because of large data variability, outliers from different studies were removed when their normalized residuals were >|3|. The variability within studies was modelled by introducing a parameter μ into A (for Eqns (3)–(8)) or a (for Eqns (1), (2) and (9)) (Sauvant et al., Reference Sauvant, Schmidely, Daudin and St-Pierre2008). The study effect was considered on the parameters a and A of the models, i.e. the intercept and the asymptote parameter. ‘Dummy’ variables were created to test the fixed effect of sex on all estimated parameters of the equations and not only on the intercept. Therefore, three dummy variables (z 1, z 2 and z 3) were created. For females, z 1 = 1, z 2 = 0 and z 3 = 0; for castrated males, z 1 = 0, z 2 = 1 and z 3 = 0; and for intact males, z 1 = 0, z 2 = 0 and z 3 = 1 (Draper and Smith, Reference Draper and Smith1998). Growth curve parameters for each sex were estimated using the ESTIMATE statement, and they were compared using the CONTRAST (P < 0.10).
The models were evaluated using the lowest value of Akaike information criterion (Akaike, Reference Akaike1974), corrected for small samples (AICc) (Sugiura, Reference Sugiura1978), and the concordance correlation coefficient (CCC). The CCC was used as an indicator of how well the model fits the data, as a reproducibility index (Lin, Reference Lin1989), to account for accuracy and precision at the same time:

where ρ is the Pearson correlation coefficient estimate that accounts for precision, and C b is a bias correction factor that accounts for accuracy.
From the fitted models for carcass or visceral organs growth over time, the models that showed the best fit were chosen. In the second step, the error structure of the previously selected models and allometric models was modelled to refine its adjustments and to seek homogeneous variance of the residuals. Therefore, the variance $(\sigma _e^2 )$ for the model selected for each variable was modelled according to Araújo et al. (Reference Araújo, Vieira, Rocha, Abreu, Glória, Rohem Júnior and Fernandes2015):


where c and φ are the parameters, and μ is the predicted value of the weight of a specific organ. Following these tests, the models with modelled error structure were evaluated using the lowest value of AICc. Moreover, because age was not the predictor in the allometric model, the error structure of the allometric model was modelled using only V 1 and V 3.
The organ growth rate in g/month was calculated as the first derivative and the inflection point was calculated as the second derivative of the models (Stewart, Reference Stewart2013).
Results
Model evaluation and variance modelling
According to the evaluation criteria established for assessing the model (lowest AICc and highest CCC), monomolecular (Eqn (3)) and Richards (Eqn (8)) models did not fit the growth of the visceral organs evaluated; the simple linear regression (Eqn (1)) was the one that best fit the growth of the total visceral organs, GIT, intestines (g/kg EBW) and DMI (g/day/kg EBW) (Table 3). The quadratic model (Eqn (2)) best fits the growth of the liver, pancreas, SI, LI (g/kg EBW) and omasum (g/kg GIT) (Table 3). The Brody model (Eqn (4)) best fits the growth of the spleen (g) and abomasum (g/kg EBW and g/kg GIT) (Table 3). The Von Bertalanffy model (Eqn (5)) best fits the growth of the MAT (g/kg EBW) and SI (g/kg GIT) (Table 3). The logistic model (Eqn (6)) best fits the growth of the liver, pancreas, MAT, GIT, omasum, abomasum, stomachs, intestines, SI, LI, total visceral organs, BW, MEBW and EBW (g) (Table 3). The logistic model (Eqn (6)) was also the best fit for the growth of the spleen, rumen–reticulum, omasum, stomachs (g/kg EBW) and rumen–reticulum (g/kg GIT) (Table 3). The Gompertz model (Eqn (7)) best fits the growth of the rumen–reticulum (g) and LI (g/kg GIT) (Table 3).
Table 3. Comparison of models for predicting the growth of visceral organs (g, g/kg EBW or g/kg GIT) and dry matter intake (DMI; g/day/kg EBW) of Saanen goats

–, Model did not converge; AICc, corrected Akaike information criterion for small samples; CCC, concordance correlation coefficient.
a Chosen models, in bold.
The models fitted to the growth of the pancreas (g/kg EBW), spleen (g/kg EBW) and LI (g/kg GIT) presented homogenous variance (Table A2 of the Appendix). For the models that presented non-homogeneous variance, the variance was modelled to seek a better fit. The V 2 (Eqn (12)) was used to model the variance of MAT, omasum and abomasum (g/kg EBW) (Table A2 of the Appendix). The V 3 (Eqn (13)) was used to model the variance of all organs (except pancreas, spleen and GIT; g), DMI (g/day/kg EBW), total visceral organs (g/kg EBW), liver (g/kg EBW), rumen–reticulum (g/kg EBW), GIT (g/kg EBW), stomachs (g/kg EBW), SI (g/kg EBW), LI (g/kg EBW), intestines (g/kg EBW), all organs (except LI; g/kg GIT) and all allometric models (g/kg EBW) (Tables A2 and A3 of the Appendix). The AICc and CCC information for the best-fit models and allometric models is presented in Tables 3–5, as well as Tables A2 and A3 of the Appendix.
Table 4. Akaike information criterion corrected for small samples (AICc), concordance correlation coefficient (CCC), precision and accuracy obtained with the models fitted to visceral organ growth (g, g/kg EBW and g/kg GIT), and dry matter intake (DMI; g/day/kg EBW) of Saanen goats

a Total number of records.
b Pearson correlation coefficient estimate accounts for precision.
c Bias correction factor accounts for accuracy.
d ${\rm Logistic}:\hat{y} = A/(1 + B\,e^{\ndash CX})$ .
.
e ${\rm Brody}:\hat{y} = A(1-B\,e^{\ndash CX})$ .
.
f ${\rm Gompertz}:\hat{y} = A\,e^{\ndash B\,e^{\ndash CX}}$ .
.
g ${\rm Simple}\,{\rm linear}\,{\rm regression}:\hat{y} = a + bx$ .
.
h ${\rm Quadratic}:\hat{y} = a + bx + cx^2$ .
.
i ${\rm Von}\,{\rm Bertalanffy}:\hat{y} = A(1-B\,e^{-CX})^3$ .
.
Table 5. Parameter estimates and fit statistics of allometric relationships between organs (g) and empty body weight (EBW, kg) of male, castrated male and female growing Saanen goats

a Allometric model: ŷ = a × EBWb.
b Akaike information criterion corrected for small samples.
c Concordance correlation coefficient.
d Pearson correlation coefficient estimate accounts for precision.
e Bias correction factor accounts for accuracy.
Dry matter intake, body weight and organ growth
Sex did not affect any parameters of the models fitted to total visceral organs, liver, pancreas and spleen (g), or total visceral organs, pancreas, spleen and MAT (g/kg EBW) (P > 0.10; Table 6). Sex also did not affect any parameters of the allometric models fitted for all organs (g/kg EBW; P > 0.10), except to the liver (g/kg EBW; P ⩽ 0.07; Table 5). Moreover, sex did not affect the parameter b of the model fitted to DMI (g/day/kg EBW) and the allometric model fitted to the liver (g/kg EBW), parameter A of the model fitted to BW (g), parameters A and B of the model fitted to EBW (g), parameter B of the models fitted to MEBW and MAT (g), parameter a of the model fitted to the liver (g/kg EBW) (P > 0.10; Tables 5 and 6 and Fig. 1).

Fig. 1. Colour online. Dry matter intake (DMI) in grams per day per kilogram of empty body weight (g/day/kg EBW) of Saanen goats of different sexes ( represents the observed records of females,
  castrated males and
  intact males; +++ represents the predicted females and castrated males (ŷ = (36.2 ± 2.50) − (0.37 ± 0.15) × Age), and
  intact males (ŷ = (32.9 ± 2.42) − (0.37 ± 0.15) × Age).
Table 6. Model that best fits body weight and organ growth in gram (g) and the proportion of empty body weight (g/kg EBW) of Saanen goats per age (months)
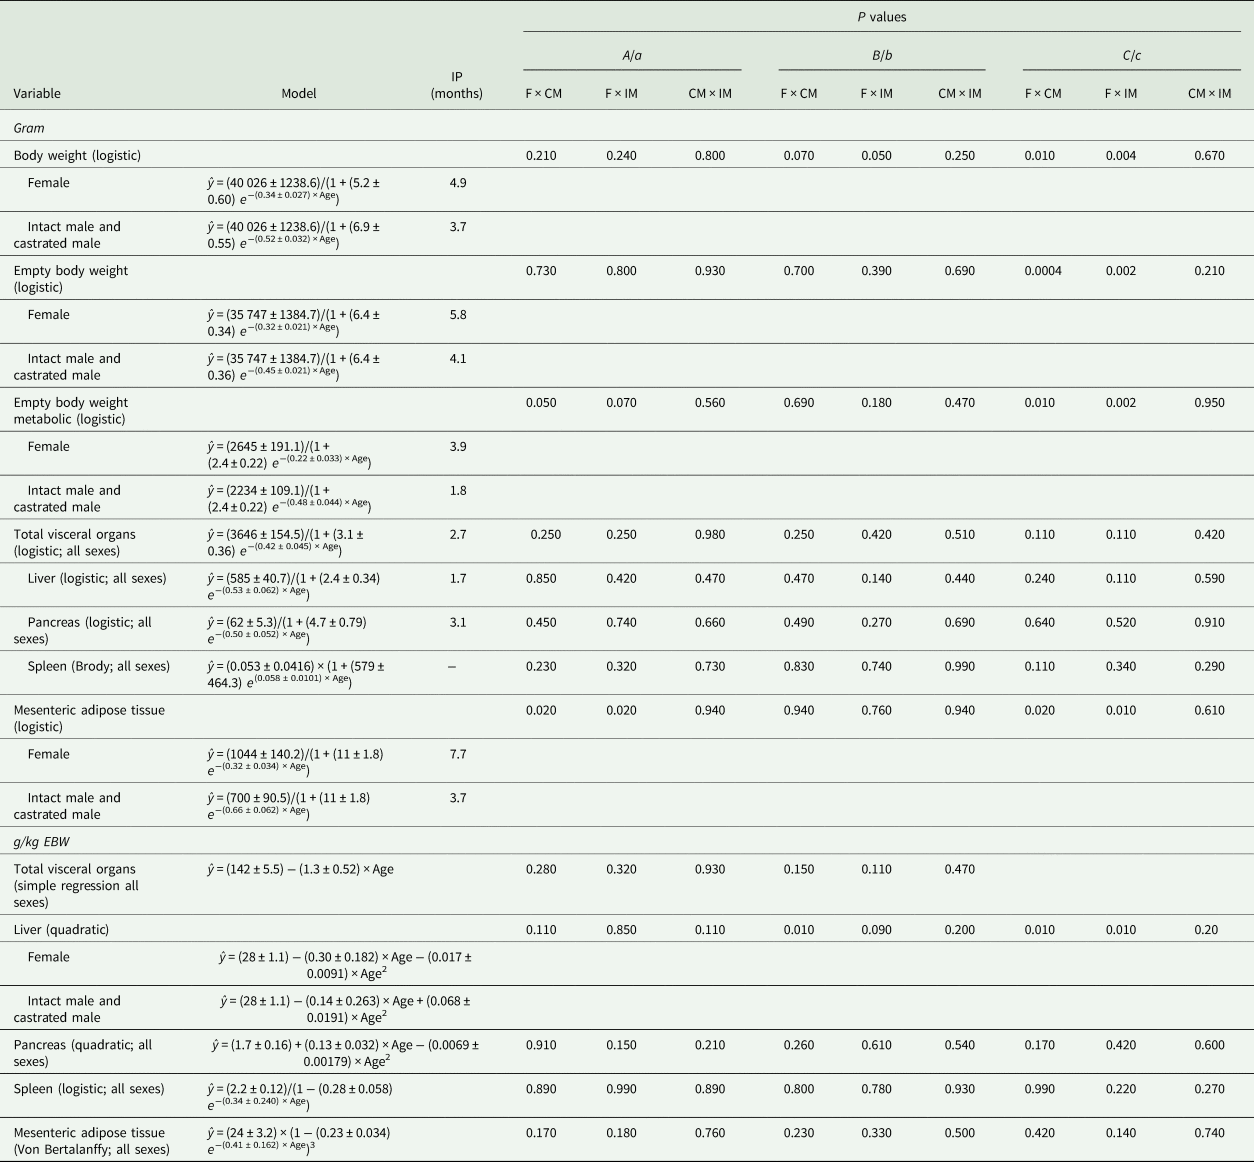
IP, inflection point; F, female; CM, castrated male; IM, intact male.
Castrated males and intact males had similar model parameters for predicting the growth of BW (g, parameters B and C), EBW (g, parameter C), MEBW (g, parameters A and C), MAT (g, parameters A and C) and liver (g/kg EBW, parameters b and c) (P > 0.10; Table 6), but they differed from females (P < 0.09; Table 6). In addition, females and castrated males had a similar model parameter a for predicting DMI (g/day/kg EBW; P > 0.10) and an allometric model parameter a for the liver (g/kg EBW; P = 0.40), but they differed from intact males (P ⩽ 0.07; Fig. 1 and Table 5).
Males reached 45 kg BW 6 months earlier than females because of faster growth (0.52 ± 0.032 v. 0.34 ± 0.027, respectively). Therefore, the inflection point of the female growth curve occurred at 4.9 months, while for males, it occurred at 3.7 months. These findings – greater growth rate and earlier inflection point of male goat kids – indicate greater growth of males at a younger age (up to 3.7 months old) (Table 6; Fig. 2).

Fig. 2. Colour online. Body weight, empty body weight in kilogram, total visceral organs and gastrointestinal tract in kg and the proportion of empty body weight (g/kg EBW) of Saanen goats of different sexes ( represents the observed records of females,
  castrated males and
  intact males;
  represents the predicted females,
  castrated males and intact males, — all sexes).
Irrespective of sex, at the beginning of the growth curve (0.5 months old), liver accounted for 28 ± 1.1 g/kg EBW and grew at a maximum rate of 0.53 ± 0.062 g/month, and pancreas accounted for 1.7 ± 0.16 g/kg EBW and grew at a maximum rate of 0.50 ± 0.052 g/month (Table 6; Fig. 3). The inflection point of the curve for the liver (g) occurred at 1.7 months and for the pancreas (g) at 3.1 months (Table 6 and Fig. 3). Liver presented a hypoallometric relationship to EBW (0.80 ± 0.027; Table 5). However, pancreas presented an isometric relationship to EBW (allometry coefficient of 1.1 ± 0.05; Table 5).

Fig. 3. Colour online. Liver, pancreas, spleen and mesenteric adipose tissue in grams (g) and the proportion of empty body weight (g/kg EBW) of Saanen goats of different sexes ( represents the observed records of females,
  castrated males and
  intact males;
  represents the predicted females,
  castrated males and intact males, — all sexes).
Males stabilized MAT growth (g) earlier than females (inflection point of 3.7 v. 7.7 months) because of a faster maximum growth rate of 0.66 ± 0.062 v. 0.32 ± 0.034 g/month (Table 6). Therefore, males and females reached a maximum MAT of 700 ± 90.5 g (within 13.5 months) and 1044 ± 140.2 g (within 19.5 months), respectively (Table 6 and Fig. 3). Irrespective of sex, MAT reached the maximum weight as 24 ± 3.2 g/kg EBW, within the evaluated period (Table 6 and Fig. 3). Mesenteric adipose tissues presented a hyperallometric relationship to EBW (1.5 ± 0.05; Table 5).
Gastrointestinal tract growth
Sex did not affect any model parameters for predicting the growth of rumen–reticulum, omasum, abomasum, stomachs, SI, LI, intestines or GIT (g); neither did it affect rumen–reticulum, omasum, stomachs or GIT (g/kg EBW), or rumen–reticulum, SI or LI (g/kg GIT) (P > 0.10; Table 7). In addition, sex did not affect the growth model parameters for abomasum (g/kg EBW, parameter B), SI (g/kg EBW; parameter a), LI (g/kg EBW; parameters b and c), intestines (g/kg EBW; parameter b) or omasum (g/kg GIT, parameter a) (P > 0.10; Table 7). Sex also did not affect any parameters of allometric models fitted between GIT segments and EBW (P > 0.10; Table 5).
Table 7. Model that best fits the gastrointestinal tract (GIT) growth in gram (g), in the proportion of empty body weight (g/kg EBW) and in the proportion of gastrointestinal tract (g/kg GIT) of Saanen goats per age (months)

IP, inflection point; F, female; CM, castrated male; IM, intact male.
Intact males and castrated males had similar parameters b and c for the growth models of SI (g/kg EBW) and omasum (g/kg GIT) (P > 0.10), but these parameters differed from females (P < 0.09; Table 7). Females and castrated males had similar model parameters for predicting LI and intestines (g/kg EBW, parameter a) and abomasum (g/kg GIT, parameters a and b) (P > 0.10), but these parameters differed for intact males (P < 0.09; Table 7). Females and intact males had different parameters A and C for predicting abomasum growth (g/kg EBW) (P < 0.06; Table 7). Castrated males and intact males had a different parameter c for predicting abomasum growth (g/kg GIT) (P < 0.04; Table 7).
Overall, rumen–reticulum and LI increased relative to EBW and GIT, whereas abomasum and SI decreased, as the animal grew (Figs 4 and 5). The inflection point of the abomasum (g) growth curve occurred at 0.5 months and had a maximum growth rate of 0.31 ± 0.062 g/month, whereas the inflection point of the rumen–reticulum (g) occurred at 1.4 months and had a maximum growth rate of 0.60 ± 0.082 g/month (Table 7). Moreover, rumen–reticulum and abomasum presented a hypoallometric growth to EBW (0.69 ± 0.059 and 0.55 ± 0.052, respectively). On the other hand, omasum showed an isometric relationship to EBW (allometry coefficient of 1.1 ± 0.06; Table 5).

Fig. 4. Colour online. Rumen–reticulum, omasum and abomasum in grams (g), the proportion of empty body weight (g/kg EBW) and the proportion of gastrointestinal tract (g/kg GIT) of Saanen goats of different sexes ( represents the observed records of females,
  castrated males and
  intact males;
  represents the predicted females,
  castrated males,
  intact males,
  castrated males and intact males, — all sexes).

Fig. 5. Colour online. Small intestine and large intestine in grams (g), the proportion of empty body weight (g/kg EBW) and the proportion of gastrointestinal tract (g/kg GIT) of Saanen goats of different sexes ( represents the observed records of females,
  castrated males and
  intact males;
  represents the predicted females,
  intact males,
  castrated males and intact males, +++ females and castrated males, — and all sexes).
Irrespective of sex, the maximum growth rate of GIT (g) was 0.53 ± 0.075 g/month and its inflection point was at 1.4 months (Table 7). At birth, the GIT accounted for 91 ± 4.9 g/kg EBW and decreased at a constant rate of 1.3 ± 0.46 g/kg EBW/month as the animal grew (Table 7). Gastrointestinal tract presented a hypoallometric relationship to EBW (0.63 ± 0.040; Table 5).
When the stomachs and intestines of males and females reached their maximum growth, the intestines constituted 548 ± 17 g/kg of GIT, and the stomachs accounted for 449 ± 18 g/kg GIT (Table 7). The inflection point of SI (g) and LI (g) growth curves was at 0.5 and 1.9 months, respectively (Table 7 and Fig. 5). The SI had a maximum growth rate that was lower than the LI (0.45 ± 0.092 v. 0.62 ± 0.093 g/month; Table 7). Small intestine and LI showed a hypoallometric relationship to EBW (0.47 ± 0.052 and 0.83 ± 0.065, respectively; Table 5).
Discussion
In general, the logistic model showed the best fit for modelling visceral organ growth over time. This result is understandable because at birth, animals show a greater anabolic rate compared to catabolic rate, resulting in body tissue accretion. However, with ageing, the ratio between anabolism and catabolism tends to become one; consequently, the rate of tissue growth decreases (Owens et al., Reference Owens, Dubeski and Hanson1993). The logistic model assumes that after the inflection point, growth rates tend to decrease with time until stabilizing (Verhulst, Reference Verhulst1838; Thornley and France, Reference Thornley and France2007; Mischan et al., Reference Mischan, Passos, Pinho and Carvalho2015). The inflection point is reached when the instantaneous absolute growth rate (i.e. the change in mass in respect to time) changes from an increasing to a decreasing function (Regadas Filho et al., Reference Regadas Filho, Tedeschi, Rodrigues, Brito and Oliveira2014).
Goats with BW varying from 5 to 45 kg were used in the current study. Intact and castrated males grew faster than females, which enabled them to reach the final BW of 45 kg before the females. On average, the adult BW of male Saanen goats varies from 80 to 91 kg and that of female Saanen goats is around 68 kg (Solaiman, Reference Solaiman2010). Thus, the BW range covered in the current work represents proportions of approximately 0.50 of intact males and 0.66 of females along the growth curve.
It has been reported that the inflection point of a growth curve represents puberty (the stage of sexual maturation) and afterwards, the growth rate decreases quickly until it reaches zero (Araújo et al., Reference Araújo, Vieira, Rocha, Abreu, Glória, Rohem Júnior and Fernandes2015). In the current study, the inflection point of the BW growth curve occurred at 147 days (4.9 months) for females and 111 days (3.7 months) for castrated males and intact males. Thus, Saanen goats reached puberty between 4 and 5 months old. These results concur with the previous reports, such as Freitas et al. (Reference Freitas, Lopes-Junior, Rondina, Salmito-Vanderley, Salles, Simplício, Baril and Saumande2004), who reported puberty of female Saanen goats at 4.9 months old, Solaiman (Reference Solaiman2010), who reported that the onset of puberty occurs at 4–6 months for males and 5–7 months for females and Regadas Filho et al. (Reference Regadas Filho, Tedeschi, Rodrigues, Brito and Oliveira2014), who reported puberty of female Saanen goats at 4.4 months. Considering the EBW, which is narrowly related to BW (Campos et al., Reference Campos, Almeida, Biagioli, Resende and Teixeira2017), it was observed in the current study that the inflection point of intact and castrated males occurred at 4.1 months, whereas that of females occurred at 5.8 months. The inflection point represents the age in which the EBW growth rate is maximal, indicating changes in body fattening. Thus, it is suggested that the inflection point of the EBW growth curve, when combined with economic indices, may be used to indicate the economically optimum slaughter age of goats.
The current results led to the rejection of the hypothesis that sex affects visceral organ growth over time. Regardless of sex, total visceral organ weight decreased in proportion to EBW with ageing. This finding was also demonstrated by the hypoallometric growth of total visceral organs to EBW, in which total visceral organs grow more slowly than EBW (Lyford, Reference Lyford and Church1993). This difference in growth pattern is related to the existence of different ages at the detected points of inflection (age at which maturity is reached) of EBW and total visceral organs, i.e. around 5 months for EBW and 3 months for total visceral organs. Consequently, these findings suggest that the energy expenditure for visceral organs in the proportion of total energy expenditure decreases as the animals become older. This concurs with the results of McCGraham (Reference McCGraham1966), who reported that young Merino wethers showed metabolic rates double those of adults. More recently, a study showed that energy requirements for the maintenance of adult dairy goats are lower than those for young goats (Härter et al., Reference Härter, Lima, Castagnino, Silva, Figueiredo, St-Pierre, Resende and Teixeira2017). Energy maintenance requirements involve the energy costs of the vital functions of an organism (AFRC, 1998). Total visceral organs account for approximately 0.10 of the total BW; however, they consume approximately 0.50 of the total energy expenses of a given animal (Huntington, Reference Huntington1990; Seal and Reynolds, Reference Seal and Reynolds1993). Thus, knowledge of visceral organ growth curve might be very useful in enhancing the understanding of their impact on energy maintenance requirements. Therefore, it is suggested that decreased maintenance energy requirements in adult goats could be partially related to decreased total visceral organ weight as a proportion of EBW, which is not influenced by animal sex.
All visceral organs grow as animals age. However, when based on EBW, each organ has a different growth pattern (Clauss et al., Reference Clauss, Lechner-Doll and Streich2003). Liver and GIT growths are highly responsive to nutrient intake (Ortigues and Doreau, Reference Ortigues and Doreau1995) and their weights, as a proportion of EBW at birth, indicate that nutrient intake relative to EBW is high in young animals and reduces with ageing. Moreover, the hypoallometric relationship between the liver and GIT to EBW demonstrated that the liver and GIT grow at a lower growth rate than EBW (Kamalzadeh et al., Reference Kamalzadeh, Koops, van Bruchem, Tamminga and Zwart1998; Al-Owaimer et al., Reference Al-Owaimer, Suliman, El-Waziry, Metwally and Abouheif2013). According to Church (Reference Church1988), GIT size, the absorption capacity of its epithelium and the liver's ability to metabolize nutrients are affected by feed intake. Young animals eat more in proportion to BW, leading to the greatest development of GIT tissues due to increased digesta flow, digesta mixture and absorption of water and nutrients (Ortigues and Doreau, Reference Ortigues and Doreau1995). In addition, the current results on liver weight as a proportion of EBW and the allometric relationship to EBW are in accordance with those of previous studies: the livers of pre-ruminants represent a greater proportion of EBW than that of adult ruminants (Baldwin et al., Reference Baldwin, McLeod, Klotz and Heitmann2004). This occurs because younger goats tend to select diets with greater energy content (Leite et al., Reference Leite, Krizsan, Figueiredo, Carvalho, Teixeira and Huhtanen2015b).
In addition, liver weight, as a proportion of EBW, may also be related to feed intake. It was observed that females and castrated males ate more relative to EBW than did intact males; however, EBW of castrated males increased at a greater rate than that in females. Therefore, this might be the main reason why females differ from intact and castrated males, regarding liver weight as a proportion of EBW. Similarly, abomasum, SI and LI also seem to be more affected by feed intake, because females generally showed the greatest weights for these organs as a proportion of EBW.
Animal's fattening has labile nature regarding its development (Fisher, Reference Fisher and Wiseman1984) because of its association to a wide range of factors, such as gender, nutritional supply, age and mature size (Wattanachant, Reference Wattanachant2018). In addition, there is a common view that fattening differences between the sexes are basically attributed to higher proportions of subcutaneous fat (Negussie et al., Reference Negussie, Rottmann, Pirchner and Rege2003). In goats, MAT represents around 0.30 of total abdominal fat and females have around 40% more MAT than males (Wattanachant, Reference Wattanachant2018). Studies have demonstrated that MAT deposition may be twice as fast as EBW (Teixeira et al., Reference Teixeira, Azevedo, Delfa, Morand-Fehr and Costa1995; Kamalzadeh et al., Reference Kamalzadeh, Koops, van Bruchem, Tamminga and Zwart1998; Al-Owaimer et al., Reference Al-Owaimer, Suliman, El-Waziry, Metwally and Abouheif2013). The current results demonstrated MAT growths 1.5 times faster than EBW regardless of sex, which is in accordance with the previous studies (Kirton et al., Reference Kirton, Fourie and Jury1972; Thonney et al., Reference Thonney, Taylor, Murray and McClelland1987; Wattanachant, Reference Wattanachant2018).
As digestion and absorption are accelerated in the first days of life (Guilloteau et al., Reference Guilloteau, Zabielski and Blum2009), low pancreas weight (g/kg EBW) may be related to low demand for digestive enzymes and high SI weight (g/kg EBW) may be due to the high absorption capability during this time. Accordingly, Ruckebusch et al. (Reference Ruckebusch, Dardillat and Guilloteau1983) reported that the secretory potentialities of the pancreas are minimal during the first week of life in new-born lambs and are mainly influenced by animal age, following the EBW growth, as observed by the isometric coefficient. However, it was possible to verify the decreased abomasum and SI, expressed as the proportion of EBW, concomitantly to the development of rumen–reticulum, omasum and LI, which increased with animal age. This is related to the transition from pre-ruminant to ruminant, which occurs during the first weeks of life and is associated with increased intake of solid food (Church, Reference Church1988); this makes the rumen–reticulum, omasum and LI grow slowly in young goats and reach their full development later. Furthermore, regardless of sex, the current results show that growth of the rumen–reticulum stabilized (asymptotic weight) in proportion to EBW at approximately 8 months, indicating that the rumen–reticulum was completely developed.
It was observed in the current study that fermentative organs (i.e. rumen–reticulum and LI) showed a high growth rate at birth and a later inflection point compared to abomasum and SI (g). Younger animals eat more in proportion to BW and their rumen content is greater. Thus, they need thicker rumen and LI tissue to avoid distension, thereby increasing digesta flow (Ortigues and Doreau, Reference Ortigues and Doreau1995). Furthermore, ruminants are born with non-functional forestomachs; when they are stimulated with a solid diet, they face a transition period to becoming a functional ruminant (Church, Reference Church1988). In goat kids, this transition period occurs at 3–4 weeks of age, according to their feeding management, and at around 8 weeks old, the forestomachs reach the weight they will have as adults (Church, Reference Church1988). Amaral et al. (Reference Amaral, Sugohara, Resende, Machado and Cruz2005), evaluating Saanen goats kids weaned at 45 days (week 6) and later slaughtered, showed that the rumen–reticulum weight and papillae size increased with age. The goat kids used in the current study started eating a solid diet around 30 days old and increased their DMI afterwards; milk intake was terminated when they were 60 days old. In the current work, rumen–reticulum and LI presented inflection points at 43 days (week 6) and 55 days (week 7), respectively, and abomasum and SI at 15 days (week 2). Considering that the inflection point indicates the point where the growth rate begins to decrease, rumen–reticulum and LI growth rate begins to decrease later than abomasum and SI, and both are earlier than EBW. These explain why rumen–reticulorumen and LI had numerically greater allometric coefficient than abomasum and SI (Kirton et al., Reference Kirton, Fourie and Jury1972; Galvani et al., Reference Galvani, Pires, Wommer, Oliveira, Kodayssi and Griebler2010). Moreover, because the inflection point for the rumen–reticulum was seen in week 6, it can be said that the animals were becoming functional ruminants around week 6. Thus, if goat kids show effective solid diet intake, they can be weaned at 6 weeks of age without impairing their development. This practice might be combined with appropriate nutritional management, such as supplementing with solid feed earlier.
As a proportion of GIT, the rumen–reticulum, SI and LI at birth accounted for 0.18, 0.72 and 0.17, respectively. Growth stabilization of the rumen–reticulum, SI and LI occurred approximately at 7.5, 4.5 and 7.5 months, when they reached their asymptotic weight in which they represented approximately 0.33, 0.34 and 0.22 of GIT, respectively. The complete development of LI occurred close to that of the rumen–reticulum, and it may be related to the type of digestion performed in these organs. As discussed previously, after the transition period from pre-ruminant to ruminant, the increased solid diet intake by goat kids led to the development of the rumen–reticulum and LI, which are both involved in fibre fermentation.
Similar to the rumen–reticulum, as age increased, the omasum increased its proportion of the GIT, whereas the abomasum decreased its proportion of the GIT. However, they differed among sexes and did not reach growth stabilization. These results illustrate the transition of goats from pre-ruminant to ruminant and the role of each GIT organ in this process. The greatest proportion of the abomasum in the GIT occurs at birth, while the omasum, compared to the forestomach organs, takes more time to develop (Church, Reference Church1988). The current results are in agreement with this; the later omasum growth may be the main reason why a cubic model best fitted the omasum data, in which it was not possible to obtain an asymptotic point, and omasum had the greatest allometric coefficient of the GIT segments (Kirton et al., Reference Kirton, Fourie and Jury1972; Galvani et al., Reference Galvani, Pires, Wommer, Oliveira, Kodayssi and Griebler2010). In addition, abomasum differences among sexes were also reported in studies involving feed restriction in Saanen goats from 30 kg BW (Leite et al., Reference Leite, Krizsan, Figueiredo, Carvalho, Teixeira and Huhtanen2015b). However, there is no clear explanation that can justify such differences among sexes on omasum and abomasum size as the proportion of GIT. Thus, additional studies need to be performed to better address these differences.
In general, the logistic model best described the growth of the visceral organs over time, especially when they are evaluated in gram. Sex did not affect the growth of visceral organs (g) but affected MAT deposition. However, when expressed as g/kg EBW, some organs showed differences between the sexes, such as the liver, abomasum, SI and LI. Overall, females showed greater organ weights (g/kg EBW) than males, which may be related to the greater DMI of females. The rumen–reticulum and LI show higher growth rates in the first 2 months of life. Irrespective of sex, the visceral organs had higher growth rates up to 3 months old. The knowledge of the visceral organ growth curve might be very useful in enhancing the understanding of their impact on energy requirements.
Financial support
The authors are thankful to Sao Paulo Research Foundation (FAPESP, Grant #2014/14734-9) and Coordenação de Aperfeiçoamento de Pessoal de Nível Superior – Brasil (CAPES) – Finance Code 001.
Conflict of interest
Authors declared no conflicts of interest.
Ethical standards
Humane animal care and handling procedures were conducted in accordance with the Animal Care Committee (Comissão de Ética e Bem Estar Animal) of the Sao Paulo State University and with the instructions from the Ministry of Agriculture in Brazil (instruction number 56/2008).
Appendix
Table A1. Summary of statistics related to visceral organs in grams (g) of Saanen goats

Table A2. Comparison to choose the best variance modeling (in bold) of the chosen model to predict visceral organ growth (g, g/kg EBW, or g/kg GIT), and dry matter intake (DMI; g/day/kg EBW) of Saanen goats using Akaike information criterion corrected for small samples (smaller the better)

Table A3. Comparison to choose the best modelled variance (in bold) of an allometric model for predicting the growth of visceral organs in gram (g) per empty body weight (EBW) in kg of Saanen goats using Akaike information criterion corrected for small samples (smaller the better)


