


1. Introduction
Sexually transmitted diseases (STD) are among the most widespread diseases in the world with the highest prevalence in Sub-Saharan Africa. Among numerous types of STD are human immunodeficiency virus (HIV), human papillomavirus (HPV), herpes simplex virus type 2 (HSV-2), syphilis, gonorrhoea, chlamydia, and trichomoniasis.Footnote 2 The STD are caused by various pathogens including viruses, bacteria, fungi and parasites (Mayaud and McCormick, Reference Mayaud and McCormick2001; Yohannes et al., Reference Yohannes, Gelibo and Tarekeg2013; Kenyon et al., Reference Kenyon, Buyze and Colebunders2014; Kakaire et al., Reference Kakaire, Byamugisha, Tumwesigye and Gamzell-Danielsson2015; Newman et al., Reference Newman, Rowley, Hoorn, Wijesooriya, Unemo, Low, Stevens, Gottlieb, Kiarie and Temmerman2015). According to the World Health Organization (WHO), approximately 500 million new STD infections occur annually (WHO, 2012; Kakaire et al., Reference Kakaire, Byamugisha, Tumwesigye and Gamzell-Danielsson2015). A rapid spread of these diseases entails considerable economic and social burdens, which are especially onerous in poorer developing countries.
Untreated STD pose a grave danger to public health and jeopardize human well-being. For example, untreated syphilis accounts for approximately a quarter of neonatal deaths and more than a third of perinatal death in the pregnancy; untreated gonococcal infections result in pelvic inflammatory diseases (PIDs) which could cause female infertility (Newman et al., Reference Newman, Rowley, Hoorn, Wijesooriya, Unemo, Low, Stevens, Gottlieb, Kiarie and Temmerman2015); untreated maternal gonococcal infections can cause blindness in new-born babies (Isenberg et al., Reference Isenberg, Apt and Wood1996). Among viral STD, HIV infection remains a major global health threat particularly in African countries. The Joint United Nations Programme on HIV/AIDS (UNAIDS) has reported that around 0.5% of the world population of young women and 0.3% of the world population of young men aged 15−24 years are living with the HIV. Moreover, among the world regions, HIV prevalence is the highest in Sub-Saharan Africa: approximately 2.5% of young women and 1.2% of young men in this region are living with the HIV (WHO, 2007; UNAIDS, 2013).
Due to close linkages between HIV infection and other STD, effective STD prevention and control programs could lead to a decrease in the HIV incidence (WHO, 2007). This is because STD can be a cofactor in the transmission of HIV and, in a reverse causal order, HIV incidence may raise STD occurrence through viral agents, such as the HSV-2 which is a leading cause of the genital ulcer disease (Mayaud & Mabey, Reference Mayaud and Mabey2004; Barnabas and Celum, Reference Barnabas and Celum2012; Johnston et al., Reference Johnston, Zhu, Jing, Laing, McClurkan, Klock, Diem, Jin, Stanaway, Tronstein, Kwok, Huang, Selke, Fong, Magaret, Koelle, Wald and Corey2014). An analysis of data on Tanzania pointed to a strong association between HSV-2 infection and HIV incidence in this country and led to a conclusion that the HSV-2 was instrumental to the transmission of the HIV infection (del Mar Pujades Rodríguez et al., Reference del Mar Pujades Rodríguez, Obasi, Mosha, Todd, Brown, Changalucha, Mabey, Ross, Grosskurth and Hayes2002). Based on these findings, the research team recommended that effective STD control and prevention programs be implemented in order to reduce the HIV incidence. Studies conducted in Uganda and Zimbabwe (Brown et al., Reference Brown, Wald, Hubbard, Rungruengthanakit, Chipato, Rugpao, Mmiro, Celentano, Salata, Morrison, Richardson and Padian2007; Tobiana et al., Reference Tobiana, Ssempijja, Kigozi, Oliver, Serwadda, Makumbi, Nalugoda, Iga, Reynolds, Wawer, Quinn and Gray2009) supported these results: a strong correlation was detected between the HIV incidence and HSV−2 infection in these two countries. A more recent study conducted in Ethiopia reported that independent predictors of HSV-2 included the history of STD infections; it was also found that the incidence of HSV-2 was more than two times higher in women who were infected with STD (Anjulo et al., Reference Anjulo, Abebe, Hailemichael and Mihret2016).
To reflect the importance and urgency of the problem, two of the seven millennium development goals (MDGs) pertained to STD prevention and control. Thus, the sixth MDG sought to combat the spread of HIV/AIDS epidemics. A proper treatment of STD was considered as one of the means to achieve this goal. The fifth MDG aimed to reduce maternal mortality; the prevention of pelvic inflammatory diseases could contribute to achieving this goal by reducing maternal deaths caused by ectopic pregnancy (WHO, 2007; United Nations, 2016). In 2015, the Sustainable Development Goals (SDGs) replaced the MDGs. Although the efforts to fulfil the MDGs have produced encouraging results as far as the poverty reduction is concerned, the global fight against STD continues. Specifically, HIV, which is one of the most prevalent and concern-causing STDs, remains a priority target in the SDGs. Thus, Goal 3 titled ‘Good Health and Well-being’ sets the target to ‘end the epidemics of AIDS, tuberculosis, malaria and neglected tropical diseases and combat hepatitis, water-borne diseases and other communicable diseases’ (target 3.3). It also aims to ‘ensure universal access to sexual and reproductive health-care services, including for family planning, information and education, and the integration of reproductive health into national strategies and programmes’ by 2030 (target 3.7) (UNDP, 2018).
Moreover, the WHO initiated its own global strategy to control and prevent STD, which is known as the ‘Global Strategy for the Prevention and Control of Sexually Transmitted Infections (2006–2015)’.Footnote 3 Among the main objectives of this initiative was to promote the mobilisation of global health funds by re-assessing the effectiveness of the global health aid and by reallocating human and physical resources (WHO, 2007). As a share of the global health aid, the global financing to prevent and control HIV/AIDS and other STD has experienced the fastest growth compared to other key health sectors. However, the funding still falls short of the estimated level needed to effectively combat the HIV epidemic (UNAIDS, 2005; Kates et al., Reference Kates, Morrison and Lief2006; Ravishankar et al., Reference Ravishankar, Gubbins, Cooley, Leach-Kemon, Michaud, Jamison and Murray2009; Esser and Bench, Reference Esser and Bench2011; Yamey et al., Reference Yamey, Sundewall, Saxenian, Hecht, Jordan, Schäferhoff, Schrade, Deleye, Thomas, Blanchet, Summers and Jamison2016). Currently, the WHO has set a new global health sector strategy on Sexually Transmitted Infections (2016–2021) (WHO, 2018). The objectives pursued by the SDGs and the WHO are highly ambitious and achieving them would require concerted efforts. The development sector recognises the need for better strategies, including the planning and distribution of financial aid, to realize these goals. Understanding the development assistance allocation for the STD control would help the decision makers during the allocation of often scarce resources.Footnote 4
The development assistance for health (DAH) experienced a rapid increase from US$5 billion in 1990 to US$22 billion in 2007 (Ravishankar et al., Reference Ravishankar, Gubbins, Cooley, Leach-Kemon, Michaud, Jamison and Murray2009). In 2013, the amount of DAH reached US$31.3 billion (Graves et al., Reference Graves, Haakenstad and Dieleman2015). Thus, the total value of the DAH for the period of 1990–2015 amounted to approximately US$500 billion. The annual disbursement of the DAH increased from US$11 billion in 2000 to US$36 billion in 2015 (Dieleman et al., Reference Dieleman, Schneider, Haakenstad, Singh, Sadat, Birger, Reynolds, Templin, Hamavid, Chapin and Murray2016). Despite its importance for implementing various global health programs, there is a lack of systematic empirical research on the DAH allocations. Thus far, only four major empirical studies on this topic are available. They were done by Ravishankar et al. (Reference Ravishankar, Gubbins, Cooley, Leach-Kemon, Michaud, Jamison and Murray2009), Esser and Bench (Reference Esser and Bench2011), Fielding (Reference Fielding2011) and Lee and Lim (Reference Lee and Lim2014). Among the notable findings, Ravishankar et al. (Reference Ravishankar, Gubbins, Cooley, Leach-Kemon, Michaud, Jamison and Murray2009) reported that the total amount of the DAH for HIV/AIDS control increased from US$0.2 billion in 1990 to US$5.6 billion in 2007. This health aid was mainly distributed by the US government and by the Global Fund to Fight AIDS, Tuberculosis and Malaria (GFATM). The research team also found out that the correlation coefficient between the health aid and disease burden increased from 0.6 to 0.8 over the period of 1997–2007.
In another study, Esser and Bench (Reference Esser and Bench2011) discovered that the Pearson correlation coefficient between the DAH allocations and disease burden increased from 0.015 in 2005 to 0.126 in 2006; however, it dropped to 0.084 in 2007. Based on these findings the researchers concluded that the disease burden was not a factor that had a significant association with the DAH allocations. Fielding (Reference Fielding2011) pointed out that the DAH had a low fungibility. In other words, it is not easy to use the DAH allocations for non-health purposes. The researcher also noted that neither HIV prevalence nor income level had a statistically significant relationship with the DAH allocations. A study by Lee and Lim (Reference Lee and Lim2014) reported that the global health aid soared from US$5 billion in 1995 to US$20 billion in 2011. They also discovered that income level and HIV prevalence had a statistically significant relationship with the health aid allocations.
To the best of our knowledge, no systematic empirical analysis has been carried out specifically on the DAH allocations for STD control. The current study aims to fill this research gap. It seeks to identify factors that had a statistically significant association with the DAH allocations for STD control in 54 African countries between the years 2002 and 2011. Africa was chosen for this study because the continent has the highest STD prevalence rate in the world. Within the stated timespan, three years – 2002, 2006, and 2011 – were selected for the empirical analysis. The justification for the choice of these three points in time is as follows: the year 2002 is the earliest available time point in the African Development Indicators (ADI) dataset; the year 2006 marks the commencement of the WHO global initiative for STD control and prevention; the year 2011 is the latest time point in the dataset (World Bank, 2017).
2. Data and methods
This study proposes that four possible factors could have a statistically significant association with the DAH allocation for STD control in Africa. These four factors are the STD incidence, the income level, the health expenditure, and the life expectancy. The source of data on aid allocation and the four possible factors, except for the STD incidence, was the African Development Indicators (ADI) (World Bank, 2017). The data on the STD incidence were obtained from the Institute for Health Metrics and Evaluation (IHME, 2018). In the current study, the DAH allocations for STD control in Africa is hypothesised as having a statistically significant association with the following four factors:
 $$ODA = f\lpar {STD^ +, \; \,\,GDP^-,\; \,\,HE^-,\,\,LE^-} \rpar $$
where ODA is the DAH disbursement for STD control including aid for HIV/AIDS (in current US dollars), STD is the STD incidence (in thousand), GDP is the Gross Domestic Product per capita (in current US dollars), HE is the health expenditure (in current US dollars) and LE is life expectancy at birth (in years). In the ADI database, the ODA is codified as DT.ODA.ALLD.HIV.CNTRL.CD, the GDP is codified as NY.GDP.PCAP.CD, the HE is codified as SH.XPD.TOTL.CD, and the LE is codified as SP.DYN.LE00.IN. Furthermore, the STD variable combined data on STD and HIV/AIDS with codes 392 (all STD excluding HIV) and 296 (HIV/AIDS), respectively, in the IHME database. This decision to use the combined data reflects the conditions included in the development assistance for STD control.Footnote 5Table 1 provides a full description of all variables.
Table 1. Full description of all variables

In this study, the incidence rather than the prevalence was used for the empirical analysis. Main reasons for this choice are as follows: firstly, the actual number of incidence would have a higher variance compared to the prevalence. The higher variance enables a better measurement. Secondly, the dependent variable is the actual sum of the ODA allocation, rather than its percentage share in the national income or government budget.
In the DAH allocation model in equation (1), the association between the DAH allocations for STD control and STD incidence is expected to be positive. This is because African countries with a higher STD incidence would need larger amounts of the DAH. At the same time, the association between the DAH allocation and GDP per capita is hypothesized to be negative. This is because African countries with a relatively high level of material wellbeing measured by GDP per capita would need less of the DAH for STD control. Next, the association between the DAH allocation and health expenditure is expected to be negative because African countries with a relatively high level of medical services measured by the volume of health expenditure would require less of the DAH. Finally, the association between the DAH allocation and life expectancy is hypothesized to be negative because African countries with a relatively high level of physical wellbeing measured by life expectancy would need less of the health aid allocations.
For the purpose of the data analysis, the EViews 8 for Windows software (IHS Global Inc., USA) was employed to perform the descriptive statistics analysis and the Pearson correlation analysis. The IBM SPSS Statistics Version 22 (IBM Corp., USA) aided in the implementation of the matrix scatter plot analysis.
3. Empirical results
Table 2 reports the findings from the descriptive statistics analysis. As can be seen from the table, there was a rapid expansion in the volume of health aid for STD control and prevention given to African countries. Thus, in 2002, the average amount of this type of health aid was only US$4.7 million. In 2006, it increased by more than seven-fold to US$34.4 million and reached US$80.62 million in 2011. Tanzania was the largest recipient of the health aid for STD control and prevention (US$26.7 million) in the year 2002. In the same year, the amount of the STD aid received by Mauritius was negative (minus US$1000) (World Bank, 2017).Footnote 6
Table 2. Findings from descriptive statistics analysis

In 2006, Nigeria became the largest recipient of the health aid for STD control and prevention (US$175.7 million) while Tunisia received the smallest amount (US$8 thousand). In 2011, the largest share of the health aid for STD control was given to South Africa (US$587.0 million) and Libya was allocated the smallest amount of the aid (US$50 thousand). It should be noted that the standard deviation of the DAH for STD control and prevention in Africa was 6.52 million in 2002. It increased by more than seven-fold to 50.38 million in 2006, before reaching 136.65 million in 2011. This statistic indicates that the increase in the amount of health aid for STD control and prevention resulted in a wider dispersion of the DAH aid.
In the following four subsections, we will connect the country-specific data for the 54 African countries with the four key indicators: the STD incidence, the income level, the health expenditures, and the life expectancy at birth.
3.1 Key indicator 1: the STD incidence
As can be seen from Table 2, there was an upward trend in the STD incidence in Africa. The average value of STD incidence increased from 2.1 million in 2002 to 2.3 million in 2006, and to 2.6 million in 2011. In 2002, African countries with the highest STD incidence (exceeding 5 million cases) were the Democratic Republic of the Congo, Egypt, Ethiopia, Nigeria, South Africa, and Tanzania. The countries with the lowest STD incidence (less than 100 thousand cases) were Equatorial Guinea, Mauritius, Cape Verde, São Tomé and Príncipe, and Seychelles. In 2006, this list remained largely unchanged, except that the STD incidence in Kenya increased from 4.8 million in 2002 to 5.2 million in 2006, which exceeded the 5 million threshold. In 2011, the list of countries with the highest and the lowest STD incidence was the same as in 2006, except that the STD incidence in Equatorial Guinea increased from 95.4 thousand to 111.8 thousand, which exceeded the 100 thousand cases threshold. Standard deviation of the STD incidence in African countries increased from 3.0 million in 2002 to 3.3 million in 2006, and to 3.7 million in 2011. This indicates an increase in the dispersion of the STD incidence among the 54 African countries.
3.2 Key indicator 2: the income level
As Table 2 shows, the average value of the per capita income in African countries had experienced a steady increase: it amounted to US$1040.6 in 2002, before increasing by 90% to US$1994.6 in 2006 and reaching US$2977.2 in 2011. In 2002, the three African countries with the highest per capita income (exceeding US$3500) were the Seychelles, Mauritius, and Equatorial Guinea. In the same year, the three African countries with the lowest per capita income (below US$150) were the Democratic Republic of Congo, Ethiopia, and Burundi. In 2006, Mauritius was replaced by Libya among the three highest income countries while Ethiopia was replaced by Liberia in the list of the three lowest income countries. In 2011, the three highest and the three lowest income countries in Africa were the same as those in 2002. Standard deviation of the income per capita in African countries amounted to 1495.6 in 2002, it increased by more than two-fold to 3087.3 in 2006 and reached 4557.5 in 2011. This statistic suggests that the income gap among African countries widened during the period of 2002–2011.
3.3 Key indicator 3: the health expenditure
Another important finding was that the average value of the health expenditure in 54 African countries amounted to US$619.5 million in 2002, it increased by slightly more than two-fold to US$1270.2 million in 2006. By 2011, it almost doubled and reached US$2215.9 million. In 2002, Morocco, Algeria, Nigeria, Egypt, and South Africa had the largest health expenditure in Africa (exceeding US$20 billion). Countries with the smallest health expenditure (less than US$10 million) were Comoros and São Tomé and Príncipe. In 2006, the list of countries with the largest and the smallest health expenditures remained the same as in 2002. However, Comoros experienced a steep rise in the health expenditure from US$8.8 million in 2002 to US$19.0 million. In 2011, the list of African countries with the largest and the smallest health expenditure remained unchanged. Over the observation period, the standard deviation of the health expenditure in African countries was 1538.7 in 2002, it increased by more than two-fold to 3360 in 2006, and reached 5348.1 in 2011. This indicates an increase in the dispersion of the health expenditure.
3.4 Key indicator 4: the life expectancy
The findings suggest a steady improvement in the physical wellbeing in African countries. Thus, the life expectancy at birth increased slightly from 54.1 years in 2002 to 55.6 years in 2006 and reached 57.8 years in 2011. In 2002, the life expectancy in seven African countries – Egypt, Cape Verde, Algeria, Mauritius, the Seychelles, Libya, and Tunisia – exceeded 70 years. The countries with the lowest life expectancy (less than 45 years) were Sierra Leone, Zambia, Zimbabwe, and the Central African Republic. In 2006, these lists remained largely unchanged except that there had occurred some changes in the life expectancy statistic. Thus, among the countries with the lowest life expectancy, the life expectancy in Sierra Leone increased slightly from 41.8 years in 2002 to 45.0 years in 2006. In Zambia, the life expectancy increased slightly from 42.3 years in 2002 to 45.2 years in 2006. Among the countries with the highest life expectancy, the life expectancy in Morocco increased marginally from 69.4 years in 2002 to 70.7 years in 2006.
In 2011, the lists of African countries with the highest and the lowest life expectancy remained unchanged. However, some positive trends could be observed. Thus, among the countries with the lowest life expectancy, the life expectancy in the Central African Republic increased moderately from 44.8 years in 2006 to 48.3 years in 2011, while the life expectancy in Lesotho increased slightly from 44.5 years in 2006 to 47.9 in 2011. Also, the standard deviation of life expectancy decreased slightly from 8.8 in 2002 to 8.6 in 2006 and further diminished to 8.1 in 2011. This indicates that the dispersion in the life expectancy among African countries had narrowed down slightly.
3.5 Findings from the scatter plot analysis
In the next stage of the empirical analysis, the scatter plot analysis visualized the associations between the DAH allocations for STD control and the four key indicators. Figure 1 depicts the associations for all possible combinations between the five variables in this study, namely, ODA, GDP, STD, HE, and LE, in the years 2002, 2006, and 2011. As can be seen from this figure, four relatively strong associations between the variables were detected, namely, the ODA–STD nexus, the ODA–LE nexus, the GDP–LE nexus, and the STD–HE nexus.

Figure 1. Patterns of DAH allocation for STD control in Africa (2002).
To interpret these results, a clear positive association between ODA and STD indicates that African countries with a higher STD incidence tended to receive greater amounts of the health aid for STD control and prevention. The exception to this tendency was two outlier countries – Algeria and Morocco – where a relatively high STD incidence was accompanied by a relatively small size of the STD aid. Next, a visible negative association between ODA and LE implies that African countries with a higher life expectancy tended to receive smaller amounts of the health aid. This was the case for most of the countries, except for Sierra Leone, the Central African Republic, and Mali, where a relatively lower life expectancy was accompanied by smaller amounts of the health aid. Regarding a noticeable positive association between GDP and LE, this finding suggests that African countries with a higher life expectancy tended to be higher income countries, except for two outliers, namely, Equatorial Guinea and Botswana. In these two countries, a relatively low life expectancy was accompanied by a relatively high-income level. Finally, a clearly visible positive association between STD and HE implies that African countries with a higher STD incidence tended to have a higher health expenditure, except for Ethiopia and the Democratic Republic of the Congo. In these two outlier countries, a higher STD incidence was accompanied by a relatively small health expenditure.
Figure 2 offers a graphical representation of the patterns of the DAH allocations for STD control in Africa in the year 2006. A visual inspection and a comparison of Figure 2 and Figure 1 reveal that the patterns of the associations between the variables remained, overall, unchanged. The only difference was that the positive association between ODA and HE became stronger. This means that African countries with a higher level of health expenditure tended to receive greater amounts of the health aid to control and prevent STD.

Figure 2. Patterns of DAH allocation for STD control in Africa (2006).
Figure 3 depicts the patterns of associations between the variables for the year 2011. The matrix scatter plot analysis detected only three relatively strong positive associations, namely, the ODA–STD nexus, the ODA–HE nexus, and the STD–HE nexus. This finding suggests that African countries with a higher STD incidence tended to receive larger amounts of the health aid for STD control and prevention. Furthermore, countries with a higher health expenditure tended to receive larger volumes of the health aid. Also, the health expenditure was found to be larger in the countries with a higher STD incidence.
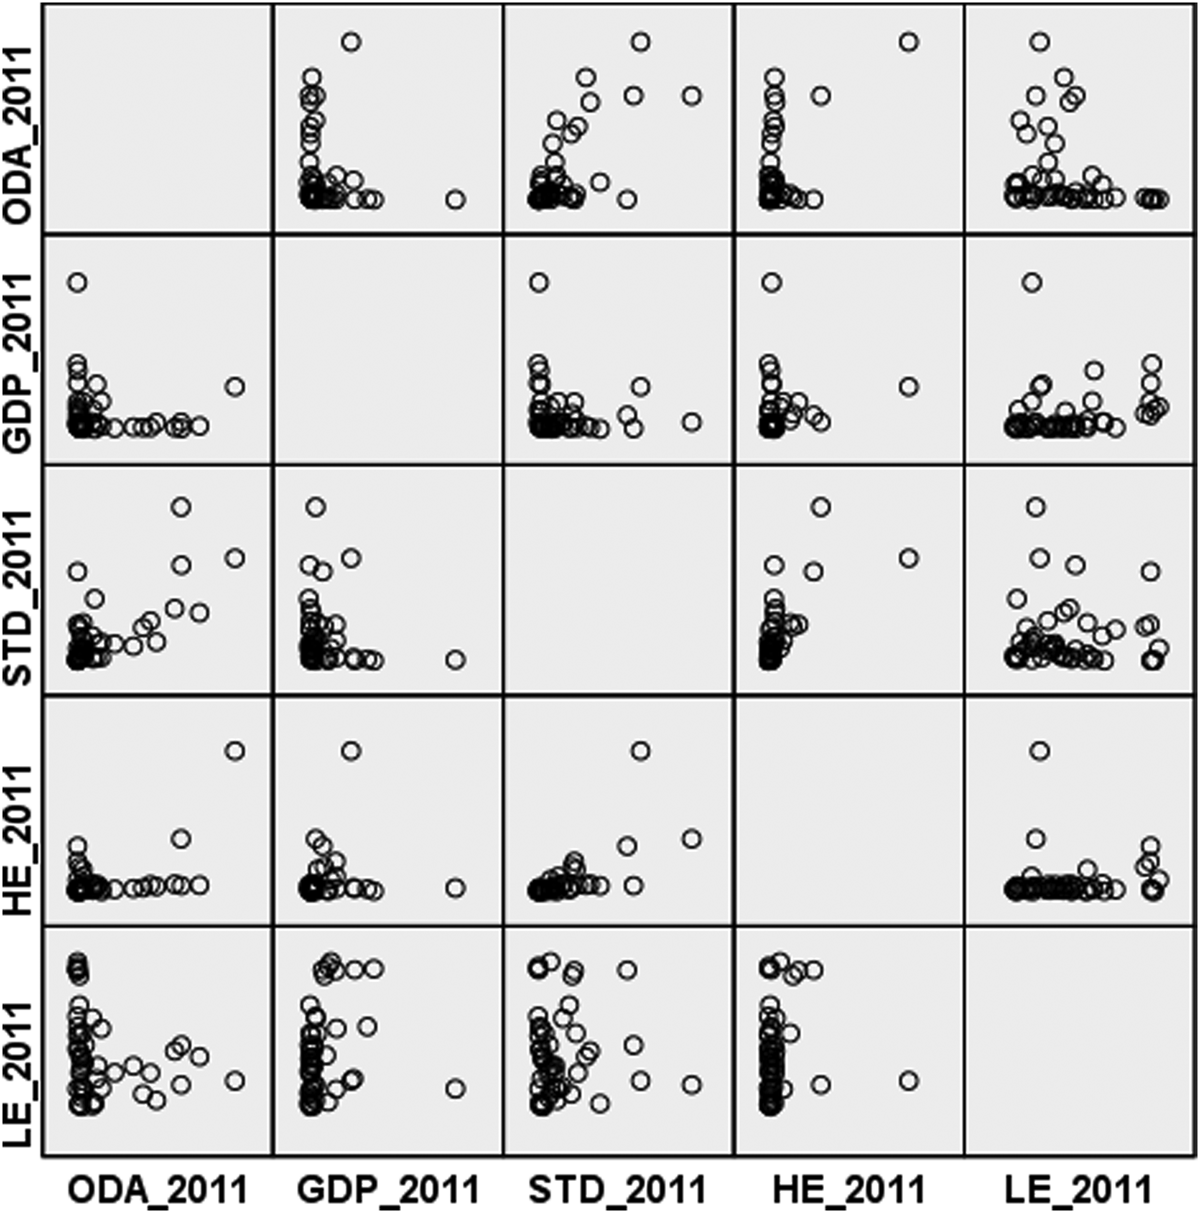
Figure 3. Patterns of DAH allocation for STD control in Africa (2011).
3.6 Findings from the correlation analysis
In the final stage of the analysis, the Pearson correlation test examined a statistical significance of the associations between the DAH allocations for STD control in Africa and the four key indicators. As Table 3 shows, in the year 2002, there was a significant positive association between ODA and STD and a significant negative association between ODA and LE. The Pearson correlation analysis also detected the presence of a non-significant negative association between ODA and GDP and a non-significant positive association between ODA and HE. This finding implies that African countries with a higher STD incidence tended to receive larger amounts of ODA and African countries with higher life expectancy tended to receive a lower amount of ODA.
Table 3. Findings from correlation analysis

Notes: * indicates statistical significance at the 5% percent level; ** indicates statistical significance at the 1% level
It was also found that the STD incidence and the health expenditure had no statistically significant relationship with the income level. As to the other three variables – STD, HE, and LE – the analysis detected a significant positive association between STD and HE.
For the year 2006, the Pearson correlation analysis detected a statistically significant positive association between ODA and STD, a statistically significant positive association between ODA and HE, and a statistically significant negative association between ODA and LE. No statistically significant associations were found to exist between ODA and GDP. Furthermore, the correlation analysis detected a statistically significant positive association between GDP and LE, a non-statistically significant negative association between GDP and STD and a non-significant positive association between GDP and HE. These results indicate that African countries with higher income levels tended to have a higher life expectancy compared to the countries with lower income levels. Furthermore, the Pearson correlation analysis detected a significant positive association between STD and HE. This finding implies that African countries with a higher STD incidence tended to have a higher health expenditure.
The findings from the correlation analysis for the year 2011 indicated that among the four variables, STD and HE had a statistically significant positive association with ODA while the remaining two variables – GDP and LE – had no statistically significant relationship with ODA. These results suggest that the STD incidence and the health expenditure were important factors: they had statistically significant positive associations with the DAH allocations for STD control and prevention. At the same time, the income level and the life expectancy did not have statistically significant associations with the health aid allocation.
As the findings reveal, among the four key indicators only the STD incidence was found to have a consistent and statistically significant positive association with the allocations of the health aid. This finding supports the results obtained by Lee and Lim (Reference Lee and Lim2014) but contradicts the findings reported by Fielding (Reference Fielding2011). These discrepancies could be due to the differences in the data sets employed by the studies: Fielding's (Reference Fielding2011) data set covered a shorter period of 1995–2006, while Lee and Lim (Reference Lee and Lim2014) used a longer data set from 1995 to 2014. The current study's finding that there was a statistically significant positive relationship between ODA and STD suggests that African countries with a higher STD incidence received larger amounts of health aid for STD control and prevention. This is a very encouraging trend. However, the findings also indicate that this positive trend was weaker in the case of the minor DAH recipient countries. As Figure 4 shows, in 2011, the positive association between ODA and STD was hardly in evidence in relatively minor DAH recipients where the STD aid amounted to less than US$20 million.

Figure 4. The ODA–STD relationship in minor aid recipient countries in 2011.
Furthermore, among the four key indicators, only the income level was constantly found to have no statistically significant relationship with the health aid allocation. This finding does not support the results reported in earlier studies by Fielding (Reference Fielding2011) and Lee and Lim (Reference Lee and Lim2014). Fielding (Reference Fielding2011) found a non-significant positive relationship between ODA and GDP, while Lee and Lim (Reference Lee and Lim2014) discovered a significant positive association between these two variables. In contrast, in the current study, the relationship between the DAH for STD control and the income level was found to be non-significant and negative. These discrepancies could be due to the differences in the scope of the present and the previous studies. The earlier investigations examined allocations of the global health aid as a whole, whereas the current study specifically focused on the DAH for STD control and prevention given to African countries.
4. Discussion
The findings from the empirical analyses conducted in this study can be summarised into two main points. First of all, the descriptive statistics indicated that over the period of 2002–2011 there had occurred a rapid increase in the volume of health aid given to African countries to prevent and control STD. This finding is consistent with the results reported in the earlier studies that observed a rapid increase in the volume of the global health aid (Ravishankar et al., Reference Ravishankar, Gubbins, Cooley, Leach-Kemon, Michaud, Jamison and Murray2009; Lee and Lim, Reference Lee and Lim2014). At the same time, the present study detected an increase in the standard deviation for the health aid provision. This suggests a wider dispersion in the allocation of the health aid funds. In itself, the increase in the volume of health aid given to African countries for STD control and prevention is a very positive development. However, the wider dispersion in the allocation of the DAH funds to control STD indicates a widening gap in the disbursement of the health aid. This is an undesirable trend because it indicates an unequal distribution of the health aid.
In order to examine in more detail this alarming increase in the dispersion of the DAH, the STD aid given to each of the 54 African countries was scrutinised. To do this, the countries were divided into five groups according to their per capita income level (as of 2011). The first income group included the countries with per capita income between US$231 and US$489; the second income group comprised the countries with per capita income between US$495 and US$757; the third income group consisted of the countries with per capita income between US$801 and US$1425; the fourth income group included the countries with per capita income between US$1473 and US$4350; and the fifth income group consisted of the countries with per capita income between US$5244 and US$27,477.
The findings are as follows. Figure 5 depicts the allocations of the aid among the first group of African countries, which consisted of 11 nations with the per capita income greater than US$231 but less than US$489. In 2011, these countries received US$955 million as the DAH. As can be seen from the figure, Ethiopia, Uganda, and Malawi were the three dominant recipients of the DAH. The combined amount of the DAH given to these three countries was US$800 million or 83% of the total DAH allocation to this group.

Figure 5. Development assistance for health (DAH) in Africa (in US$ million): Group I (countries with per capita income between US$231 and US$489).
Figure 6 shows the DAH allocations to the second group of African countries where the per capita income was between US$495 and US$757. Among the 11 countries included in this group, Tanzania, Mozambique, and Rwanda were the three dominant recipients of the DAH. Their combined value of the DAH amounted to US$816 million or 82% of the total DAH allocation to this group.

Figure 6. Development assistance for health (DAH) in Africa (in US$ million): Group II (countries with per capita income between US$495 and US$757).
The third group of countries included 11 African nations where the per capita income was greater than US$801 but less than US$1425 (see Figure 7). In this group, Kenya and Zambia were the top two recipients of the DAH. They received US$750 million or 76% of the DAH allocation.

Figure 7. Development assistance for health (DAH) in Africa (in US$ million): Group III (countries with per capita income between US$801 and US$1425).
The fourth group consisted of 11 African countries where the per capita income was greater than US$1473 but less than US$4350 (see Figure 8). In this group, Nigeria was the dominant recipient of the DAH for STD control and prevention with a total of US$386 million or 67% of the DAH allocation.

Figure 8. Development assistance for health (DAH) in Africa (in US$ million): Group IV (countries with per capita income between US$1473 and US$4350).
In the fifth group consisting of 10 African countries with the per capita income greater than US$5244 but less than US$27,477, South Africa was the dominant aid recipient (see Figure 9). The amount of the DAH given to South Africa was US$587 million or 75% of the total DAH allocation to this group.

Figure 9. Development assistance for health (DAH) in Africa (in US$ million): Group V (countries with per capita income between US$5244 and US$27,477).
Another notable finding was that the health expenditure and life expectancy were the key development indicators that did not have a consistent statistically significant association with the health aid allocations. For example, the health expenditure was a statistically significant factor only in the years 2006 and 2011, while the life expectancy was found to be a statistically significant factor only in the years 2002 and 2006. The volume of health expenditure in a country can be considered as an indicator of the level of medical services; the life expectancy at birth can be used to measure the level of physical wellbeing. It should be noted that none of the previous studies included these two variables in the analysis, which prevents us from making comparisons between the current study's findings and the available literature.
The findings of the current study suggest that in 2011 the level of physical wellbeing ceased to be a factor that had a significant association with the DAH allocated for STD control and prevention in Africa. Instead, since 2006, the level of medical services emerged as such a factor. This suggests that the providers of the health aid have begun to give a greater consideration to the level of medical services in African countries rather than to the level of physical wellbeing when making the decisions regarding the STD aid allocation. On the other hand, it is also possible that the presence of several outliers among the African countries could be an explanation as to why no significant relationship was found between the health expenditure and the life expectancy. As Figure 10 and Figure 11 show, in 2002, there was a positive association between ODA and HE in the countries where the health expenditure was relatively small (less than US$600 million).

Figure 10. The ODA–HE relationship in African countries with a lower health expenditure in 2002.

Figure 11. The ODA–LE relationship in relatively minor aid recipients in Africa in 2011.
5. Conclusions
This study has examined the DAH allocations for STD control in Africa between 2002 and 2011. For this purpose, it employed descriptive statistics analysis, the scatter plot analysis, and the Pearson correlation test. It was assumed that four key development indicators, namely, the STD incidence, the income level, the health expenditure, and the life expectancy at birth would have statistically significant associations with the DAH allocations. An important finding from the descriptive statistics analysis was that the global concerted efforts had resulted in a considerable increase in the disbursement of the health aid to control and prevent STD in Africa. At the same time, the findings indicated a widening gap between the major and the minor aid recipient countries in Africa in terms of the funds disbursement.
As to the inferential statistical analysis, the most notable finding was the existence of a statistically significant positive association between the STD incidence and the health aid allocations. This means that African countries with a higher STD incidence tended to receive larger volumes of the health aid. This study also found that while the providers of DAH tended to disburse larger volumes of the health aid to African countries with a higher STD incidence, there were no statistically significant associations between the aid allocations and STD incidence in the relatively minor recipients of the health aid. This is a worrying trend.
Overall, our findings agree with the results reported in the earlier empirical analyses on the global health financing (i.e., Fielding, Reference Fielding2011; Lee and Lim, Reference Lee and Lim2014). Unlike the earlier studies, the current investigation has included the health expenditure and the life expectancy among the variables. Both indicators were found to have a statistically significant association with the STD aid allocations, though not at each of the three points in time. It should be noted that in 2011, the level of physical wellbeing (measured by the life expectancy) ceased to be a factor that had a statistically significant association with the allocations of DAH for STD control and prevention in Africa. It was replaced by the level of medical services (measured by the health expenditure).
Two notable policy implications and recommendations can be drawn from these findings. First of all, policy makers and providers of the DAH need to be aware that a rapid expansion of the volume of health aid given to control and prevent STD in Africa has been accompanied by a stark imbalance in the volume of funds allocated to individual countries. For example, in 2011, a major aid recipient country, Uganda, where the STD incidence was 4.7 million and the per capita income was US$497, received US$272.6 million in the STD aid. In contrast, a minor aid recipient, Madagascar, where the STD incidence was 3.8 million and the per capita income was US$465, received only US$8.6 million in the health aid. Health aid providers and decision makers need to introduce some policy adjustments aimed at reducing the gaps in the provision of the health aid to individual African countries.
Secondly, policy makers and health aid providers may want to be aware that some of the African countries with a relatively high STD incidence were allocated smaller amounts of the DAH to control and prevent STD. For example, the Democratic Republic of the Congo, where the STD incidence was 7.6 million, received only US$64.8 million in the STD aid in 2011. In a similar vein, Ghana, with the STD incidence of 3.0 million, received US$56.5 million in the health aid. These facts highlight the need for further efforts to ensure that minor aid recipient countries with a relatively high STD incidence be allocated commensurate amounts of the STD aid.
The current study has some limitations. The main limitation is a lack of the recent data. The ADI dataset covers only the period of 2002–2011. Future studies may want to seek longer datasets. Regarding the methodology, this study performed the Pearson correlation analysis to examine a statistical significance of the associations between the DAH allocations and the four key development indicators. Future studies may want to employ more advanced statistical methods, such as the multiple regression analysis, the ANOVA test or the t-test, which might provide additional and much needed insights into the role of health aid in the global efforts to prevent and control STD in Africa and beyond.
Conflict of interest
None of the authors have any competing interests.


