Introduction
Zeugodacus cucurbitae (Coquillett, 1899) (Diptera: Tephritidae), the melon fly (formerly named Bactrocera cucurbitae; see (Virgilio et al., Reference Virgilio, Jordaens, Verwimp, White and De Meyer2015; San Jose et al., Reference San Jose, Doorenweerd, Leblanc, Barr, Geib and Rubinoff2017)), is a polyphagous agricultural pest predominantly attacking a wide range of Cucurbitaceae but also other plant families. This species, native to Central Asia (Drew & Hancock, Reference Drew, Hancock and Aluja2000) allegedly spread throughout the 20th century to other regions successfully establishing into Central and East Asia, Africa, Oceania, Hawaii and the Islands of the Indian Ocean (White & Elson-Harris, Reference White and Elson-Harris1992). As most tephritid pests, the melon fly Z. cucurbitae causes important economic losses for farmers and traders and reduces the availability of essential dietary components to local populations (Mwatawala et al., Reference Mwatawala, De Meyer, Makundi and Maerere2009; Sood et al., Reference Sood, Prabhakar, Yadav and Thakur2016). Z. cucurbitae attacks more than 80 plant species including commercial crops such as pumpkin, cantaloupe, watermelon, squash, gourd and cucumber but also non-cucurbit plants such as tomato, eggplant and soft fruits such as mango, orange, papaya and peach (White & Elson-Harris, Reference White and Elson-Harris1992). Significant differences in the dietary preferences of Z. cucurbitae have been described among populations from different geographic regions (Vayssières et al., Reference Vayssières, Rey and Traoré2007; De Meyer et al., Reference De Meyer, Delatte, Mwatawala, Quilici, Vayssières and Virgilio2015).
The colonization history of this pest has been reconstructed mainly based on historical records that are often sparse and sometimes ambiguous. In Africa, the species was first recorded in the East in Tanzania and Kenya in 1936 and 1937, respectively (http://www.gbif.org// (De Meyer et al., Reference De Meyer, Delatte, Mwatawala, Quilici, Vayssières and Virgilio2015)). Whether these dates are representative of the genuine arrival of Z. cucurbitae on the African continent or not is however still a matter of debate. The important historical links between the eastern coast of Africa (dominated by the so-called Swahili culture) and the Near East and Indian subcontinent from as early as 100 AD (Gilbert, Reference Gilbert2004), and the genetic diversity found in a previous population worldwide analysis of this pest have led some authors to suspect that the pest could have been present in the continent for a much longer time (Virgilio et al., Reference Virgilio, Delatte, Backeljau and De Meyer2010; De Meyer et al., Reference De Meyer, Delatte, Mwatawala, Quilici, Vayssières and Virgilio2015). Z. cucurbitae has not been recorded in West Africa before 1999 (http://www.africamuseum.be/fruitfly/AfroAsia.htm), when it was found in the Gambia and Ivory Coast (De Meyer et al., Reference De Meyer, Delatte, Mwatawala, Quilici, Vayssières and Virgilio2015). Over the last decade it has been recognized as a common agricultural pest in a number of other West African countries including Benin, Burkina Faso, Ghana, Guinea, Mali, Senegal and Togo (Vayssières et al., Reference Vayssières, Rey and Traoré2007; Vayssières et al., Reference Vayssières, Carel, Coubes and Duyck2008). In 2006, Z. cucurbitae was recorded in the Democratic Republic of Congo (Congo DR) as well as several other countries of eastern Africa, including Sudan (2006), Uganda (2009), Ethiopia (2010), Malawi (2010) and Mozambique (2013) (De Meyer et al., Reference De Meyer, Delatte, Mwatawala, Quilici, Vayssières and Virgilio2015).
Several studies using molecular markers have looked at different scales the genetic diversity and structuring patterns of this species in different countries. In a previous study (Virgilio et al., Reference Virgilio, Delatte, Backeljau and De Meyer2010), a first attempt to unravel the worldwide population genetic structure of Z. cucurbitae has shown that populations sampled were split into five main population groups distributed over the African continent, Central Asia, East Asia, Hawaii and La Réunion, respectively. Another study, deciphering the genetic differentiation between African and non-African populations demonstrated a common ancestry of the African Z. cucurbitae and suggested that the invasive populations of the Indian Ocean islands (La Réunion, Mauritius, Seychelles) were a result of recent an introduction from Africa (Jacquard et al., Reference Jacquard, Virgilio, David, Quilici, De Meyer and Delatte2013). Then, two recent studies investigated the fine genetic structure with an integrative approach combining neutral nuclear markers, mitochondrial cytochrome oxidase I gene sequencing and morphometric measurements, of several populations in Southeast Asia considered as native vs. invaded areas in the West Pacific (Boontop et al., Reference Boontop, Schutze, Clarke, Cameron and Krosch2017a, Reference Boontop, Kumaran, Schutze, Clarke, Cameron and Kroschb). The authors confirmed the higher genetic diversity in the native range with genetic sub-structured populations and suggested that the Hawaii invasion was due to multiple introductions from mainland Asia. Then, a population genomic study using genome-wide single nucleotide polymorphisms (SNP) investigated the overall structure of the species, including several populations with an important sampling on the Asian/Pacific area and two localities in Africa (Dupuis et al., Reference Dupuis, Sim, San Jose, Leblanc, Hoassain, Rubinoff and Geib2017). This study confirmed more or less previously identified genetic clusters in former studies, with however discrepancies in the mainland and oceanic Southeast Asia confounded due to variability among samplings.
Yet, the genetic relationships between mainland African invasive populations and their possible invasion routes across East and West Africa had not been resolved, leaving open a number of questions about intracontinental population structure and colonization history of Z. cucurbitae. The objective of this paper is to provide a more detailed description of the African population structure of Z. cucurbitae and to investigate the spatio-temporal dynamics of its African colonization routes. In this respect, a higher number of microsatellite markers, a large sampling coverage in East, West and Central Africa and novel analyses such as the use of Approximate Bayesian Computation (ABC) were used.
Materials and methods
Sampling and DNA extraction
Specimens of Z. cucurbitae (n = 332) were sampled from 17 African locations (table 1) distributed throughout the whole distribution range of the species on the African continent (De Meyer et al., Reference De Meyer, Delatte, Mwatawala, Quilici, Vayssières and Virgilio2015). Field sampling was made by baiting adults using traps with either male lures (cue-lure or methyl eugenol) or a protein lure (torula yeast).
Table 1. Sampling locations, sampling year and geographic coordinates (decimal degrees) of populations of Z. cucurbitae from Africa.

All samples were from traps based in the different localities.
DNA was extracted from ethanol-preserved adults, preserved in the collections of the Royal Museum for Central Africa (Belgium), via the DNeasy Blood and Tissue Kit (Qiagen) as per the manufacturer's instructions. Individual flies were genotyped using 19 microsatellite loci (B5.2, C3.3, E3.4, E4.3, F1.4, F1.6, F3.2, F3.4, G3.4 and BcCIRC3, BcCIRD3, BcCIRD11, BcCIRE8, BcCIRF3, BcCIRF4, BcCIRG1, BcCIRH7, BcCIRH9, BcCIRH10) developed for Z. cucurbitae by Wu et al. (Reference Wu, Li and Wu2009) and Delatte et al. (Reference Delatte, Virgilio, Simiand, Risterucci, DeMeyer and Quilici2010). Primer sequences and protocols for DNA amplification, electrophoresis and allele scoring were performed as described in (2010). Electrophoretic analyses were conducted on an automated ABI Prism 3100 Genetic Analyzer (Applied Biosystem) and an individual was declared not amplified at a locus only after two amplification failures.
Genetic diversity
Microsatellite diversity within populations was estimated using observed (H obs) and Nei's (Reference Nei1987) unbiased expected heterozygosity (H n.b) in GENETIX 4.03 (Belkhir et al., Reference Belkhir, Borsa, Chikhi, Raufaste and Bonhomme1996) and within-population diversity was also estimated (H s) (Nei, Reference Nei1973) using FSTAT (Goudet, Reference Goudet2001). All pairs of loci were tested for linkage disequilibrium using the permutational probability test (104 iterations) of GENEPOP 3.4 (Raymond & Rousset, Reference Raymond and Rousset1995). Single and multilocus Fis were estimated through the fixation index of Weir & Cockerham (Reference Weir and Cockerham1984). Deviations from Hardy–Weinberg equilibrium (HWE) were tested using a two-tailed Fisher's exact test based on Markov-chain randomization (103 dememorizations, 102 batches, and 103 iterations per batch) in GENEPOP. Probability values of repeated comparisons were corrected for Type I errors using the False Discovery Rate (FDR) procedure (Benjamini & Hochberg, Reference Benjamini and Hochberg1995). FreeNA (Chapuis & Estoup, Reference Chapuis and Estoup2007) was used to estimate null allele frequencies (for each locus in each population) according to the expectation maximization (EM) algorithm of Dempster et al. (Reference Dempster, Laird and DB1977). Population differentiation was quantified by calculating pairwise F st values (Weir & Cockerham Reference Weir and Cockerham1984) and verifying their significance through the permutational test implemented in GENETIX.
Population structure
Population structure was revealed using the Bayesian clustering procedures implemented by STRUCTURE 2.2 (Pritchard et al., Reference Pritchard, Stephens and Donnelly2000), and INSTRUCT (Gao et al., Reference Gao, Williamson and Bustamante2007). The most informative number of genetic clusters was inferred according to the method of Evanno et al. (Reference Evanno, Regnaut and Goudet2005). The ad hoc statistic ΔK was calculated by running STRUCTURE for 106 generations (admixture model, burn-in of 5.105 generations) with five iterations for each value of K ranging from 1 to 17. In order to allow asymmetric patterns of admixture among populations the Dirichlet parameter for degree of admixture (α) was separately inferred for each population (Pritchard et al., Reference Pritchard, Stephens and Donnelly2000). At K = 4, analyses in STRUCTURE were repeated using different priors, namely either by considering missing data as recessive homozygotes for the null alleles (Recessivealleles = 1) or including location information (Locprior = 1). CLUMPP v1.1.2 (Jakobsson & Rosenberg, Reference Jakobsson and Rosenberg2007) was used to summarize the posterior estimates of cluster memberships of the ten best runs of STRUCTURE (K = 4), viz. those runs with the highest log probability of the data (LnP(D)). We used the Large K Greedy algorithm of CLUMPP with random input order and 103 permutations to align runs and the G’ pairwise matrix similarity statistics. Admixture proportions of samples and individuals were then visualized using DISTRUCT v1.1 (Rosenberg, Reference Rosenberg2004). The admixture proportions resulting from STRUCTURE (K = 4) were then interpolated with the geographic distribution of individuals. Posterior predictive maps of admixture proportions among individuals were obtained using kriging as described in Virgilio et al. (Reference Virgilio, Delatte, Backeljau and De Meyer2010). In parallel, INSTRUCT software, robust to HW disequilibrium was run with five chains for K = 1–20 (104 burn-in steps and 2 × 10⁵ iterations).
Demographic models
An ABC analysis was conducted to infer the sub-Saharan colonization history of Z. cucurbitae in Africa. DIYABC v2.0 (Cornuet et al., Reference Cornuet, Santos, Beaumont, Robert, Marin, Balding, Guillemaud and Estoup2008; Cornuet et al., Reference Cornuet, Ravigné and Estoup2010; Cornuet et al., Reference Cornuet, Pudlo, Veyssier, Dehne-Garcia, Gautier, Leblois, Marin and Estoup2014) was used to test a number of scenarios compatible and not compatible with the available historical records. All scenarios were based on introductions from a source population, possibly of Central Asian origin (see Virgilio et al., Reference Virgilio, Delatte, Backeljau and De Meyer2010 and Boontop et al., Reference Boontop, Kumaran, Schutze, Clarke, Cameron and Krosch2017b). The coalescent model implemented in DIYABC assumes the divergence of panmictic populations without recurrent migration. To avoid violating this assumption, we restricted our analysis to four representative populations (out of 17), each belonging to one of the main genetics clusters identified by STRUCTURE, and showing as few traces of admixture as possible. Based on co-ancestry coefficients computed in STRUCTURE, Tanz_Tang was used as representative of the East African group 1, Ugan_Waki was used for East African group 2. Congo_Kins was used for Central Africa, IvCoast_Khor represented West Africa and the source group Asia was represented by an Indian sample (n = 32, Virgilio et al., Reference Virgilio, Delatte, Backeljau and De Meyer2010). The aim of the analysis was to retrace the order of colonization events and estimate the extent of possible bottlenecks. Even with four populations, the number of possible scenarios (including bottlenecks and multifurcations) is relatively large. Scenarios without and with bottlenecks, were tested, among which the source population was from Asia as a unique event to Africa (any one of the four countries, and all the other invasions were derived from this source population), then including as well a scenario as Asia being the source population to each of them, testing the possible ‘multiple introduction events’, more complex scenario including multifurcations were also tested between all populations. Then, among those ones we discarded the ones with the lowest probabilities and kept the 25 best ones (SM1). In this analysis, all scenarios assuming an initial introduction into Africa different from Tanz_Tang had very low posterior probabilities (below 0.001). Similarly, scenarios omitting genetic bottlenecks for Tanz_Tang, Ugan Waki, or Congo_Kins received extremely low support.
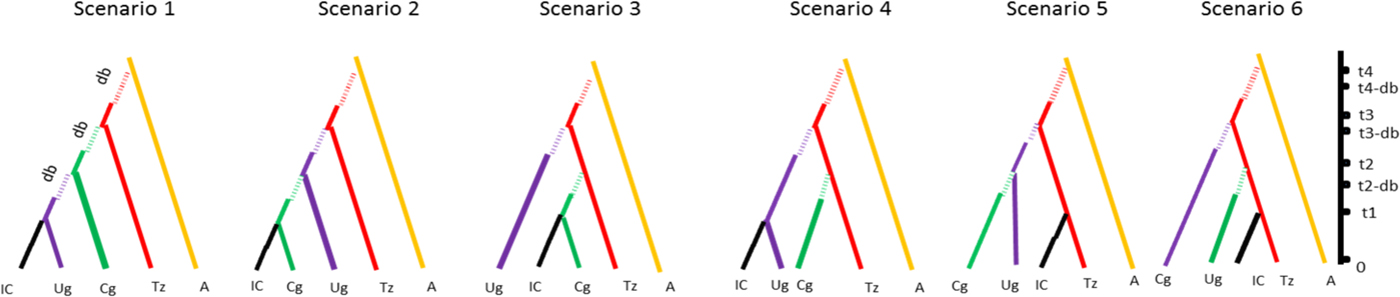
For the clarity of presentation, all previous scenarios were discarded and the whole ABC scenario choice analysis was repeated on a short list of six scenarios with non-negligible posterior probabilities. All of these included East Africa as the entry point of Z. cucurbitae in the continent and differed with respect to the subsequent colonization history, i.e., to the order of colonization of Central-East, Central and West Africa (fig. 1). For each scenario and each population, the following demographic parameters were estimated: dates of founding (as the number of generations) (t i), current effective population size (as the number of diploid individuals) (N ei), number of founders at introduction (N bi) and duration of the initial bottleneck (d bi). For all these demographic parameters, prior distribution ranges, (shown in table 2) were estimated according to known records of Z. cucurbitae in sub-Saharan Africa (De Meyer et al., Reference De Meyer, Delatte, Mwatawala, Quilici, Vayssières and Virgilio2015). Time, expressed in generations before sampling, was translated in years assuming eight generations per year. This indicative value was inferred from the previously published studies on African Z. cucurbitae (Dhillon et al., Reference Dhillon, Singh, Naresh and Sharma2005) as well as from the mean generation time (T) calculated on Hawaiian populations (8.4–9.2 generations per year with a temperature range from 24 to 35 °C, see Vargas et al. (Reference Vargas, Walsh, Kanehisa, Stark and Nishida2000)). One million simulations were conducted under each scenario. Posterior probabilities of each scenario were computed by performing a polychotomous weighted logistic regression on the 1% simulated datasets closest to the observed dataset (Cornuet et al., Reference Cornuet, Santos, Beaumont, Robert, Marin, Balding, Guillemaud and Estoup2008; Cornuet et al., Reference Cornuet, Ravigné and Estoup2010) after linear discriminant analysis on summary statistics (Cornuet et al., Reference Cornuet, Pudlo, Veyssier, Dehne-Garcia, Gautier, Leblois, Marin and Estoup2014). Confidence in scenario choice was further tested using additional simulations. Specifically, 500 pseudo-observed datasets (PODs) were simulated under each scenario and treated as real data, with their posterior probabilities computed as described above. The type II error rate was then computed as the proportion of PODs with the highest posterior probability (PP) for the retained scenario (Cornuet et al., Reference Cornuet, Santos, Beaumont, Robert, Marin, Balding, Guillemaud and Estoup2008). The choice of scenario was followed by parameter inference, with parameter posterior distributions and their 95% confidence intervals (CI) that were inferred via local linear regression on the 1% closest simulated data sets (logit transformation). The precision of parameter inference was then assessed by computing the Square Root of the Mean Square Error of each parameter and the Median of the Absolute Error (MAE), based on the 500 PODs.

Fig. 1. Schematic drawing of the six scenarios used for the ABC method with time scale (t 1 to t 4) and bottleneck (db = duration of bottleneck). Country codes are the following: IC, Ivory Coast; UG, Uganda; CG, Congo; TZ, Tanzania; A, Asia.
Table 2. Summary of the DIYABC analysis based on 6,000,000 simulated datasets averaged over 60,000 selected datasets.
Prior minimum and maximum values, posterior parameter estimates (as inferred from the mode of distributions), 95% confidence interval (CI), relative bias and relative square root error calculated for the best scenario (scenario 6).
In parallel to DIYABC analysis, we used GENECLASS 2 software (Piry et al., Reference Piry, Alapetite, Cornuet, Paetkau, Baudouin and Estoup2004) to detect the probability of assignation or exclusion of individuals from a given population. For doing so, we used the Bayesian criterion implemented in this software (Rannala Mountain, Reference Rannala and Mountain1997) with 1000 simulated individuals (α = 0.01) using the Markov Chain Monte Carlo resampling method (Paetkau, Reference Paetkau, Slade, Burden and Estoup2004).
Results
The analysis of 19 microsatellite loci in 17 populations of Z. cucurbitae (n = 18.6, SD = 5.8) from 12 African countries showed relatively low levels of genetic variability, with mean numbers of alleles (N a) ranging from 2.7 to 3.7 and observed (H obs) and expected heterozygosity (H n.b.) ranging from 0.30 to 0.49 and from 0.40 to 0.54, respectively (table 3). After FDR correction, the exact tests showed significant deviations from HWE in 61 out of 302 population/locus combinations. Multilocus estimates of F is ranged from 0.07 to 0.28 and showed significant heterozygote deficiencies in 15 out of 17 populations (table 3). The average gene diversity (H s) of each population was high for each population, with comparable values with He (table 3). The allelic richnesses (A r) were low and similar between African populations. No linkage disequilibrium among microsatellite markers was detected through the 171 pairwise comparisons (SM2) therefore all loci were considered as independent. The average proportion of null alleles per locus was 0.08 (SD = 0.05) with null alleles per population ranging from 0.04 (SD = 0.08) in Buru_Kigw to 0.10 (SD = 0.10) in Suda_Sing (table 3).
Table 3. Summary of genetic variability 17 African populations of Z. cucurbitae (numbered according to table 1) analyzed at 19 microsatellite loci.

N a, mean number of alleles; A r, allelic richness; H s, gene diversity; H obs, observed heterozygosity; H n.b, expected unbiased heterozygosity; F is, Weir & Cockerham's (Reference Weir and Cockerham1984) fixation index. In each population, asterisks indicate multilocus deviations from HWE (experiment-wise P < 0.05 after False Discovery Rate correction), An, mean null allele frequency based on Dempster et al. (Reference Dempster, Laird and DB1977). Standard deviations are in parentheses.
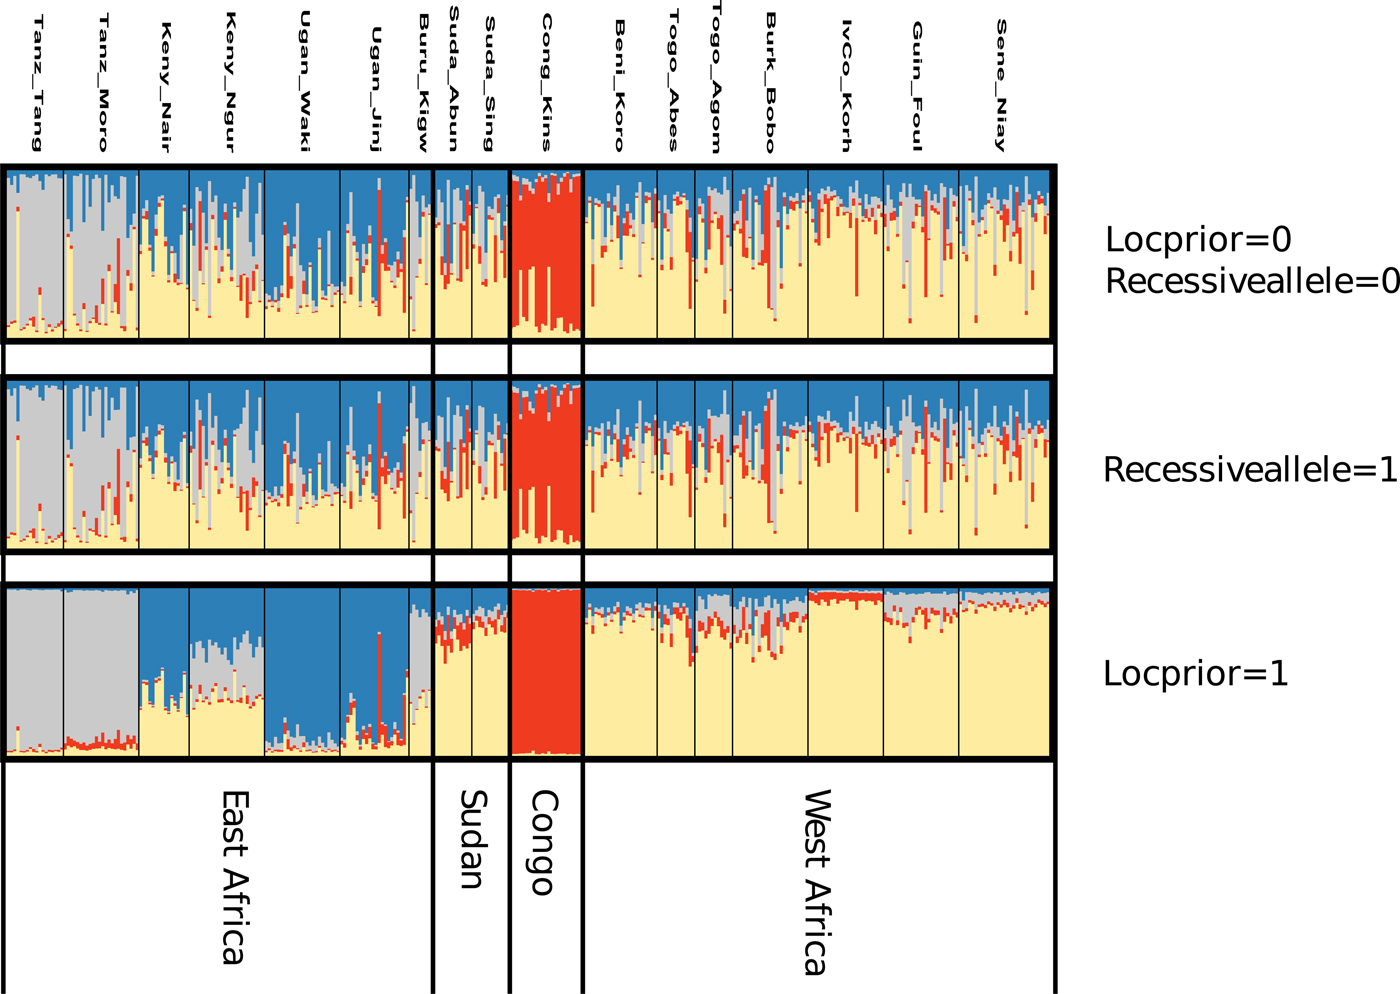
After FDR correction, the majority (71.3%) of pairwise Fst values were significantly different from zero indicating that most Z. cucurbitae populations were genetically divergent (table 4). Analyses in STRUCTURE showed a break in the slope of likelihood values at K = 4, similar results were obtained with INSTRUCT, hence the reconstruction of the African population structure of Z. cucurbitae was based on four main population clusters (fig. 2, SM3). Most populations (13 out of 17) were assigned to one of the clusters with average admixture coefficients (Q) higher than 0.70 (table 5). All populations from West Africa (Sene_Niay, Guin_Foul, IvCo_Korh, Burk_Bobo, Togo_Agom, Togo_Abes, Beni_Koro) were primarily assigned to cluster 1 (Q = 0.71–0.92), as well as the two populations from Sudan (Suda_Sing, Suda_Abun, Q = 0.77 and 0.66, respectively). The population from Congo DR (Cong_Kins) was primarily assigned to cluster 2 (Q = 0.97), those from Uganda (Ugan_Jinj, Ugan_Waki) to cluster 3 (Q = 0.79, 0.90) and those from Tanzania (Tanz_Moro, Tanz_Tang) to cluster 4 (Q = 0.89, 0.95). Three samples showed relatively low average co-ancestry coefficients. These were the population Burundi (Buru_Kigw), which was primarily assigned to clusters 1 and 4 (Q = 0.31 and 0.54, respectively), and the two populations from Kenya (Keny_Ngur, Keny_Nair) primarily assigned to clusters 1 (Q = 0.34, 0.35) and 3 (Q = 0.35, 0.63).

Fig. 2. Ancestry estimation based on the Bayesian clustering method STRUCTURE assuming four population clusters (K = 4). Each vertical line represents an individual, and each color represents a cluster. Individuals are grouped by sampling location (see table 1 for more details). Clustering STRUCTURE outcomes is presented at K = 4 (see results), with analyses in STRUCTURE repeated using different priors, namely either by considering missing data as recessive homozygotes for the null alleles (Recessivealleles = 1) or including location information (Locprior = 1).
Table 4. Pairwise F st values (above diagonal) and results of permutational tests (below diagonal) among 19 African populations of Z. cucurbitae.

*significant at experimentwise a = 0.05. Population abbreviations as in table 1.
Table 5. Average co-ancestry coefficients in 17 populations of Z. cucurbitae assigned to four clusters (population numbers and codes according to table 1).

Coefficients were obtained from the STRUCTURE analysis illustrated in fig. 1 (see methods).
The GENECLASS 2 analysis aimed at detecting the probability of assignation or exclusion of individuals from a given population was run between our different populations (SM4). West African populations are showing quite high values between West African populations (and Sudan) reflecting recent exchanges of populations. These results are corroborating the STRUCTURE results showing high admixture levels between those populations.
The low posterior probabilities allowed confidently discarding 19 scenarios out of the 25 tested (see material and method) using the DIYABC software. The best scenario of the short list of 6, was scenario 6 (SM5) with a PP of 0.56 (95% CI [0.44–0.59]) followed by scenario 5 (PP = 0.10 [0.13–0.21]), and then by scenario 2 (PP = 0.11 [0.00–0.16]). The best scenario assumed that the representative populations from Congo DR, Uganda and Ivory Coast stem from independent introductions from Tanzania, with a source population from Asia (tables 2, 6; fig. 1). The estimated proportions of assignment rates obtained with GENECLASS2 are showing an asymmetric and unidirectional migration of the Asia population to all tested African populations (0.51 ± 0.03 to African populations and 0.03 ± 0.01 received from Africa), also corroborating this unidirectional origin of the African population.
Table 6. Confidence in scenario choice. The best-chosen scenario was the number 6 (embolden).

Total type 2 error rate of scenario 6 = 0.282.
The type II error rate (table 6) associated with scenario 6 (i.e. the probability of select scenario 6 though it is not correct) was relatively low (0.056). Parameter estimates, relative bias and relative precision indices for the best simulations are detailed in table 2. Representative populations from Congo DR, Tanzania and Uganda experienced bottlenecks lasting from 24 to 155 generations, while according to the model; the representative population from Ivory Coast did not experience bottlenecks (see Methods). Estimations suggested that 985–5100 individuals (N e) were introduced to Tanzania from a larger ancestral population with an effective size of 12,100–19,500 individuals (fig. 3). DIYABC estimated that Z. cucurbitae was introduced in Tanzania 998 generations before sampling (95% CI = 602–1440), approximately corresponding to 1883 AD (95% CI = 1828–1933). From Tanzania, then Z. cucurbitae reached Congo DR 477 generations before sampling (approximately in 1948, 95% CI = AD 1893–1963) then Uganda 318 generations before sampling (approximately in 1969, 95% CI = AD 1926–1980) and Ivory Coast 144 generations before sampling (approximately in 1990, 95% CI = AD 1952–1994) (fig. 3).

Fig. 3. Map of Africa with sampling locations (see table 1 for details), and dates of the first description of Zeugodacus cucurbitae from historical records (cf De Meyer et al., Reference De Meyer, Delatte, Mwatawala, Quilici, Vayssières and Virgilio2015), and most likely invasion routes of Z. cucurbitae, deduced from genetic analysis based on microsatellite markers variation and approximate Bayesian computation (DIYABC). The arrows indicate the most likely invasion pathways with the 95% confidence intervals indicated below the map. Estimated years evaluated from the generation time were also deduced, followed by 95% confidence intervals in brackets.
Discussion
The colonization routes of invasive species are often inferred from historical records that are sparse or incomplete (Estoup & Guillemaud, Reference Estoup and Guillemaud2010). The reliability of historical records to trace back the colonization routes of African fruit flies is particularly difficult to verify, due to the relatively recent development of comprehensive monitoring programs and sampling campaign in different parts of Africa, to the patchy spatial and temporal distribution of tephritid flies (see Mwatawala et al., Reference Mwatawala, De Meyer, Makundi and Maerere2009; Mwatawala et al., Reference Mwatawala, Maerere, Makundi and De Meyer2010) and to the scarcity or total lack of information from large areas of the African continent (http://data.gbif.org/occurrences/). Previous analyses on the genetic structure of Z. cucurbitae suggested that the range expansion of this pest originated in Asia and that, based on their results (Virgilio et al., Reference Virgilio, Delatte, Backeljau and De Meyer2010; Jacquard et al., Reference Jacquard, Virgilio, David, Quilici, De Meyer and Delatte2013; Dupuis et al., Reference Dupuis, Sim, San Jose, Leblanc, Hoassain, Rubinoff and Geib2017; Boontop et al., Reference Boontop, Schutze, Clarke, Cameron and Krosch2017a), African populations were clearly distinguishable from the Asian populations as well as from the other worldwide-distributed population groups. Increasing the number of African samples (from almost its whole range of distribution in Africa) provided a better resolution of the intra-continental population structure of Z. cucurbitae.
This study shows that the sub-Saharan population structure of the melon fly includes four main genetic clusters: corresponding to populations of central Africa, Tanzania, Uganda and West Africa, respectively. Two countries, i.e., Burundi and Kenya, showed admixed patterns between East and West African populations. A high number of our sampled populations presented significant heterozygote deficiencies, however, with a low percentage of null alleles detected (<10%). This might possibly be explained by the spatial scale chosen for sampling, which might have attracted individuals out of their true scale of population, inducing more homozygotes than expected under HW equilibrium creating a Wahlund effect (Selkoe & Toonen, Reference Selkoe and Toonen2006). The low genetic diversity and high significant F is of these African populations are also strong signals of founder effects that often occurs in invasive populations.
ABC scenario choice analyses supported the hypothesis of a single introduction event occurring in East Africa between AD 1828 and 1933. This estimate is compatible with the first historical record, AD 1936, available for Tanzania (De Meyer et al., Reference De Meyer, Delatte, Mwatawala, Quilici, Vayssières and Virgilio2015). Colonization events were followed by bottlenecks, promoting genetic divergence between populations, and then, expansion to East Africa (between AD 1893 and 1963), Central Africa (AD 1893–1963) and West Africa (AD 1952–1994). The present results corroborate the hypothesis of a relatively recent introduction to East Africa and subsequent expansion to West Africa of Z. cucurbitae and suggest that these events happened following the timeline suggested by the historical records (viz. 1936 in East Africa and 1999 in West Africa).
The recent results based on genomic (SNP) data (Dupuis et al., Reference Dupuis, Sim, San Jose, Leblanc, Hoassain, Rubinoff and Geib2017) using a worldwide sampling of Z. cucurbitae including two African populations showed that their sampled population from Tanzania was closer to the ones from Asia (Bangladesh/Nepal region) than the one from West Africa (Senegal; based on pairwise F st values). Furthermore, their Z. cucurbitae population from Tanzania was closer to the one from Senegal than any other sampled population in their study. Those results are pointing toward a similar hypothesis of a single source of introduction in East Africa followed by an expansion to West Africa.
This allows excluding previous alternative hypotheses (Virgilio et al., Reference Virgilio, Delatte, Backeljau and De Meyer2010) considering older introductions of Z. cucurbitae possibly related to the first trade contacts between Africa and Asia (dating back as 100 AD, see De Meyer et al., Reference De Meyer, Delatte, Mwatawala, Quilici, Vayssières and Virgilio2015 and references therein). Range expansion promoted by a successful invasive population, which provides propagules outside the native distribution range has recently been described as the invasive bridgehead effect. Indeed this effect was first described on a coccinellid native to Asia (Harmonia axyridis), which is invasive worldwide, and where many of its invasions have stemmed not from its native range, but from a particularly successful invasive population (Lombaert et al., Reference Lombaert, Guillemaud, Cornuet, Malausa, Facon and Estoup2010). Similarly, we can hypothesize that the East African Z. cucurbitae might have played this role during the sub-Saharan range expansion of Z. cucurbitae. To a lesser extent, a similar pattern of invasion might have occurred for B. dorsalis in Africa, where it was suggested that the invasion of this pest across the whole African continent might have been realized by one or two source populations (Khamis et al., Reference Khamis, Karam, Ekesi, de Meyer, Bonomi, Gomulski, Scolari, Gabrieli, Siciliano, Masiga, Kenya, Gasperi, Malacrida and Guglielmino2009).
These invasion patterns are driven by a more successful population, as suggested by Lombaert et al. (Reference Lombaert, Guillemaud, Cornuet, Malausa, Facon and Estoup2010), suggest that we should increase vigilance against invasive bridgehead populations. Indeed, Z. cucurbitae might carry on its invasion wave in other countries where it has not been settled yet, and more careful control should be taken at borders to prevent its arrival in new territories.
Supplementary material
The supplementary material for this article can be found at https://doi.org/10.1017/S0007485319000026.
Acknowledgements
The authors wish to thank all colleagues and collectors who provided specimens for this study. A great thanks to V Ravigné for her advice for conducting the DIYABC methods, such as remarks on the manuscript. The authors also wish to thank the two anonymous referees that improved our manuscript with their suggestions. This work was funded by the Conseil Régional de la Réunion, the European Regional Development Fund (ERDF), the Centre de Coopération International en Recherche Agronomique pour le Développement (CIRAD) and the Royal Museum for Central Africa. This work also had support from a FAO/IAEA Coordinated Research Project on ‘Resolution of cryptic species complexes of tephritid pests to overcome constraints to SIT and international trade’.