


Introduction
Soil salinity is a major abiotic stress affecting the productivity of crops in more than 900 million ha of land globally (Lin et al., Reference Lin, Zhu, Yano, Gao, Liang, Su, Hu, Ren and Chao2004; Rao et al., Reference Rao, Mishra, Gupta and Rathore2008), and about 100 million ha in the south and south-east Asia (Rao et al., Reference Rao, Mishra, Gupta and Rathore2008). Rice plants are inherently salt-sensitive, especially at the seedling and reproductive stages (Munns and Tester, Reference Munns and Tester2008; Mohammadi et al., Reference Mohammadi, Mendioro, Diaz, Gregorio and Singh2014). The higher concentration of salts in the soil induces osmotic and ionic stress to rice plants (Munns and Tester, Reference Munns and Tester2008), which in turn inhibits plant growth, slows down photosynthetic rate, increases reactive oxygen species, and ultimately the death of plants (Rahman et al., Reference Rahman, Thomson, Shah-E-Alam, de Ocampo, Egdane and Ismail2016). India has about 7.1 million ha of land under salt-affected soils of which nearly 30.0% (2.1 million ha) is under coastal saline soils (Yadav et al., Reference Yadav, Bandyopadhyay and Bandyopadhyay1983). The coastal line in India is spread over seven states from Gujarat, Maharashtra, Goa, Karnataka and Kerala on the west coast to Tamil Nadu, Andhra Pradesh, Odisha and West Bengal on the east coast. Salinity is a common problem in these areas and is often characterized by seawater ingression during tides resulting in salt accumulation over the surface (Vinod et al., Reference Vinod, Krishnan, Babu, Singh, Ahmad, Azooz and Prasad2013). The other common features of these low-lying coastal saline soils are continuous waterlogging, flooding and poor drainage (Amanullah et al., Reference Amanullah, Natarajan, Vanathi, Ramasamy and Sathyamoorthi2007). Salinity levels of these soils range from 0.5 dS/m (deciSiemens per meter) during the rainy season to 50 dS/m during summer. Rice is the most preferred crop in coastal areas because of its wider adaptability to salinity and waterlogged conditions (Mishra, Reference Mishra1995). The yield reduction due to salinity is to the tune of 12% for every unit (dS/m) increase in electrical conductivity (EC) beyond the threshold tolerance of 3.0 dS/m (Maas, Reference Maas and Tanji1990).
Farmers are growing traditional rice landraces in these salt-affected soils for many generations despite their poor agronomic traits, low yield and grain quality, merely because of their inherent tolerance to salt stress. Popular among them are Pokkali rice varieties from Kerala coast, Kari kagga and Bili kagga from Karnataka coast, Korgut from Goa, Kalarata and Burarata from Maharashtra and Nona Bokra from West Bengal. The salt tolerance nature of these landraces is explained through different physiological mechanisms including sodium exclusion, compartmentalization of salts into the apoplasts, operative sequestration of salts into the older tissues, stomatal responsiveness and up-regulation of the antioxidant system during stress conditions (Yeo and Flowers, Reference Yeo and Flowers1986; Ismail et al., Reference Ismail, Heuer, Thomson and Wissuwa2007; Moradi and Ismail, Reference Moradi and Ismail2007; Negrão et al., Reference Negrão, Schmöckel and Tester2017). This has compelled many researchers to explore landraces from various regions for studying their response to salinity, the mechanism involved and their relationship with the existing salt-tolerant lines (Flowers and Yeo, Reference Flowers and Yeo1981, Reference Flowers, Yeo, Jaiwal, Singh and Gulaati1997; Gregorio et al., Reference Gregorio, Senadhira and Mendoza1997; Mohammadi-Nejad et al., Reference Mohammadi-Nejad, Singh, Arzani, Rezaie, Sabouri and Gregorio2010; Lodha et al., Reference Lodha, Karmakar, Roychoudhuri and Dey2011; Barrera et al., Reference Barrera, Dala Vina, Vispo and Singh2019). Furthermore, efforts are also made to identify various quantitative trait loci (QTLs) and genes controlling salinity tolerance traits. For instance, a major QTL Saltol has been mapped using recombinant inbred line (RIL) populations derived from crossing Pokkali (salt-tolerant) and IR29 (salt-sensitive) at International Rice Research Institute (IRRI), Philippines (Gregorio et al., Reference Gregorio, Senadhira and Mendoza1997; Islam et al., Reference Islam, Ali, Gregorio and Islam2012). The Saltol QTL region on chromosome 1 of Pokkali rice variety is contributing to salt tolerance at the seedling stage by maintaining the Na+/K+ homeostasis (Gregorio et al., Reference Gregorio, Senadhira and Mendoza1997; Lin et al., Reference Lin, Zhu, Yano, Gao, Liang, Su, Hu, Ren and Chao2004; Ren et al., Reference Ren, Gao, Li, Cai, Huang, Chao, Zhu, Wang, Luan and Lin2005; Mohammadi-Nejad et al., Reference Mohammadi-Nejad, Arzani, Rezai, Singh and Gregorio2008; Thomson et al., Reference Thomson, Ismail, McCouch, Mackill, Pareek, Sopory, Bohnert and Govindjee2010b; Platten et al., Reference Platten, Egdane and Ismail2013). Several simple sequence repeat (SSR) markers linked to the Saltol QTL region were later reported by many authors (Lang et al., Reference Lang, Li and Bui2001; Singh et al., Reference Singh, Gregorio and Jain2007). Subsequently, Pokkali, its derivative FL478, and other accessions such as Nona Bokra with Saltol QTL were utilized extensively for introgressing Saltol QTL into the background of popular rice varieties (Waziri et al., Reference Waziri, Kumar and Purty2016; Batayeva et al., Reference Batayeva, Labaco, Ye, Li, Usenbekov, Rysbekova, Dyuskalieva, Vergara, Reinke and Leung2018). Recently, Saltol QTL has also been successfully transferred from FL478 to Pusa Basmati 1509, a high-yielding and early maturing Basmati rice variety by employing marker-assisted backcross breeding (Yadav et al., Reference Yadav, Kumar, Grover, Ellur, Krishnan, Bollinedi, Bhowmick, Vinod, Nagarajan, Krishnamurthy and Singh2020). Similarly, Krishnamurthy et al. (Reference Krishnamurthy, Pundir, Warraich, Rathor, Lokeshkumar, Singh and Sharma2020) deployed Saltol region into the background of Pusa 44 and Sarjoo 52, high-yielding popular varieties of the North-Western region of India.
Similar to Pokkali rice from the coastal tract of Kerala state in southern India, the native rice germplasms from Goa and Karnataka coast need to be evaluated systematically for their response to induced salt stress through the molecular and physiological approach. This will help in identifying novel sources governing salt stress tolerance. The salt-affected soils in these states are called by local names as Khazan land in Goa and Ghajani land in Karnataka. To our knowledge, there is no such attempt of the marker-based study of Saltol region in the germplasm collections of these two states. Further, little is known about their relationship with the already known salt-tolerant lines, namely, Pokkali and FL478. Therefore, haplotyping of Saltol QTL region was carried out in a diverse panel of 71 rice genotypes comprising of landraces, wild germplasm, introgression lines and released varieties using 14 Saltol QTL linked SSR markers with the following objectives: (i) to evaluate salt tolerance level of rice genotypes at seedling stage, (ii) to assess the haplotype diversity of Saltol region in the selected genotypes and (iii) to identify novel genotypes that possess distinct Saltol haplotype, as a new source of salt tolerance.
Materials and methods
Plant materials
This study utilized a set of 71 rice genotypes comprising of landraces, wild rice, introgression lines and released varieties details of which are given in Supplementary Table S1. The explorations for collecting landraces and wild rice were carried out in North Goa and South Goa districts of Goa state and Uttara Kannada and Shimoga districts of Karnataka state between the period 2010 and 2015. Among the 71 genotypes, 34 are landraces of which 18 are collections from Goa while 16 are from Karnataka. Seventeen genotypes are wild rice accessions which are native to Goa state. These wild rice accessions were later coded as Goa wild rice (GWR). The remaining 18 genotypes comprised of popular salt-tolerant rice varieties released in India and introgression lines developed at ICAR–Central Coastal Agricultural Research Institue, Goa. We have used two check varieties, namely, FL478 and IR29. FL478 (IR66946-3R-178-1-1), a recombinant inbred line (RIL) derived from the Pokkali X IR29 cross was used as tolerant check whereas IR29 was used as a sensitive check.
Phenotyping for seedling stage salt tolerance
Phenotyping for salt stress at the seedling stage was carried out under micro plots during the wet season (Kharif) of 2017 at ICAR-Central Coastal Agricultural Research Institute, Goa (latitude: 15°30′52″N; longitude: 73°55′01″E). Micro plots are the cement tanks with dimensions 8 m length × 2 m width × 1.2 m depth and are provided with an irrigation pipe at the bottom of the tank. The bottom layer of the micro plot was filled with gravels of different sizes followed by sand and two feet of soil on top. Pre-germinated seeds of all the genotypes along with a sensitive check (IR29) and tolerant check (FL478) were sown in a single row with 13 seedlings in two replications. From germination to the second leaf stage (approximately 7–8 days after sowing), the seedlings were grown in non-salinized water. Seedlings were gradually exposed to salt stress with initial salinity of 4 dS/m. The salt solution was prepared by mixing common salt with tap water. The salinity level of the irrigated water was then slowly increased by two units each day till the EC reached 12 dS/M (approximately 14–15 days after sowing). Subsequently, the salinity level in the tank was maintained constant at 12 dS/m until the reference salt-sensitive check genotype IR29 dies. The average pH of the irrigation water in the experiment was 7.14. Salt stress injury in the genotypes was recorded on a scale of 1–9 as per the standard evaluation system (SES) of rice (Gregorio et al., Reference Gregorio, Senadhira and Mendoza1997). Scores 1–2 indicate highly tolerant (HT), 3 tolerant (T), 5–6 moderately tolerant (MT), 7–8 sensitive (S) and 9 highly sensitive (HS).
DNA isolation and genotyping using SSR markers
The DNA isolation of the genotypes was carried out using standard cetyl-trimethyl ammonium bromide (CTAB) DNA extraction protocol (Doyle and Doyle, Reference Doyle and Doyle1990). Genetic relationship among the 71 rice genotypes was assessed using 14 Saltol QTL linked SSR markers (Bonilla et al., Reference Bonilla, Dvorak, Mackill, Deal and Gregorio2002; Niones, Reference Niones2004; Thomson et al., Reference Thomson, de Ocampo, Egdane, Rahman, Sajise, Adorada, Tumimbang-Raiz, Blumwald, Seraj, Singh, Gregorio and Ismail2010a) details of which are given in Table 1. For PCR amplification, 25 μl of reaction mixture containing 2 μl of genomic DNA (50 ng/μl), 12.5 μl 2× GoTaq® G2 PCR master mix buffer (pH 8.5) containing GoTaq® G2 DNA polymerase, 400 μM of dNTP each and 3 mM of MgCl2 and 0.4 pmol/μl each of the forward and reverse primers were used. PCR amplification reaction starts with 95°C for 5 min followed by 35 cycles of denaturation at 94°C for 1 min, annealing at primer annealing temperature (T a) in degree celsius for 1 min, extension at 72°C for 1 min and a final extension at 72°C for 10 min using a thermal cycler (Applied Biosynthesis, Veriti thermal cycler). The SSR profile was resolved in 3% native agarose SFR™ gel along with a 50 bp ladder (Qiagen) following a standard protocol (Sambrook and Russell, Reference Sambrook and Russell2001). The PCR amplicons were visualized under UV using a gel documentation system (BIO-Print, Vilber Lourmat).
Table 1. Number of alleles, PIC, effective number of alleles (Ne) and gene diversity (I) for 14 SSR markers used in this study
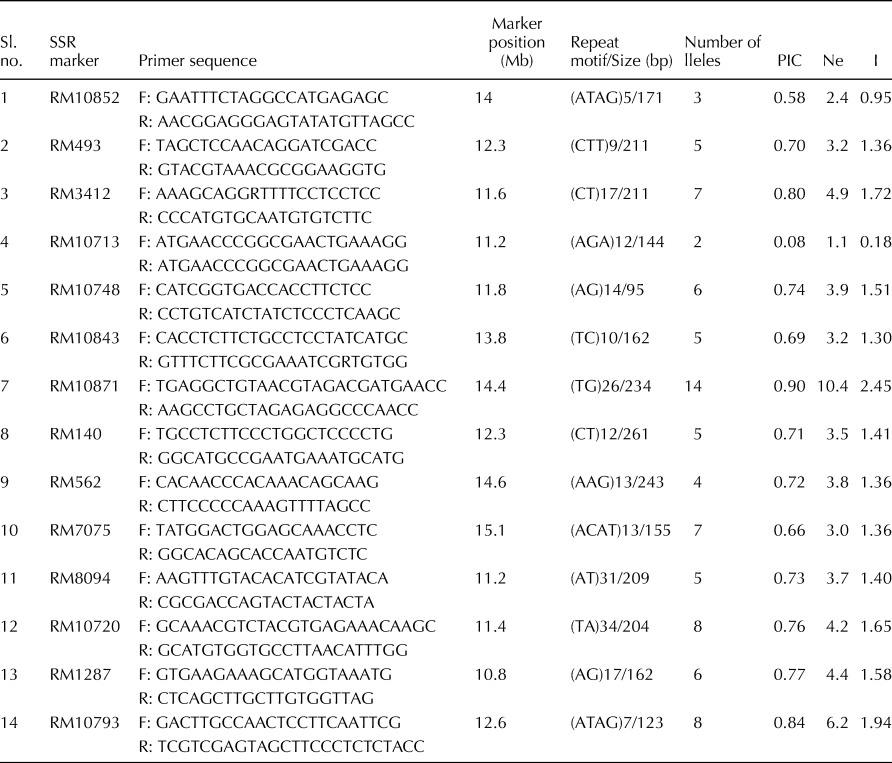
SSR, simple sequence repeat; PIC, polymorphic information content.
Data analysis
The obtained banding patterns were scored in MS Excel 2013 using a binary matrix based on the presence (1) or the absence (0) of a particular band or allele for each marker locus across all the examined rice genotypes. Polymorphic information content (PIC) of the individual SSRs were calculated with the following formula (Anderson et al., Reference Anderson, Churchill, Autrique, Tanksley and Sorrels1993).
 $${\rm PI}{\rm C}_i = 1-\;\int_{\,j = 1}^n {P_{ij}^2 } $$
The other diversity parameters such as effective number of alleles (Ne) and gene diversity (I) (Shannon's information index) were calculated using POPGENE (v 1.32). The haplotype analysis and the phylogenetic relationships between the genotypes was carried out using GGT2 software (V.2.0) (Van Berloo, 2008). The cluster analysis was done according to the unweighted neighbour-joining method using a dissimilarity matrix of simple matching coefficients.
Results
The response of the rice genotypes for induced salt stress at the seedling stage
The response of 71 rice genotypes to induced salt stress of 12 dS/m at the seedling stage varies from tolerance to highly sensitive (Table 2). None of the genotypes recorded a highly tolerant (HT) response (SES score 1), whereas 10 genotypes showed a tolerant (T) response (SES score 3–4) similar to tolerant check FL478. The response of 16 genotypes was identified as moderately tolerant (MT), 29 genotypes as sensitive (S) and the remaining 15 genotypes as highly sensitive (HS).
Table 2. Response of 71 rice genotypes to induced salt stress (EC ~ 12 dS/M) at seedling stage

HT, highly tolerant; T, tolerant; MT, moderately tolerant; S, sensitive, HS, highly sensitive; SES, standard evaluation system; GWR, Goa Wild Rice.
Allelic diversity of Saltol linked SSR markers and grouping of rice cultivars
Fourteen SSR markers in the Saltol QTL region were utilized to study the allelic diversity in the studied genotypes. Among the markers, RM10871 was found to be the most polymorphic with a PIC of 0.90 and exhibited 14 different alleles followed by RM10793 (0.84) and RM3412 (0.80) with 8 and 7 alleles, respectively (Table 1). The allelic profile of RM10793 is shown in Fig. 1. RM10720 and RM7075 also exhibited 8 and 7 alleles, respectively, but had comparatively low PIC values (0.76 and 0.66). RM10713 with only two alleles exhibited the lowest PIC of 0.08. The gene diversity (I) values ranged from 0.18 for RM10713 to 2.45 for RM10871, with an average of 1.44 (SD = ± 0.5). Similarly, the effective number of alleles (Ne) was found highest in RM10871 (10.40), while it was lowest in marker RM 10713 (1.08) with an average Ne of 4.1 (SD = ± 2.1).

Fig. 1. Amplification profile of marker RM10793 in landrace collections of (a) Goa and (b) Karnataka with FL478 as tolerant check and IR29 as a sensitive check.
Cluster analysis based on the allelic pattern of the 14 SSR markers grouped the 71 genotypes into seven major clusters (Fig. 2). Cluster 1 comprised of salt-tolerant check FL478 along with tolerant and moderately tolerant genotypes from cultivated and introgression lines except for two highly sensitive genotypes GWR 001 and Kaloki. Cluster 2 was formed by closely related salt-sensitive wild rice accessions. Two popular salt-tolerant landraces, namely, Kagga and Korgut from coastal parts of Karnataka and Goa states, respectively, are grouped in cluster 3. Cluster 4 had two sub-clusters, one formed by genotypes from cultivated and introgression lines with varying levels of tolerance to salinity, while the other was formed by salt-sensitive landraces from Karnataka. Most of the Goan landraces which are sensitive to salt stress to a varying degree and three moderately tolerant genotypes Goa Dhan 1, Halaga and Xitto are grouped in cluster 5. Cluster 6 comprised of landraces and wild rice all of which showed a sensitive response to salt stress except one wild rice accession (GWR 005) which showed a tolerant response. The remaining 15 genotypes are grouped in cluster 7 comprised of a mixture of salt-sensitive and tolerant genotypes.
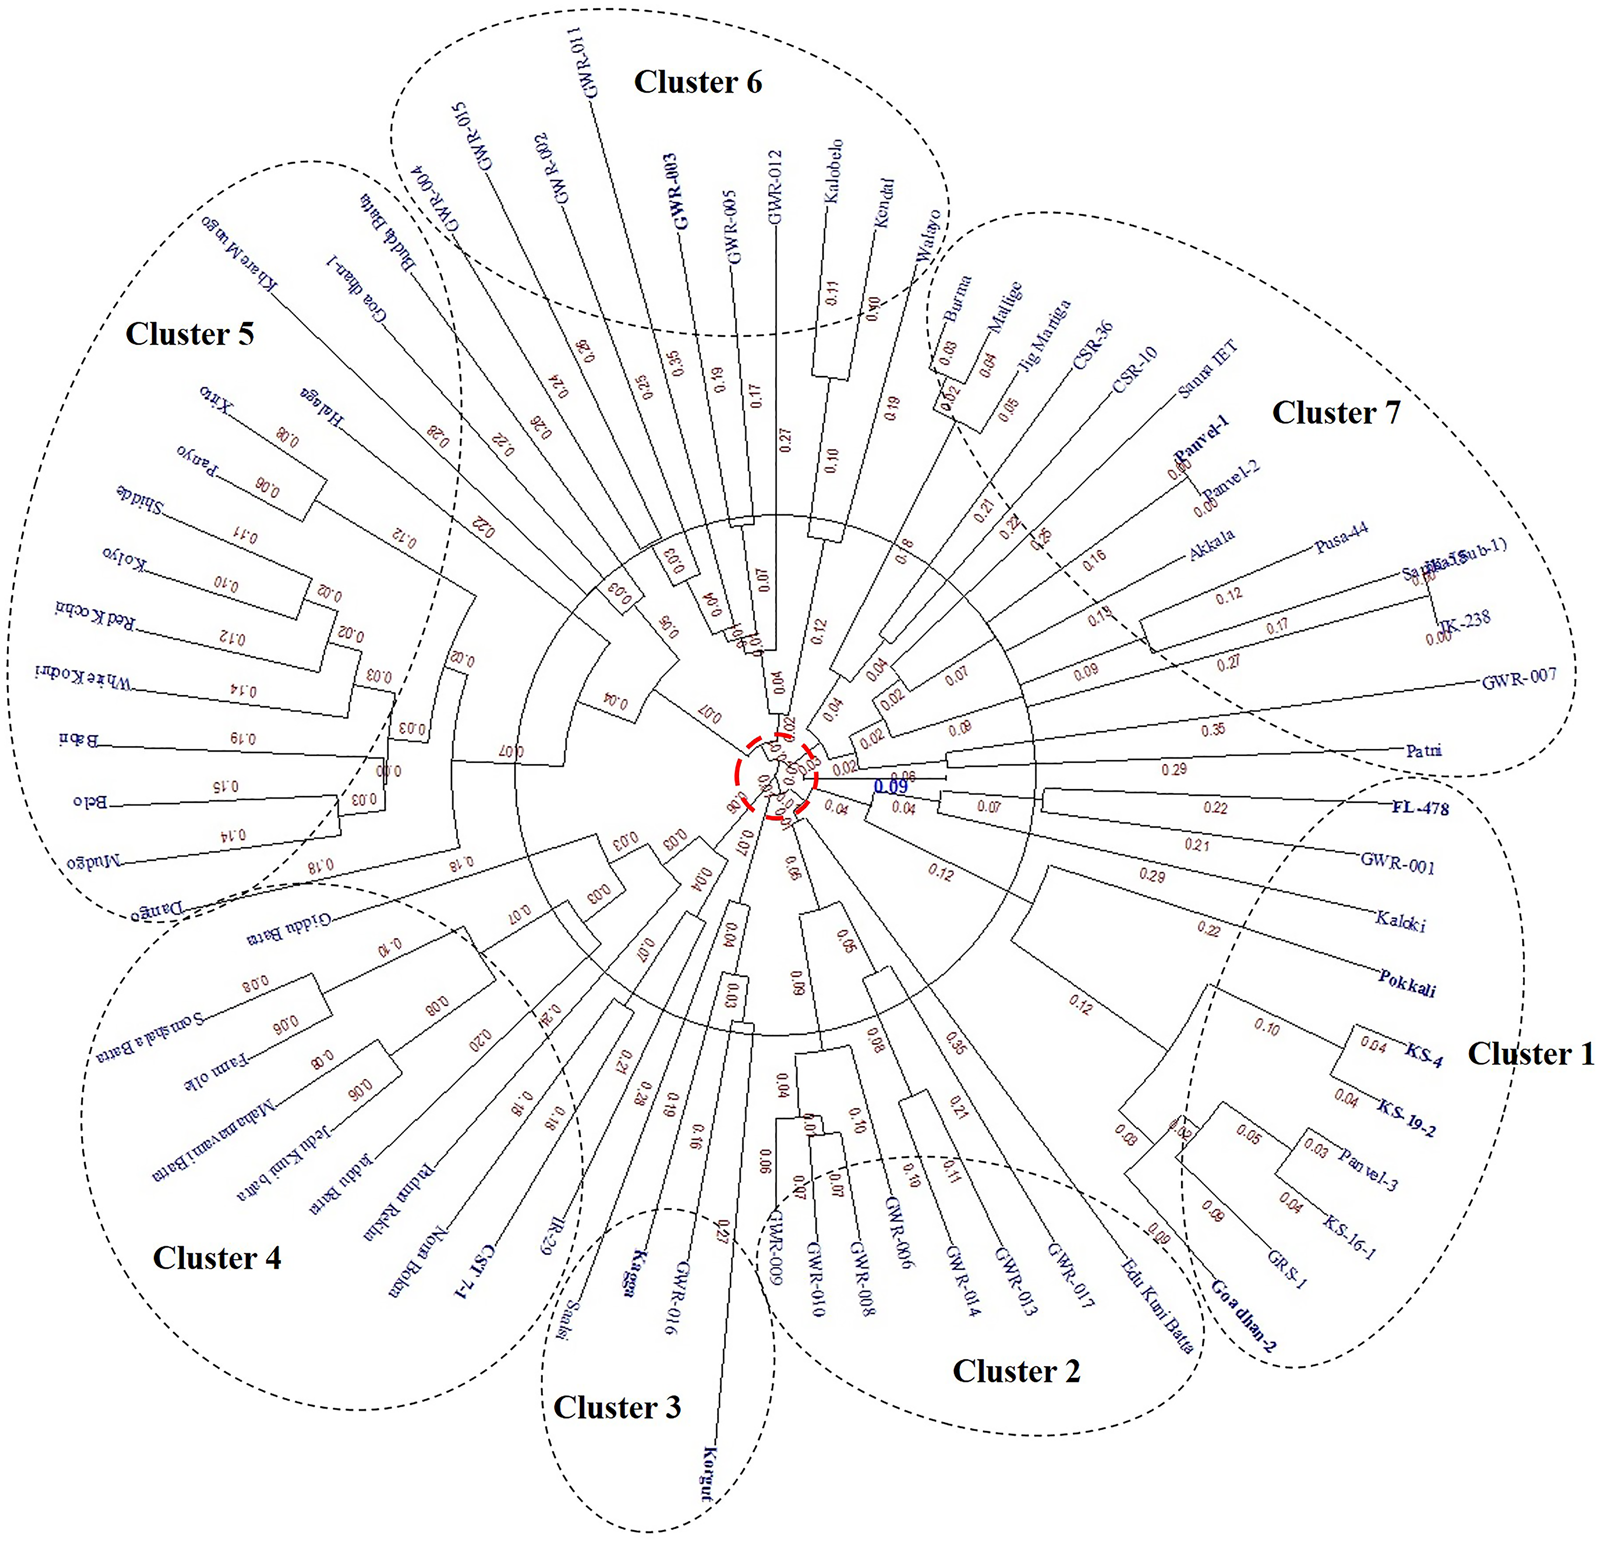
Fig. 2. SSR marker-based unweighted neighbour-joining radial dendrogram of 71 rice genotypes using dissimilarity matrix of simple matching coefficients.
Haplotype analysis of Saltol QTL
The genotypes were segregated into different haplotypes based on allelic information obtained from 14 SSR markers of the Saltol region on chromosome 1 using FL478 as a reference. The comparison of haplotypes of all the tested genotypes is illustrated in Fig. 3(a). Colours in the horizontal line next to a marker represent different alleles for the respective loci thereby illustrating the variation of the SSR with respect to the reference haplotype. All the genotypes studied exhibited very high allelic diversity for each of the SSR marker loci.
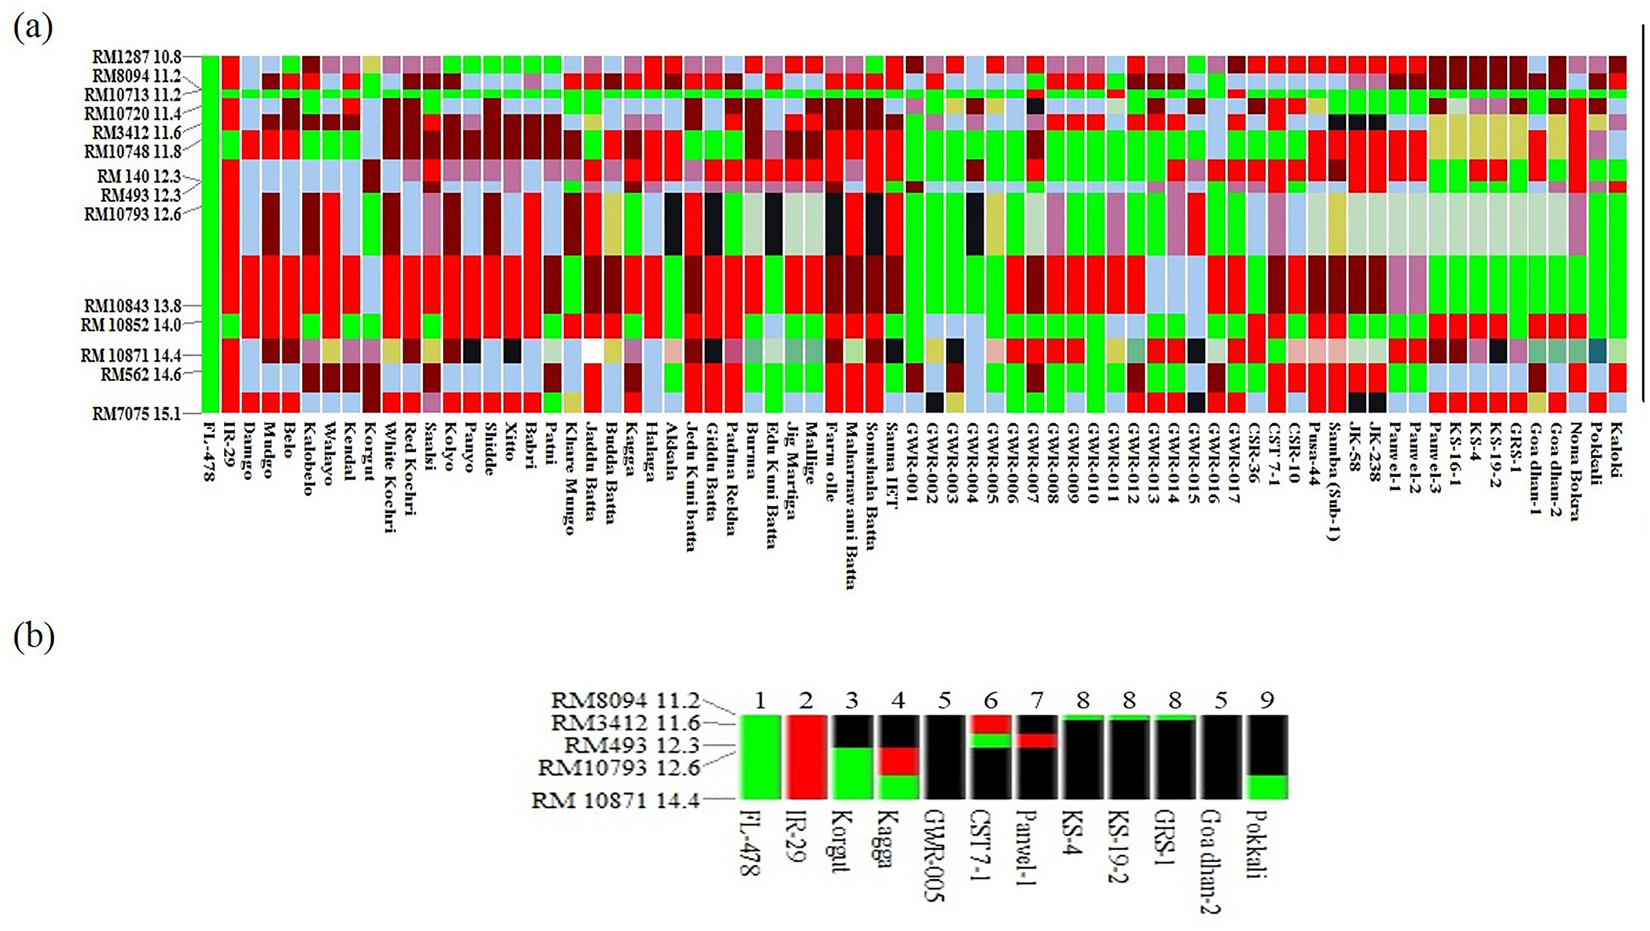
Fig. 3. (a) Haplotypes in the Saltol region of 71 rice genotypes with FL478 and IR29 as tolerant and sensitive checks, respectively. (b) Haplotypes of 10 tolerant genotypes using five highly polymorphic markers with FL478 and IR29 as tolerant and sensitive checks, respectively.
Note: Green – FL 478 type allele, red – IR 29 type allele and black – novel type alleles.
Further, to check the variation within the Saltol region of the phenotypically tolerant genotypes with FL478, a haplotype map of only tolerant genotypes was prepared using five highly polymorphic markers RM8094, RM3412, RM493, RM10793 and RM10871 with IR29 as a sensitive check (Fig. 3(b)). The alleles which varied from the reference haplotypes were considered as a novel allele, while the ones which are similar to FL478 and IR29 were considered as positive and negative alleles, respectively. This comparison resulted in seven different SSR haplotypes for 10 tolerant genotypes in addition to the two reference haplotypes of tolerant FL478 and sensitive IR29. All the ten genotypes which exhibited seedling stage salt tolerance were novel haplotypes. However, three genotypes, namely, Goa Dhan 2, Panvel 1 and GWR 005 were found to be entirely different from FL478 in their allelic constitution.
Discussion
In this study, 10 genotypes showed tolerance response to salinity stress at the seedling stage. Six of them are from released varieties and introgression lines, three are landraces and one is a wild relative. Landraces, namely, Kagga from Karnataka state and Korgut from Goa state are to date the most preferred varieties for cultivation in the salt-affected coastal saline soils. The salt tolerance nature of Kagga was previously reported by Rajanna (Reference Rajanna2010) and that of Korgut by Manohara et al. (Reference Manohara, Chattopadhyay, Marndi, Singh and Singh2015). Wild rice GWR 005 is a collection from the low-lying coastal saline areas in Goa and is the only wild rice that showed a tolerance reaction similar to that of salt-tolerant check FL478. In addition to the above three genotypes, other tolerant lines from the study are CST 7-1, Panvel 1, Korgut selections (KS) 4, KS 19-2, GRS 1 and Goa Dhan 2. These are either introgression lines or the released varieties having lineage with the region-specific locally cultivated salt-tolerant landraces. For instance, CST 7-1, a national check variety for coastal saline soils in India has Damodar, a popular salt-tolerant landrace of West Bengal state, as one of its parents. Similarly, Panvel 1 was developed using salt-tolerant landrace Bhura rata, a widely grown landrace in the coastal saline soils of the Konkan region of Maharashtra state in India. KS series of lines, namely, KS 2, KS 19-2, Goa Dhan 2 (originally KS 17; named as Goa Dhan 2 after its release as variety in Goa state) are selections from Korgut, a salt-tolerant landrace cultivated extensively in the low-lying coastal saline areas of Goa state (Manohara et al., Reference Manohara, Bhosle and Singh2019). GRS-1 is a Saltol QTL introgression line from the IRRI, Philippines. The information on the salt tolerance nature of these popular landraces and their geographical location was earlier reported by Singh et al. (Reference Singh, Redona, Refuerz, Pareek, Sopory, Bohnert and Govindjee2010).
Cluster analysis presents an overview of genetic diversity and similarity among the studied rice germplasm. In this study, 71 rice genotypes were grouped into seven distinct clusters (clusters 1, 2, 3, 4, 5, 6 and 7). Salt-tolerant genotypes Pokkali, KS 4, KS 19-2, GRS 1 and Goa Dhan 2 are grouped in cluster 1 along with tolerant check FL478. Genotype GRS 1 (IR 87848-301-2-1-3-B) has Saltol QTL introgressed in it. This Saltol region of GRS 1 is coming from FL478, which was developed from the IR29 X Pokkali population. Hence, FL478, Pokkali and GRS 1 share a common lineage. Genotypes KS 4, KS 19-2, Goa Dhan 2 (KS 17) are pure line derivatives of salt-tolerant landrace Korgut, which is, however, falling in cluster 3 along with another popular salt-tolerant landrace Kagga from the Karnataka coast. The grouping of Korgut and its progenies in different clusters may be due to the heterogeneous nature of Korgut, and during selection these progeny lines deviated from the parental bulk population. This form of variations in the Saltol region has been reported earlier in Pokkali derived lines by Islam et al. (Reference Islam, Ali, Gregorio and Islam2012). Except for cluster 2 wherein only sensitive genotypes are grouped, in all other clusters, there is no clear distinction between the tolerant and sensitive genotypes. The reason for this is, this study utilized markers only from the Saltol region on chromosome 1. There might be several other genes/QTLs governing salt tolerance in other chromosomes that were not analysed here (Lin et al., Reference Lin, Zhu, Yano, Gao, Liang, Su, Hu, Ren and Chao2004; Ren et al., Reference Ren, Gao, Li, Cai, Huang, Chao, Zhu, Wang, Luan and Lin2005, Pandit et al., Reference Pandit, Rai, Bal, Sinha, Kumar, Chauhan, Gautam, Singh, Sharma, Singh, Gaikwad, Sharma, Mohapatra and Singh2010; Kumar et al., Reference Kumar, Singh, Mithra, Krishnamurthy, Parida, Jain, Tiwari, Kumar, Rao, Sharma, Khurana, Singh and Mohapatra2015).
The 14 SSR markers utilized in this study have been previously reported to be polymorphic in several other investigations due to their robustness to differentiate individual germplasm accessions (Thomson et al., Reference Thomson, de Ocampo, Egdane, Rahman, Sajise, Adorada, Tumimbang-Raiz, Blumwald, Seraj, Singh, Gregorio and Ismail2010a; Babu et al., Reference Babu, Vinod, Krishnan, Bhowmick, Vanaja, Krishnamurthy, Nagarajan, Singh, Prabhu and Singh2014; Krishnamurthy et al., Reference Krishnamurthy, Sharma, Kumar, Tiwari and Singh2015). The results of the current study presented PIC values ranging from 0.008 (RM10713) to 0.91 (RM10871) with an average PIC of 0.69. Thus, judging by the PIC value, except for one marker, all the markers used in this study are highly informative exhibiting a substantial level of polymorphism with a PIC of more than 0.5. The variation in the PIC values implies that some loci within the Saltol region had relatively more frequent recombination and evolutionary reorganizations, resulting in more number of alleles and high PIC values (Babu et al., Reference Babu, Vinod, Krishnan, Bhowmick, Vanaja, Krishnamurthy, Nagarajan, Singh, Prabhu and Singh2014). As the PIC values in this study varied from 0.008 (RM10713) to 0.91 (RM10871), Ganie et al. (Reference Ganie, Borgohain, Kritika, Talukdar, Pani and Mondal2016) recommended the selection of few but most useful and informative markers on criteria like PIC value, amplicon size range and the number of alleles for better understanding of allelic diversity within the Saltol region. The highly polymorphic nature of RM10871 has previously been reported by Krishnamurthy et al. (Reference Krishnamurthy, Nagarajan, Singh, Prabhu and Singh2014) with a PIC of 0.82 in a set of 57 diverse rice germplasm. Accordingly, three markers RM10871, RM10793 and RM3412 were short-listed for the haplotype analysis of only phenotypically tolerant genotypes. In addition to these three markers, two closely linked Saltol markers RM8094 (Islam et al., Reference Islam, Ali, Gregorio and Islam2012) and RM493 (Islam et al., Reference Islam, Gregorio, Salam, Collard, Tumimbang-Raiz, Adorada, Mendoza, Singh and Hassan2011) were also chosen. These five markers have shown higher values of I and Ne in comparison to other markers used in this study. Earlier reports also highlighted the importance of these markers as candidates for marker-assisted selection of rice cultivars (Ali et al., Reference Ali, Yeasmin, Gantait, Goswami and Chakraborty2014; Babu et al., Reference Babu, Vinod, Krishnan, Bhowmick, Vanaja, Krishnamurthy, Nagarajan, Singh, Prabhu and Singh2014; Krishnamurthy et al., Reference Krishnamurthy, Sharma, Kumar, Tiwari and Singh2015; Ravikiran et al., Reference Ravikiran, Krishnamurthy, Warraich and Sharma2018).
Haplotypes of the studied genotypes were compared with salt-tolerant FL478 and salt-sensitive IR29. Similar comparisons of haplotypes for seedling stage salinity tolerance were earlier reported by Mohammadi-Nejad et al. (Reference Mohammadi-Nejad, Singh, Arzani, Rezaie, Sabouri and Gregorio2010), Islam et al. (Reference Islam, Ali, Gregorio and Islam2012), Babu et al. (Reference Babu, Vinod, Krishnan, Bhowmick, Vanaja, Krishnamurthy, Nagarajan, Singh, Prabhu and Singh2014), Kordrostami et al. (Reference Kordrostami, Rabiei and Kumleh2016) and Ravikiran et al. (Reference Ravikiran, Krishnamurthy, Warraich and Sharma2018). Using the haplotype patterns within the set of chosen informative markers, the 10 salt-tolerant genotypes were distinguished into seven different haplotypes (excluding the reference haplotypes) (Fig. 3(b)). The tolerance of the haplotypes 3, 4, 6, 8 and 9 might be attributed to Saltol QTL as they share at least one allele similar to FL478. None of the haplotypes completely matched the reference haplotype of FL478 (haplotype 1), but the alleles of the most informative and highly polymorphic marker RM10871 were shared between Pokkali, Korgut and Kagga suggesting the tolerance in these genotypes is from the Saltol QTL region. However, haplotype 5 comprising of genotypes Goa Dhan 2 and GWR 005; and haplotype 7 which included genotype Panvel 1 did not consist of any of the FL478 alleles. This suggests that the seedling stage salinity tolerance in genotypes Goa Dhan 2, Panvel 1 and GWR 005 may be due to genes/QTLs other than the Saltol loci of FL478. Babu et al. (Reference Babu, Vinod, Krishnan, Bhowmick, Vanaja, Krishnamurthy, Nagarajan, Singh, Prabhu and Singh2014) could delineate 14 haplotypes for six informative Saltol associated markers analysed across 23 rice genotypes. They found three genotypes with a different allelic pattern with Pokkali as the reference. Similarly, it can be interpreted that the salinity tolerance of Goa Dhan 2, Panvel 1 and GWR 005 may be resulting from the QTLs other than Saltol on chromosome 1. Therefore these three genotypes with probable novel regions can be considered for enhancing salt tolerance of rice cultivars.
Conclusion
Seedling stage salinity tolerance in rice is very important to overcome the effect of salt stress during the early stages of crop establishment. This investigation is a maiden attempt to assess the seedling stage salinity tolerance of rice germplasm collections from coastal parts of Goa and Karnataka. The SSR-based analysis in the present investigation, revealed marked variation among the studied germplasm. Salt tolerance of genotypes Goa Dhan 2, Panvel 1 and GWR 005 appears to be controlled by QTLs other than Saltol and hence can be used as probable novel donors for seedling stage salinity tolerance. These genotypes would help in widening the genetic base and maintaining the variability of the newly developed salt-tolerant rice varieties. Our study further shows that highly variable SSR markers RM10871, RM10793 and RM3412 could well be utilized in combination for marker-assisted transfer of Saltol into the background of popular seedling stage-sensitive mega varieties.
Supplementary material
The supplementary material for this article can be found at https://doi.org/10.1017/S1479262121000320
Acknowledgements
The authors acknowledge ICAR sponsored project ICAR-Network Project on Functional Genomics and Genetic Modification (NP-FGGM) for financial assistance and support. The authors are also acknowledge ICAR-Central Coastal Agricultural Research Institute, Goa, India, for the facilities and support to carry out this research study.
Author contributions
KKM: conceived the idea, designed the experiment; KKM, SM, YS, PP: performed the field and lab experiments; SM: helped in SSR scoring, preparing the tables and figures; KKM, SM, YS, PP: prepared the manuscript; NKS: reviewed the draft and provided critical scientific inputs for the improvement of the manuscript.
Conflict of interest
The authors declare no conflict of interest.


