Many farmers focus on early-season control of weed seedlings (Jabbour et al. Reference Jabbour, Gallandt, Zwickle, Wilson and Doohan2014a). However, this weed management strategy may worsen weed problems over time if weeds are allowed to set seed (Norris Reference Norris1999). Conversely, farmers with a longer-term weed-seedbank focus attempt to prevent weeds from setting seed (Jabbour et al. Reference Jabbour, Gallandt, Zwickle, Wilson and Doohan2014a). Additionally, direct weed control may be avoided through use of mulch. Each of these approaches may form the basis of a farmer’s management philosophy (B Brown, ER Gallandt, unpublished data). However, strategies may also be selected to achieve field- or crop-specific management goals, since each strategy likely represents different effects on the weed seedbank, edaphic organisms, and the relative mix of soil-aggrading versus soil-degrading practices employed.
Seedling-focused management often prioritizes control events during the “critical period,” when crops are most sensitive to competition and weed-free conditions should be maintained to avoid yield losses (Nieto et al. Reference Nieto, Brondo and Gonzales1968). Such an approach has been used to maximize efficiency of in-season weed management (Knezevic et al. Reference Knezevic, Evans, Blankenship, Van Acker and Lindquist2002). If weeds are only controlled in the critical period, later-emerging weeds may proliferate, which may provide benefits resulting from increased biodiversity (Amaral et al. Reference Amaral, Venzon, dos Santos, Sujii, Schmidt and Harwood2016; Crowder and Jabbour Reference Crowder and Jabbour2014), but since these weeds will likely set seed, control costs will likely increase in subsequent crops (Norris Reference Norris1999).
An alternative to seedling-focused weed management involves a longer-term, seedbank-focused perspective. Many weed species have seed longevity “half-lives” of less than 1 yr (Roberts and Feast Reference Roberts and Feast1972). Thus, preventing seed rain causes a rapid decrease in the weed seedbank, which may provide a labor savings in succeeding years (Norris Reference Norris1999). Therefore, a “zero seed rain” approach uses frequent soil disturbance to minimize credits to the weed seedbank while maximizing debits (Forcella Reference Forcella2003; Gallandt Reference Gallandt2014). However, bare soil and frequent disturbance may negatively affect soil health (Browning et al. Reference Browning, Norton, Collins and Wilson1944; Rasmussen Reference Rasmussen1999).
Farmers may substitute cultivation for weed suppression by mulch. Black polyethylene mulch is common due to its ability to warm the soil and promote early yield of crops like tomatoes (Solanum lycopersicum L.) (Schonbeck and Evanylo Reference Schonbeck and Evanylo1998a). Polyethylene mulch can reduce the amount of required irrigation (Abu-Awwad Reference Abu-Awwad1999) and conserve soil nitrate (Schonbeck and Evanylo Reference Schonbeck and Evanylo1998b). Natural mulches, such as straw or hay, may also be used to suppress weed growth (Teasdale and Mohler Reference Teasdale and Mohler2000) and improve water infiltration (Shock et al. Reference Shock, Jensen, Hobson, Seddigh, Shock, Saunders and Stieber1999; Tindall et al. Reference Tindall, Beverly and Radcliffe1991), increase earthworm populations, and replace seasonal carbon and nitrogen losses (Schonbeck and Evanylo Reference Schonbeck and Evanylo1998b). In some cases, polyethylene and natural mulches may reduce insect and disease damage to crops (Hill et al. Reference Hill, Hankin and Stephens1982; Larentzaki et al. Reference Larentzaki, Plate, Nault and Shelton2008; van Toor et al. Reference van Toor, Till, James and Teulon2004), but higher soil moisture and residue levels may also increase incidence of disease (Govaerts et al. Reference Govaerts, Fuentes, Mezzalama, Nicol, Deckers, Etchevers, Figueroa-Sandoval and Sayre2007).
While each of these alternative weed management strategies may provide adequate crop yields, they represent trade-offs in agroecological effects. Our aim was to characterize multiple dimensions of these fundamentally different weed management strategies to provide farmers with improved understanding of which strategy or combination of strategies best matches their management goals. Economic performance of the systems (B Brown, ER Gallandt, AK Hoshide, unpublished data) and a related case-study narrative (B Brown, ER Gallandt, unpublished data) will be presented elsewhere.
Materials and Methods
Field experiments comparing several contrasting weed management strategies were conducted at the University of Maine Rogers Farm in Old Town, ME (44.93°N, 68.70°W) in 2014 and 2015 on separate fields, both Nicholville very fine sandy loam. Yellow storage onion (‘Cortland,’ Johnnys Selected Seeds, Winslow, ME) was used as the test crop, since it is commonly grown using each strategy and onion is highly sensitive to weed competition (Ware and McCollum Reference Ware and McCollum1975), which makes it a sensitive assay species to evaluate the effectiveness of each management system. Weather conditions during the study were typical for the region (data from www.ncdc.noaa.gov). Average temperature was 16.9 and 17.2 C, and total precipitation was 380 and 473 mm for the growing periods of 2014 and 2015, respectively (Supplementary Figure 1).
Our broad aim was to compare seedling-, seed-, and mulch-based weed management approaches. Ultimately, we chose six systems, described in detail in the following sections. Literature review and extensive interviews with farmers who have specialized in each weed management strategy (B Brown, ER Gallandt, unpublished data) were used to ensure that each strategy was implemented in a realistic manner.
Critical Period Weed Control
Weeding events were performed about every 2 wk for the duration of the critical period (Table 1). The critical period for direct-seeded onions is the first 8 to 12 wk following emergence (Brewster Reference Brewster2008; Menges and Tamez Reference Menges and Tamez1981; Wicks et al. Reference Wicks, Johnston, Nuland and Kinbacher1973). Since the onions were transplanted, we used an 8-wk critical period in 2014. However, yield loss in 2014 indicated the period was not long enough. In 2015, the critical period duration was adjusted as described by Knezevic et al. (Reference Knezevic, Evans, Blankenship, Van Acker and Lindquist2002), which extended it from 56 d in 2014 to 78 d in 2015.
Table 1 Schedule of field operations for six organic weed management strategies tested in Old Town, ME, in 2014 and 2015.

Zero Seed Rain
For this strategy, beds and paths were weeded about every 2 wk throughout the growing period (Table 1) with a goal of completely preventing weed seed inputs to the seedbank.
Polyethylene Mulch
Embossed black polyethylene mulch 1.2-m wide and 0.025-mm thick (FedCo Seeds, Waterville, ME) was applied with a mechanical applicator (Model 385PL, Bartville Welding Shop, Christiana, PA) prior to transplanting. Transplanting slits were 5-cm wide and were made with a trowel. Weeds in planting holes were hand pulled several times, while paths were cultivated more frequently (Table 1).
Polyethylene Mulch with Straw-Mulched Paths
Mulch was applied and beds were weeded in the same manner as above. Before planting, oat (Avena sativa L.) straw was applied to the paths at a rate of 20 Mg ha−1 (Schonbeck Reference Schonbeck1998). Weeds and volunteer oat emerging through the straw required hand pulling (Table 1).
Straw Mulch
Oat straw was applied more than 1 mo after transplanting (Table 1) to allow time for the soil to warm and for onions to grow large enough to withstand the disturbance of mulching. Straw was applied by hand at a rate of 20 Mg ha−1 (Schonbeck Reference Schonbeck1998). Straw was spread quickly in the paths, but in the beds it was carefully laid in bundles around the onions. Three to four weeding events were necessary prior to mulch application (Table 1). After the mulch was applied, one hand-pulling event was necessary to control weeds and volunteer oat.
Hay Mulch
Decaying timothy (Phleum pratense L.) hay, not suitable for horses, was obtained locally. Hay was applied and managed in the same manner as the straw mulch (Table 1).
Experimental Design
Each of the six weed management systems was implemented as a treatment in a randomized complete block design with four replicates. Each plot was 6.1-m long by 1.7-m wide. To ensure consistent competition and edge effects, a buffer bed of onions was transplanted on either side of each plot, and blocks were separated by an unplanted area of 2.4 m.
Field Preparation
Primary and secondary tillage were conducted using a rototiller and field cultivator, respectively. Preplanting fertilizer was applied based on soil test recommendations prior to secondary tillage. In 2014, 1,483 kg ha−1 soybean meal (7.0-0.5-2.3, FedCo Seeds, Waterville, ME), 908 kg ha−1 composted poultry litter (3-2-3, MicroStart 60, Perdue Agribusiness, Salisbury, MD), 454 kg ha−1 bone char (0-16-0, FedCo Seeds, Waterville, ME) provided 131-98-61 kg ha−1 (N-P-K). In 2015, 1,337 kg ha−1 soybean meal, 1,110 kg ha−1 dehydrated poultry litter, and 441 kg ha−1 bone char provided 127-100-64 kg ha−1 (N-P-K). All materials were measured and applied by hand.
Planting
Onions were started in late February in a heated greenhouse. Flats containing an organic potting mix (Light Mix, Living Acres, New Sharon, ME) were planted with 500 seeds per flat. In the period prior to transplanting, seedlings were fertilized three times with fish hydrolysate (2.9-3.5-0.3, FedCo Seeds, Waterville, ME) diluted to 1% concentration. Transplanting was done by hand in May (Table 1), following tillage and polyethylene mulch application. To reduce transplant shock, onion tops were trimmed to 13 cm the day prior to planting. Onions were bare-root transplanted with roots trimmed to 3 cm. Transplanting was done by block. Each plot contained one bed of three onion rows, with rows spaced 30-cm apart, planting holes 15-cm apart, and two onions per hole. An additional 408 kg ha−1 fish hydrolysate was applied immediately following transplanting.
Weed Management
Paths were weeded with wheel hoes, long-handled hoes were used closer to crop rows, short-handled hoes were used in the crop row, and hand pulling was only necessary for mulched plots. Buffer beds were unmulched and weeded every 2 wk throughout the season. Weed-free subplots 2.0-m long by 1.7-m wide were established within each main plot and were weeded at least weekly to ensure that weed competition did not affect yield.
Irrigation
Optimal soil moisture was maintained for each strategy using drip irrigation (Triple K Irrigation, Morenci, MI) with 16-mm-diameter emitters spaced every 30 cm, each with an output of 19 cc min−1. Irrigation was set up prior to transplanting, with one line per bed. Lines were laid on top of the soil by hand. Mulches were applied on top of irrigation lines. Soil water-holding capacity was determined by examining soil moisture over time after a heavy rain. To estimate the amount of irrigation needed to recharge the surface water deficit, volumetric soil moisture was measured weekly with a Delta-T HH2 Soil Moisture Meter with a 5.1-cm Theta Probe (Delta-T Devices, Burwell, UK) at four surface locations in each plot.
Data Collection
Effects of each weed management system on weeds, yield, and other variables were measured to comprehensively characterize each system.
Weeds
The percent of the ground covered with weeds was estimated visually at two random locations in the bed and two random locations in the paths of each plot using a 0.25-m2 quadrat. These assessments occurred regularly through the season at 7 and 16 dates in 2014 and 2015, respectively. End-of-season aboveground weed biomass was measured within 1 d of harvest using a 0.25-m2 quadrat placed randomly in the bed and randomly in the paths of each plot. Within the quadrat, all weeds were clipped at the soil surface and separated by species. Samples were placed in drying ovens for 1 wk at 46 C, and dried samples were weighed. Weed seeds were threshed from the dried weed samples and weighed. The total number of weed seeds was found by dividing the total seed mass of each species by the average mass of a single seed. Dried weeds and seeds were returned to their respective plots in November of each year, prior to snowfall. To evaluate the amount of weed seed in the organic mulches, in July of each year, four 100-g samples of each mulch were spread in a thin layer on flats of sterile potting mix (Pro-Mix® All Purpose Mix, Premier Tech, Quebec, Canada) and covered with a 1-cm layer of potting mix. Flats were watered regularly for 1 mo to encourage germination. Emerged seedlings were identified, recorded, and removed.
Early-Season Onion Leaf Length
Early-season onion leaf length was determined based on the average length of the longest leaf of four randomly chosen onions per plot on June 27, 2014, and July 9, 2015.
Yield
Onions were harvested at 70% “tops-down” on a per treatment basis. Harvest occurred in a 1-m by 1-m quadrat centered on the bed in a random location within each main plot and each weed-free subplot. Harvested onions were laid in a single layer on wire tables in a ventilated greenhouse to cure. Treatments harvested later in the season required a longer curing duration (Table 1), likely due to decreased temperature and decreased light intensity. Once all onion tops had dried to a brown papery state, roots and loose scales were removed, tops were cut 1 cm above the folding point in the neck, and onion bulbs were weighed. Visibly diseased onions were not included in yield data. Diseases were diagnosed by plant pathologist Jianjun Hao (School of Food and Agriculture, University of Maine).
Onion Storability
In December of each year, following an autumn cooling period in an unheated barn, four marketable onions from each plot were randomly selected to be stored in a walk-in cooler at 1.7 C and 75% relative humidity. The 2014 and 2015 onions were removed from cold storage May 19, 2015, and July 15, 2016, respectively. Firmness was tested using a Brookfield LFRA Texture Analyzer (Brookfield Ametek, Middleboro, MA) running at 4 mm sec−1 with a 5-cm-diameter acrylic compression head. When the head confronted an 8-g trigger it measured peak pressure required to continue for 1.5 mm. Onion pH and soluble solids were measured using an Orion Star A211 pH Meter (Thermo Fisher Scientific, Waltham, MA) and an Atago rx-5000i Refractometer (Atago U.S.A., Bellevue, WA), respectively, using blended samples from each plot.
Soil Temperature
Throughout the field experiments, soil temperature was measured at a depth of 5 cm once per week in the midafternoon using an Omega Model HH21 Microprocessor Thermometer with a Hanna Type K Thermocouple (Omega Engineering, Stamford, CT).
Carabid Beetles and Earthworms
Activity-density of granivorous carabid beetles (family Carabidae), including genera Amara, Bembidion, Clivinia, Harpalus, Poecilus, and Pterostichus, was measured by installing one pitfall trap in a random location in the bed of each plot using methods adapted from Birthisel et al. (Reference Birthisel, Gallandt and Jabbour2014). A 30-cm slit was cut in the polyethylene mulch treatments to facilitate installation. Traps were examined four times in 2014 and twice in 2015, with 24- to 48-h catch time for each event, all in early August. Results demonstrated carabid habitat preference, but due to relatively small plot sizes, high activity-density of some plots may correspond with a decrease in activity-density of other plots. Earthworm (phylum Annelida) abundance was measured by excavating a 15-cm by 42-cm by 20-cm volume between onion rows in each plot in late August, and sifting samples following Edwards and Lofty (Reference Edwards and Lofty1977).
Invertebrate Pests and Disease
Onion thrips (Thrips tabaci Lind.) populations were measured weekly in 2014 using a hand lens to count the thrips on eight random onion plants per plot. In 2015, the destructive sampling method of Larentzaki et al. (Reference Larentzaki, Plate, Nault and Shelton2008) was adopted, in which 1 onion plot−1 was removed and placed in a bag with 200 ml of 65% ethyl alcohol, agitated for 1 min, and poured into a 200-μm micron sieve to count dislodged thrips. The revised method was implemented once in June, July, and August. An action threshold of 3 thrips per leaf was not attained in either year. Additionally, in 2015, plots were examined for other arthropod and disease damage by four field-scouting events in August.
End-of-Season Soil Quality
In late August of each year, several soil-quality measurements were conducted. Soil samples collected to a depth of 15 cm from 10 random locations within the bed of each plot were analyzed for nitrate, ammonium, and microbial biomass by the University of Maine Soil Testing Service. In addition, soil water-infiltration rate was measured by recording the time required for 1 L water to soak into pre-wetted soil inside a 20-cm-diameter aluminum cylinder that had been inserted 8 cm into the soil (Anderson and Ingram Reference Anderson and Ingram1989). Depth to compaction was measured at four locations per plot using a penetrometer with a 1-cm tip that was inserted to a resistance of 2.1 Mpa (Duiker Reference Duiker2002), which was enough compaction to severely impair root growth (Bengough and Young Reference Bengough and Young1993). Since soil moisture may affect penetrometer results (Hummel et al. Reference Hummel, Ahmad, Newman, Sudduth and Drummond2004), measurements were taken 24 h after irrigation, when soil was uniformly at water holding capacity (Duiker Reference Duiker2002).
Legacy Effects of Treatment
In September 2014 and 2015, after all onions had been harvested, fields were rototilled, which typically causes minimal horizontal movement of weed seeds (Grundy et al. Reference Grundy, Mead and Burston1999), and oats (‘Aroostook,’ Johnnys Selected Seeds, Winslow, ME) were planted with a 3-m grain drill (Massey Ferguson, Duluth, GA) with 15-cm row spacing at a rate of 224 kg ha−1. In May 2015, prior to incorporation of oats, soil organic matter was tested from a homogenized sample of 10 soil cores per plot, to a depth of 15 cm. Immediately following soil sampling, oats were incorporated by rototilling and field cultivating.
In 2015 only, sweet corn (‘Xtra-Tender 3473,’ Johnnys Selected Seeds, Winslow, ME) was planted on June 4 with rows spaced 81-cm apart and plants 20-cm apart within rows. In this spacing, two rows were centered within the bounds of the previous year’s plots. Most fertilizer (1,318 kg ha−1 soybean meal, 412 kg ha−1 composted poultry litter, and 165 kg ha−1 bone char) was applied prior to secondary tillage, and additional fertilizer (659 kg ha−1 composted poultry litter and 329 kg ha−1 fish hydrolysate) was side-dressed on July 10, providing a total of 134-66-63 kg ha−1 (N-P-K). To protect the corn from crows, plots were covered with spun-bonded polypropylene (Agribon, San Luis Potosi, Mexico) until the corn was in the 3-leaf stage. The corn was managed uniformly across all previous treatments. Weed control consisted of a spring tine harrowing (Lely Industries NV, Series 982, Type 3, Maasland, Holland) on June 15; interrow cultivations with a 4-row Case International Model 183 (Case IH, Racine, WI) with Danish S-tines and 10-cm sweeps and gauge wheels on June 15, June 25, and July 7; and disk hillings (Weedmaster, Elomestari Oy, Kukkola, Finland) on June 25 and July 10. In addition to the field-wide cultivations, weed-free subplots were maintained by hand weeding on June 19, July 6, July 20, July 31, and August 12. Harvest of first ears occurred on August 24 and second ears on September 2. Entire plots were harvested for yield data. Yield was defined as the fresh mass of ears from both harvests. Corn earworm (Helicoverpa zea Boddie) damage was evaluated in 10 ears plot−1 on the second harvest date. Immediately following harvest, end-of-season aboveground weed biomass was sampled in the same manner as for the onions.
Statistical Analyses
All analyses were completed using JMP 10 (SAS Institute, Cary, NC). ANOVA was used to determine effects of weed management strategy on dependent variables. Due to several important Year*Treatment interactions, years were analyzed separately. Fisher’s protected LSD was used for means comparisons unless otherwise stated. An alpha level of 0.05 was used throughout. Data failing to meet assumptions for ANOVA were subjected to log, square-root, or Box-Cox (Box and Cox Reference Box and Cox1964) transformations as necessary. Data unable to pass assumptions after transformations were analyzed with the nonparametric Kruskal-Wallis test (Kruskal and Wallis Reference Kruskal and Wallis1952). Pairwise Wilcoxon signed-rank tests (Wilcoxon Reference Wilcoxon1945) were used for means comparisons as appropriate. If an effect of strategy was present in onion yield of weed-free subplots, edaphic variables that were affected by system were evaluated as main effects in a multiple linear regression model of onion yield. Stepwise backward selection was used to eliminate nonsignificant variables, followed by evaluation with adjusted R2 and Akaike information criterion with correction for finite sample sizes (Akaike Reference Akaike1974). To evaluate the effects of strategy on subsequent crops, orthogonal contrasts were used to evaluate weed biomass and sweet corn yield of the critical period system versus all others.
Results and Discussion
In-Season Effects of Weed Management Strategy
As will be discussed, the six weed management strategies in this experiment varied in their effectiveness, as demonstrated through weed control and onion yield. But they also differed in effects on soil health, edaphic invertebrates, and implications for subsequent crops.
Weeds
The most abundant weed species included common lambsquarters (Chenopodium album L.), smooth crabgrass [Digitaria ischaemum (Schreb.) Schreb. ex Muhl.], and low cudweed (Gnaphalium uliginosum L.). The percent of the ground area covered by weeds fluctuated based on timing of weeding events (Figure 1). But for the critical period system, weed cover sharply increased at the end of the season, reflecting uncontrolled weed growth in late July, August, and early September. The reduction in weed cover in 2015 compared with 2014 was expected, because we extended the weeding period in that year. Likewise, end-of-season weed biomass was greatest in the critical period system in both years, but was reduced by 41% in 2015 (Table 2). Weed biomass was least in the zero seed rain, straw mulch, and hay mulch treatments, commensurate with the increased labor required for those systems (B Brown, ER Gallandt, AK Hoshide, unpublished data). Comparatively, polyethylene-mulched plots had greater weed biomass, likely due to the infrequent weeding events, as well as the difficulty controlling weeds emerging from the planting holes and the margins of the polyethylene. Smaller planting holes would likely have reduced weed emergence but increased labor costs associated with hand transplanting (B Brown, ER Gallandt, AK Hoshide, in review). The apparent increase in weed cover (Figure 1) and biomass (Table 2) in the polyethylene systems from 2014 to 2015, may relate to presence of more monocotyledonous weeds (unpublished data), which were more challenging to remove from planting holes (Figure 1).
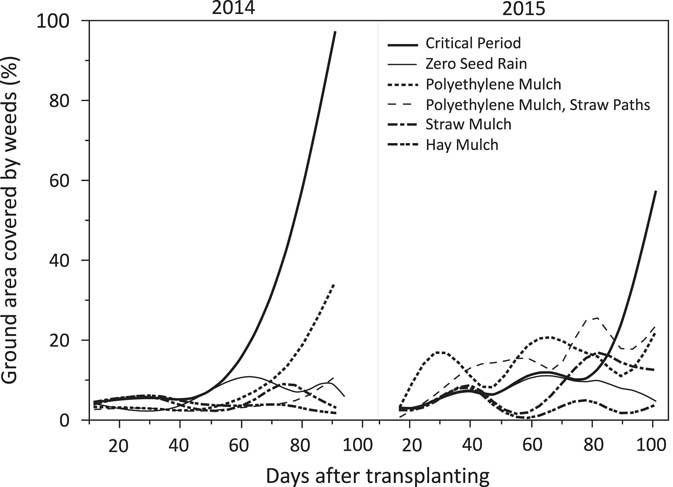
Figure 1 Ground area covered by weeds for each weed management system at 7 and 16 dates in 2014 and 2015, respectively. Mean weed cover of the beds and paths of each system were plotted by date and smoothed with a cubic spline (lambda=0.05).
Table 2 Effects of weed management strategy on end-of-season aboveground weed biomass and weed seed production.Footnote a
a Data were collected immediately after onion harvest in 2014 and 2015. Within each column, means followed by the same letter are not significantly different.
b Means separated using Fisher’s protected LSD test at P≤0.05.
c Box-Cox transformed for ANOVA and Fisher’s protected LSD test at P≤0.05. Reported values untransformed.
As expected, weed seed production was greatest for the critical period treatment and close to zero in the zero seed rain system (Table 2). Average weed seed production of the critical period systems was 25,359 seeds m−2. Indeed, while the majority of organic vegetable farms evaluated in New England had less than 10,000 seeds m−2 (Jabbour et al. Reference Jabbour, Gallandt, Zwickle, Wilson and Doohan2014a), one farmer who often follows the critical period strategy had a germinable weed seedbank of nearly 40,000 seeds m−2 (B Brown, ER Gallandt, unpublished data).
Seeds were also imported in the natural mulches. Germinable seed assays showed that the oat straw mulch contained a large amount of oat seed (contributing 711 germinable seeds m−2, mostly oats), even though it was baled after oat harvest. In the field, oat seed was able to germinate and emerge from within the mulch, which required extra weed management and likely affected onion yield. In contrast, hay mulch included 991 germinable seeds m−2, but in the field, very few weeds were able to emerge through the mulch (Figure 1). Similarly, weed seeds imported by hay mulch were not problematic in organic tomato production (Schonbeck Reference Schonbeck1998).
Yield
Onion yield varied by system in 2014, with zero seed rain and natural-mulched systems giving the greatest yields (Table 3). Compared with the hay mulch system, polyethylene mulching and critical period treatments demonstrated a yield loss. Onion yield in weed-free subplots also varied by strategy in 2014, with polyethylene-mulched treatments yielding the least, possibly due to higher soil temperatures (Figure 2), which accelerated early-season leaf growth (Table 3; also observed by Anisuzzaman et al. Reference Anisuzzaman, Ashrafuzzaman, Ismail, Uddin and Rahim2009) and likely contributed to premature senescence and early harvest (Table 1). However, in 2015, onion yields were similar across strategies in main plots and weed-free subplots (Table 3). This result reflects the lengthened weed control period (Table 1) for the critical period treatment and reduced soil temperatures (Figure 2), which may have allowed more bulbing time before senescence and harvest (Table 1). Lack of statistical differences between systems may also relate to high variability in yield (Table 3), which may reflect the relatively small sample sizes.

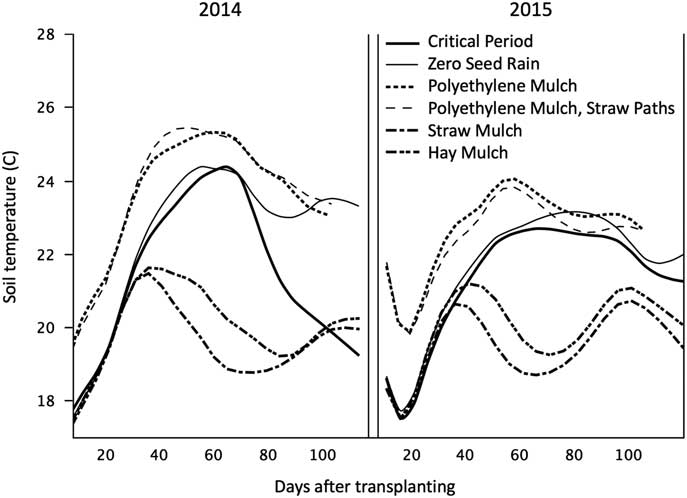
Figure 2 Afternoon soil temperature measured at a depth of 5 cm for each weed management strategy in 2014 and 2015. Each line represents weekly afternoon soil temperature readings smoothed with a cubic spline (lambda=0.05). Readings were discontinued after harvest of each treatment.
Table 3 Effects of weed management strategy on early onion growth and yield in 2014 and 2015.Footnote a

a Within each column, means followed by the same letter are not significantly different. Yield data are presented with 95% confidence intervals in parentheses.
b Data were untransformed for ANOVA. If significant, means were separated using Fisher’s protected LSD test. Both tests were conducted at P≤0.05.
c Main effects tests performed with Kruskal-Wallis tests and means comparisons performed with Wilcoxon paired tests, both at P≤0.05.
In our related economic analysis, onion yield was more important than labor and materials costs in determining profitability in an enterprise budget for small-scale organic onion production (B Brown, ER Gallandt, AK Hoshide, unpublished data). The two highest-yielding systems, zero seed rain and hay mulch, were most profitable despite incurring the greatest weeding labor and total labor costs, respectively. Mulched systems were less risky than cultivated systems, reflecting less variable yields (Table 3).
After harvest, onions with apparent defects were evaluated for disease. Diseases included black mold (Aspergillus niger Tiegh.), bacterial soft rot (Dickeya chrysanthemi (Samson et al. Reference Samson, Legendre, Christen, Fischer-LeSaux, Achouak and Gardan2005)), and blue mold (Penicillium spp.); however, disease incidence was very low and not affected by weed management strategy.
Following cold storage, soluble solids levels, indicative of onion sugars and storability (McCallum et al. Reference McCallum, Clarke, Pither-Joyce, Shaw, Butler, Brash, Scheffer, Sims, Vanheusden, Shigyo and Havey2006), were greatest in the highest-yielding treatments of 2014 (Table 4). Onion firmness, a desirable postharvest trait (Larsen et al. Reference Larsen, Saxena and Cramer2009), was greatest in unmulched systems in 2014 (Table 4). However, these onion-quality parameters were not affected by treatment in 2015. Onion pH, sprouting, mold, and rot were also examined but were unaffected by weed management strategy (unpublished data).
Table 4 Effects of weed management strategy on onion bulb firmness and soluble solids after a period of cold storage.Footnote a
a Within each column, means followed by the same letter are not significantly different.
b Means separated using Fisher’s protected LSD test at P≤0.05.
c Log transformed for ANOVA at P≤0.05. Reported values untransformed.
d Main effects tests performed with Kruskal-Wallis tests at P≤0.05.
Soil Temperature
Soil temperature was greatest under black polyethylene mulch (Figure 2), consistent with Hill et al. (Reference Hill, Hankin and Stephens1982). Late in the season, soil temperatures in the zero seed rain system approached those of polyethylene-mulched systems, likely due to the soil remaining unshaded by weeds. Conversely, soil temperature in the critical period system dropped as late-season weeds emerged. Soil temperature in natural-mulched plots cooled after mulch was applied, as reported elsewhere (Teasdale and Mohler Reference Teasdale and Mohler1993).
Irrigation
Soil moisture was maintained optimally for each strategy by drip irrigation. In 2014, the critical period and zero seed rain treatments received 5,600 cc water m−2, while polyethylene and natural-mulched plots required 13% less irrigation. In 2015, the zero seed rain system required the most irrigation (11,000 cc m−2), while the critical period, straw mulch, hay mulch, polyethylene mulch, and polyethylene mulch with straw paths treatments required 11%, 20%, 22%, 45%, and 47% less water, respectively.
Carabid Beetles and Earthworms
Activity-density of carabid beetles, including Harpalus rufipes Deg., a well-known seed predator (Gallandt et al. Reference Gallandt, Molloy, Lynch and Drummond2005), was greatest in the critical period system (Table 5), possibly due to the habitat provided by weeds, but activity-density was least in the natural mulch systems. Indeed, weed seed predation has been positively correlated with living vegetative cover but negatively correlated with residue (Birthisel et al. Reference Birthisel, Gallandt, Jabbour and Drummond2015), possibly due to hindrance of carabid mobility (Thomas et al. Reference Thomas, Brown and Kendall2006). Earthworms were more abundant in natural-mulched systems (Table 5), as found by Schonbeck and Evanylo (Reference Schonbeck and Evanylo1998b). Earthworms are generally beneficial for increasing soil humus and aeration (Edwards and Lofty Reference Edwards and Lofty1977; Hopp and Hopkins Reference Hopp and Hopkins1946).
Table 5 Effects of weed management strategy on beneficial invertebrates in 2014 and 2015.Footnote a
a Measurements were conducted in August of each year. Within each column, means followed by the same letter are not significantly different. Means separated using Fisher’s protected LSD test at P≤0.05.
Invertebrate Pests and Disease
Invertebrate pests and onion diseases included onion thrips, onion maggot (Delia antiqua Meigen), cutworm species (family Noctuidae), saltmarsh caterpillar (Estigmene acrea Drury), and purple blotch (Alternaria porri Ellis), but occurrence was highly variable and not affected by weed management system (unpublished data).
End-of-Season Soil Quality
End-of-season soil quality was generally most favorable for the mulched treatments (Table 6). Penetrometer tests measuring soil compaction varied by strategy in 2014, with mulched plots demonstrating less compaction, possibly due to decreased soil crusting (Schonbeck Reference Schonbeck2012) or improved soil aggregation (Tindall et al. Reference Tindall, Beverly and Radcliffe1991). Water-infiltration rate, a measure expected to be inversely related to compaction, was not affected by strategy in 2014 [F(5,15)=1.65, P=0.206] or 2015 [F(5,15)=0.773, P=0.584]. Soil nitrate was greatest in polyethylene-mulched systems in both years, a result observed elsewhere in the literature (Schonbeck and Evanylo Reference Schonbeck and Evanylo1998b), possibly due to decreased leaching in heavy rains or due to higher soil temperature causing increased mineralization (Waggoner et al. Reference Waggoner, Miller and DeRoo1960). Ammonium was also tested but did not differ by strategy (unpublished data). Microbial biomass, an indicator of soil health, was greatest in critical period and natural-mulched treatments in 2014, likely due to the reduced late-season soil disturbance and higher residue of these treatments (Islam and Weil Reference Islam and Weil2000). It is unclear why the polyethylene-mulched treatments did not also demonstrate increased microbial biomass.
Table 6 Effects of weed management strategy on four measures of soil quality in 2014 and 2015.Footnote a
a Within each column, means followed by the same letter are not significantly different.
b Means separated using Fisher’s protected LSD test at P≤0.05.
c Box-Cox transformed for ANOVA and Fisher’s protected LSD test at P≤0.05. Reported values untransformed.
Soil-Quality Effects on Yield
In 2014, onion yield in weed-free conditions was affected by weed management strategy (Table 3). To investigate which factors, other than weeds, affected yield, a linear regression model of onion yield was created with select soil-related main effects (Table 7). The model was reduced to earthworm abundance and mean soil temperature. Earthworms may have positively affected yield due to their previously discussed effects on soil quality. Soil temperature was likely related to the early senescence of onions in the black polyethylene–mulched systems. Indeed, in Maine, lighter-colored polyethylene mulches are beginning to be used to avoid causing premature onion senescence (J Kafka and R Johanson, personal communication).
Table 7 The significance of soil-related parameters on the onion yield of main plots in 2014.
a Stepwise backward elimination of least significant parameters was used to reduce the model based on the adjusted R2 and Akaike information criterion with correction (AICc) for finite sample sizes (Akaike Reference Akaike1974).
Legacy Effects
Soil Organic Matter
In May of 2015, following the initial onion crop, residue from the natural mulches was still evident despite rototilling and winter cover cropping. However, soil organic matter analyses did not indicate any difference between weed management strategies [F(5,15)=1.09, P=0.405]. It is expected that long-term use of natural mulches would increase soil organic matter. From our related case studies, one mixed-vegetable grower using natural mulches for many years now has soil organic matter over 20% and has reduced fertilizer input (B Brown, ER Gallandt, unpublished data).
Effects on Subsequent Crop Yield
Yield of sweet corn in weed-free subplots did not differ by strategy in the year following onions (F(5,15)=1.28, P=0.323). This indicates that a single year of each weed management strategy did not affect soil quality enough to affect yield of the following crop. In main plots, where weed control was achieved with tractor cultivation but no hand weeding, former critical period plots resulted in 685 g m−2 of aboveground weed biomass, likely related to increased seed production from the previous year (Table 2), while the other plots had less weed biomass [F(1,15)=27.1, P<0.001], with a mean of 117 g m−2. Likely related to weed competition, the yield of former critical period plots was 22% less than the other treatments [F(1,15)=10.8, P=0.004], which yielded 16.6 Mg ha−1 on average. It is also possible that the reduced end-of-season soil nitrate level in the critical period system (Table 6) contributed to the sweet corn yield loss. Enterprise budgets for the sweet corn operations showed that the yield loss in the plots where the critical period system was implemented the prior year resulted in a loss of over 2,500 USD ha−1 compared with the other systems (B Brown, ER Gallandt, AK Hoshide, unpublished data), and it is likely the loss would have been greater in higher-value crops.
Management Implications
In the context of small-scale, organic production of onions, a long-season weed-sensitive crop, the zero seed rain and natural mulching strategies performed favorably in terms of weed control and onion yield. This result reflects the more intensive management involved with these strategies. Unexpectedly, despite incurring the highest labor costs, the zero seed rain and hay mulch systems were most profitable (B Brown, ER Gallandt, AK Hoshide, unpublished data). A key difference was that labor requirements were evenly spread for the zero seed rain system, while labor was concentrated in late June to early July for the hay mulch system (B Brown, ER Gallandt, AK Hoshide, unpublished data). In more weed-tolerant crops that are less responsive to intensive management, it is likely that the critical period and polyethylene mulching systems, would be more profitable due to reduced costs. Furthermore, these strategies would likely be more feasible than the other strategies on a large scale due to less dependence on hand labor.
In addition to profitability, farmers consider the ecological effects of management (Robertson et al. Reference Robertson, Gross, Hamilton, Landis, Schmidt, Snapp and Swinton2014). Perhaps the most influential ecological effect was the abundant weed seed production of the critical period system (Table 2), which likely affected the subsequent crop. Conversely, weed seed production was least in the zero seed rain, straw mulch, and hay mulch systems, which would likely reduce future weeding costs (Norris Reference Norris1999). Unfortunately, such preventative, long-term management is less common than seedling-focused management, because growers often believe that weeds are inevitable (DeDecker et al. Reference DeDecker, Masiunas, Davis and Flint2014; Wilson et al. Reference Wilson, Tucker, Hooker, Lejeune, Doohan, Tucker and Hooker2015), perhaps due to an overestimation of seed longevity (Jabbour et al. Reference Jabbour, Zwickle, Gallandt, Mcphee, Wilson and Doohan2014b).
Mulched treatments generally performed favorably in measures of soil health (Table 6). However, materials costs for polyethylene- and natural-mulched systems were around US$500 and US$4,000 ha−1 greater than cultivated systems, respectively (B Brown, ER Gallandt, AK Hoshide, unpublished data). The straw mulch treatment did not perform to its potential, given the volunteer oats. Perhaps farmers could grow their own straw to ensure seed-free mulch or store bales outdoors for the season prior to application to encourage fatal germination of seeds in the mulch.
Although a single weed management strategy may resonate with a farmer’s management “philosophy” (DeDecker et al. Reference DeDecker, Masiunas, Davis and Flint2014), we suggest the strategies presented herein be used based on the management goals for a particular field or crop. While the length of the critical period, the amount of weeding labor required, and the response to mulch may vary by crop, many of the ecological effects of these weed management systems would likely apply to other crops. Furthermore, we have presented each strategy separately, but approaches could be combined to provide multiple benefits. For example, a zero seed rain approach could be used simultaneously with natural mulching to achieve a seedbank reduction while benefiting from the soil-aggrading properties of mulch.
We conclude that each weed management system presents trade-offs in effects on agroecology (Tables 2–6). Therefore, the “best” strategy depends on grower management goals (B Brown, ER Gallandt, unpublished data). It is our aim that this paper clarifies the ecological benefits and drawbacks of each strategy so that growers may adjust their management appropriately.
Acknowledgements
We are grateful to farm manger Joseph Cannon, our field technicians Thomas Macy, Anthony Codega, and Isaac Mazzeo, and interns Lydia Fox, Diego Grossman, and Lucia Helder. We also thank Jianjun Hao for plant pathology assistance and Balunkeswar Nayak and Katherine Davis-Dentici for assistance with onion-quality analysis. Funding for the work reported here was provided by a graduate student grant from the U.S. Department of Agriculture (USDA) Northeast Sustainable Agriculture Research and Education Program entitled “Balancing Economy and Ecology: A Systems Comparison of Leading Organic Weed Management Strategies” (project GNE14-072-27806). Maine Agricultural & Forest Experiment Station Publication Number 3544. This project was supported by the USDA National Institute of Food and Agriculture, Hatch (or McIntire-Stennis, Animal Health, etc.) project number H-1-00473-11 through the Maine Agriculture & Forest Experiment Station.
Supplementary material
To view supplementary material for this article, please visit https://doi.org/10.1017/wsc.2017.34