


Introduction
Tympanoplasty to close a tympanic membrane perforation is a common surgical intervention. Eustachian tube dysfunction and altered ventilation of the tympanic cavity is believed to play an important role in the pathogenesis of chronic ear disease.Reference Lalwani1,Reference Tos, Stangerup, Holm-Jensen and Sørensen2–Reference Prasad, Hegde, Prasad and Meyappan4 It is therefore clinically relevant to assess the ventilation of the middle ear and mastoid air cells in patients with chronic ear disease. Computed tomography (CT) can be used to assess pneumatisation and ventilation; however, it exposes patients to cumulative radiation injury. This is particularly relevant for young patients who may need repeated scans and are therefore prone to the evolution of neoplasms due to CT scans.Reference Miglioretti, Johnson, Williams, Greenlee, Weinmann and Solberg5
A typical tympanometry report includes the external ear canal volume and the compliance of the tympanic membrane in an A-shaped curve (type A curve). The peak of the curve represents the pressure point (measured in decapascals) where the tympanic membrane has the highest compliance. Mathematically, the tympanometry curve is derived from the acoustic admittance (i.e. the ease with which the sound from the tympanometry probe is transmitted through the sound conducting system).Reference Silman and Emmer6 The volume of the sound conducting system is also derived from the admittance. In cases with a perforation in the tympanic membrane, this allows the measurement of the total volume of the external ear canal, the middle ear and mastoid air cells. The tympanometry curve in these cases is flat (type B curve).
In this study, we investigated tympanometry as a non-invasive and cost-effective measurement to determine the degree of ventilation of the middle ear and the mastoid and compare the tympanometry volume in patients with tympanic membrane perforations to the three-dimensional (3D) volumetry of ventilated mastoid bones on CT scans.
Previous studies have already assessed the correlation between tympanometry and plain X-rays or CT scans, and they reported mixed results.Reference Lindeman and Holmquist7,Reference Casale, Shaffrey and Kesser8 Plain X-rays are of historic and rather limited use in the calculation of mastoid air cells today because CT allows a much more detailed view. However, computed tomography scans greatly vary in resolution size from slices as thin as 0.1 mm (cone beam CT) to thicker slices of 2.5 mm. Such low-resolution CT scans were used in previous studies.Reference Casale, Shaffrey and Kesser8 Yet, in lower resolution scans, small mastoid air cells may not be detected properly and are omitted during the overall calculation process. High-resolution sub-millimetre CT scans are preferred to evaluate temporal bone pathologies.
We hypothesise that total tympanometry volume correlates with ventilated mastoid air cells on CT scans. Another goal was to calculate a cut-off value to determine the tympanometry volume that allowed us to predict a well-ventilated mastoid air cell system.
Materials and methods
Inclusion and exclusion criteria
We retrospectively identified patients with a tympanic membrane perforation who underwent surgery between 2014 and 2019 and had received traditional CT or cone beam CT imaging scans to exclude further pathology. These patients also underwent tympanometry measurements prior to tympanoplasty. Approval was obtained from our ethical committee (approval number: HSC 2019-00573).
Tympanometry
Measurements were performed with an Interacoustics Titan module (Diatec, Dortmund, Germany) at 226 Hz prior to surgery. The tympanic membrane perforation caused a flat curve (type B). Total volume of the tympanometry was recorded for comparison to the CT scan volumetry of the ventilated external ear canal, middle-ear space and mastoid air cells.
Computed tomography scans
High-resolution CT and cone beam CT scans had a (reconstructed) slice thickness of between 0.15 and 0.90 mm and an in-plane resolution of between 0.13 and 0.38 mm. Scans were performed on Siemens Somatom (CT) and Axiom (cone beam CT) scanners (Siemens, Munich, Germany) with a matrix size of 512 × 512 and a peak voltage of 120 kV.
Three-dimensional volumetry
The volumetry of the ventilated mastoid air cells, middle ear and external ear canal was performed in 3D Slicer imaging software (version 4.10.2, Boston, USA) in the editor and label statistics modules. First, the mastoid bone was extracted by manual cropping of the original image, and then a thresholding algorithm helped to delineate the ventilated mastoid air cells, the middle ear and the external ear canal by using a density threshold between −1024 Hounsfield units (HU) and −500 HU (Figures 1 and 2). In a final quality control step, islands outside the measured sites were manually removed. The external ear canal was included in the calculation up to the transition from its bony to its cartilaginous part (see Figure 1b).

Fig. 1. (a) Segmentation on computed tomography (CT) of the air-filled mastoid cells and middle ear at the level of the lateral semicircular canal (LCC) and (b) at the level of the bony external acoustic canal (EAC). The external acoustic canal was included in the segmentation as far laterally as the junction between its bony and cartilaginous part. The two CT scan slices (a and b) serve as examples. The total volume was calculated from all CT scan slices containing mastoid air cells, middle ear and external acoustic canal (see three-dimensional visualisation in Figure 2). Maximum CT slice thickness was 0.9 mm. IAC = internal acoustic canal; TB = temporal bone; ET = Eustachian tube; TMJ = temporomandibular joint
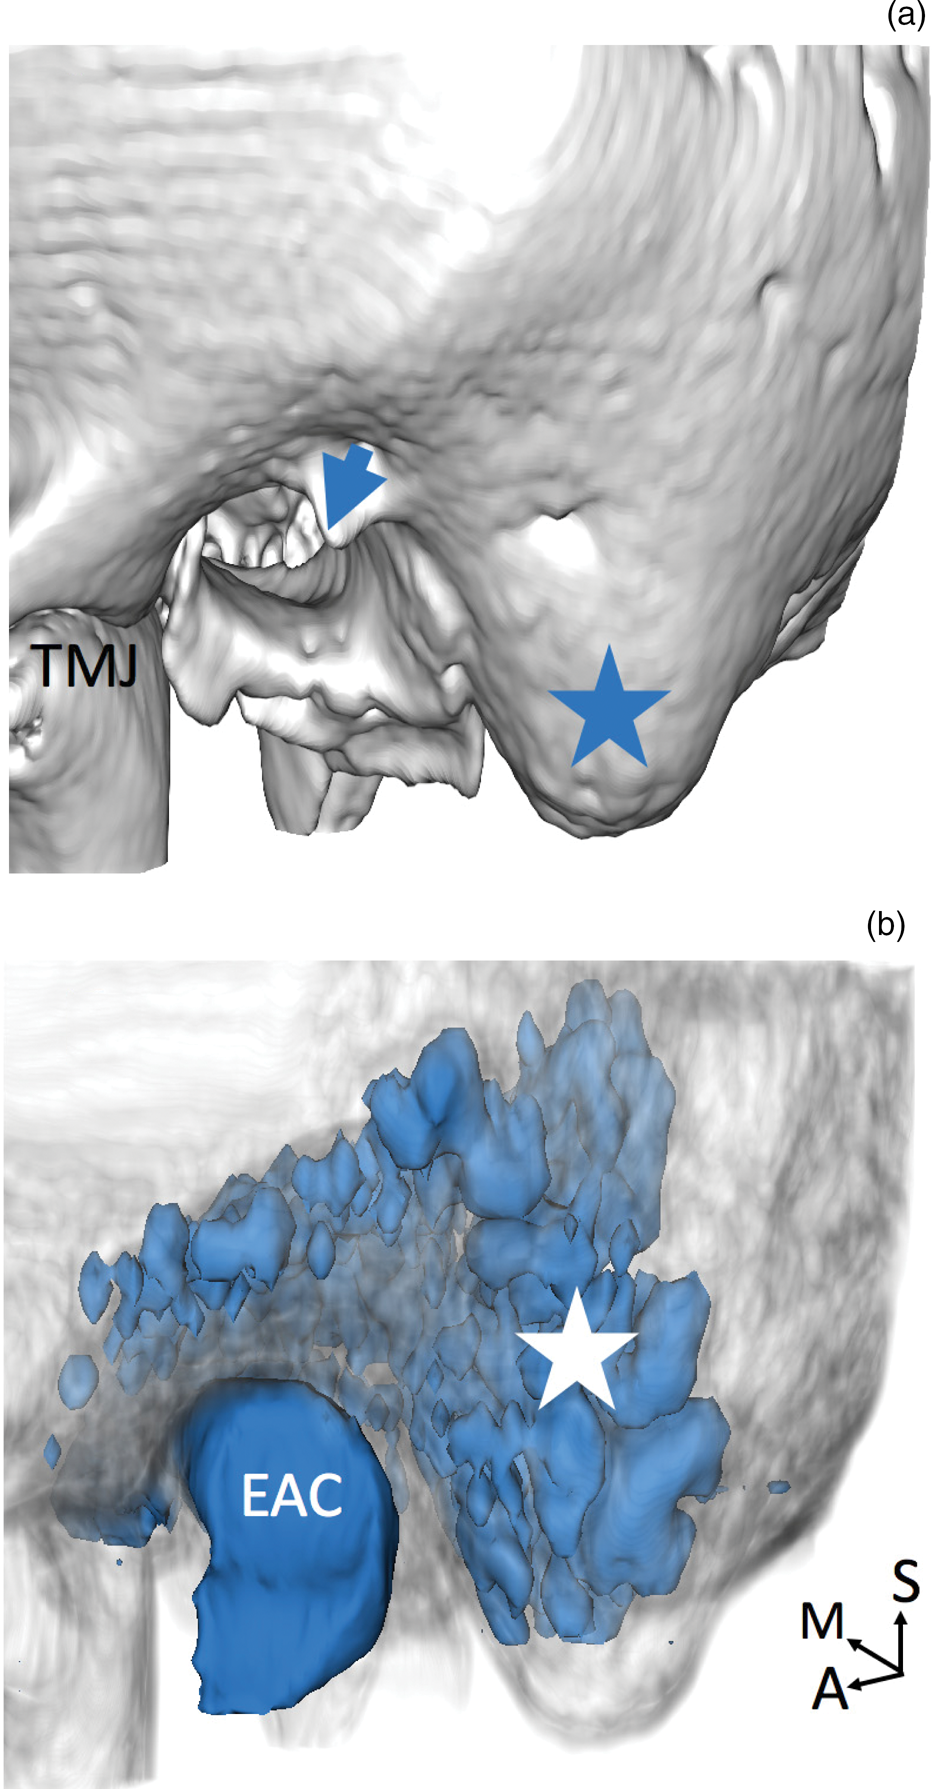
Fig. 2. Three-dimensional (3D) visualisation of the temporal bone and segmented mastoid air cells, middle ear and external acoustic canal (EAC). (a) Shows a lateral view of the temporal bone with the mastoid tip (star) and spine of Henle (arrow). (b) Shows the same angle of view of the same temporal bone but displayed in a translucent way, with the 3D reconstruction of the mastoid air cell system (white star), middle ear and external acoustic canal seen shining through the temporal bone. TMJ = temporomandibular joint; A = anterior; M = medial; S = superior
Statistical analysis
Statistical analysis was performed in Microsoft Excel® spreadsheet software (version 15.20). Correlation between CT scan volumetry and total tympanometry volume was determined by linear regression. Computed tomography scans were classified by the first author (L Epprecht) into two groups of good and poor mastoid ventilation. Unpaired t-test was used to analyse the significance of comparison between these two groups. A two-sided p-value of less than 0.001 was considered significant. A cut-off value of 2 ml in total tympanometry volume was tested by a four-table analysis for its sensitivity, specificity, and negative and positive predictive values for predicting good and poor ventilation on CT scans.
Results
Subjects
Twenty ears were examined in 16 patients (4 patients with bilateral disease) with an equal distribution between the left and right side. Mean subject age was 45 ± 21 years, and 12 patients (60 per cent) were female. For detailed patient characteristics see Table 1. Because patients were prepared for surgery by cleansing their ears, all tympanic membrane perforations were dry at the time of investigation.
Table 1. Patient characteristics

EAC = external acoustic canal (bony part); CT = computed tomography; cc = cubic centimetre; F = female; M = male
Mean volumetric values
Mean tympanometry volume and 3D CT scan volume were 3.28 ± 2.08 ml and 2.44 ± 1.68 ml, respectively. Computed tomography scan volumetry yielded subdivided volumes of 0.59 ± 0.41 ml for the external ear canal, 0.41 ± 0.25 ml for the middle ear and 1.44 ± 1.46 ml for the mastoid air cells.
Correlation of volumes
There was a high correlation between 3D CT volume and tympanometry volume (r = 0.78; p < 0.001; see Figure 3).

Fig. 3. Scatter plot of tympanometry volume (x-axis) and total volume as measured on computed tomography (CT, y-axis) by threshold segmentation. The dotted line visualises the regression analysis (r = 0.78; p < 0.001). One outlier at (0.9, 4.2) represents case number 13 (see Table 1). The outlier was included in the analysis. The most probable explanation for the measurement is an oddly placed tympanometry earpiece.
Predicting good and poor ventilation
From CT scans, cases were classified according to mastoid air cell ventilation into groups with good and poor ventilation (9 and 11 cases, respectively). The groups with good and poor mastoid ventilation had a mean tympanometry volume of 3.7 ± 1.5 ml and 1.41 ± 0.96 ml, respectively (99 per cent confidence interval (CI) for good ventilation: 2.42–4.99 ml; 99 per cent CI for poor ventilation: 0.67–2.15 ml; p < 0.001). A cut-off value of 2 ml in tympanometry volume was used for the prediction of good or poor ventilation on CT and yielded 89 per cent sensitivity, 91 per cent specificity, 91 per cent negative predictive value and 89 per cent positive predictive value.
Discussion
Key results
This study showed that tympanometry volumes and the volume of aerated middle ear and mastoid air cells on high-resolution CT scans are highly correlated in patients with dry tympanic membrane perforations. A tympanometry volume more than 2 ml had a positive predictive value of 89 per cent for predicting good mastoid ventilation on CT scans. Based on these findings, there is the potential to reduce the number of CT scans needed in uncomplicated cases of tympanic membrane perforations prior to surgery. Volume measurements from tympanometry allow the outcome of tympanoplasty procedures to be prospectively analysed in regard to graft take rate and hearing outcome in patients with an intact and mobile ossicular chain. The hypothesis that patients with chronic suppurative otitis media and poorly pneumatised and ventilated temporal bones may present with less favourable outcomes can be addressed prospectively by pre-operatively investigating their overall volume using a simple and cost-effective tympanometry measurement.
Mastoid air cell system
Our results reflect the pathophysiology of the mastoid air cell system. The tympanic membrane perforation allows access and measurement to the volumes behind the tympanic membrane. Recent work on mastoid air cell mucosa shows that the interconnected mastoid air cells might have an active role in middle-ear pressure regulation.Reference Jensen PV and Gaihede9,Reference Gaihede, Dirckx, Jacobsen, Aernouts, Søvsø and Tveterås10 Our data corroborate the fact that a reservoir of air volume harboured by the mastoid air cells is functionally connected to the middle ear. The extent of the air reservoir can vary between patients. In our view, it is therefore important to include this measurement in future studies investigating the role of gas exchange by the middle ear and mastoid air cell mucosa. As opposed to a CT scan as a static image on which mucosal tissue is poorly appreciated, tympanometry can detect subtle longitudinal changes in volume (i.e. changes of mucosal swelling over time).
Practical considerations
In summary, tympanometry can enable a non-invasive and cost-effective measurement of middle ear and mastoid ventilation. The equipment needed for this measurement is readily available in otology clinics today. This is clinically interesting because the mastoid air cell system can be assessed without the need to involve ionising X-rays from CT scans, and the volumetric result is immediately calculated as a routine measurement by each tympanometer. Results from such measurements allow pre-operative assessment of ventilation of the mastoid and better disease classification as described earlier by Linder et al.Reference Linder, Shah, Martha, Röösli and Emmett11 A tympanometry volume of more than 2 ml is a good predictor of a well-ventilated mastoid.
• Traditionally, ventilation of the middle ear and mastoid air cells is assessed on computed tomography (CT)
• The volume of the ventilated middle ear and mastoid air cells can also be assessed by tympanometry
• Tympanometry entails no ionising X-rays compared with CT scans
• This study showed a high correlation between tympanometry and CT scans in regard to middle ear and mastoid air cell volumes
• A tympanometry volume more than 2 ml is a good predictor of a well-ventilated middle ear and mastoid air cells on CT scans
In 1997, Jacob Sadé showed that the risk of developing chronic secretory otitis media or atelectasis related to the degree of pneumatisation, stating that a smaller degree of pneumatisation correlated with higher chance of chronic middle-ear disease and ventilation tube insertion.Reference Sadé and Fuchs12 The failure rate of myringoplasty procedures is quite low, varying between 10 and 15 per cent. Although various factors have been analysed, the role of mastoid pneumatisation and aeration can now be prospectively analysed in large cohorts of patients. Recently, the cholesteatoma (‘ChOLE’) classification for cholesteatomas has also addressed the issue of mastoid pneumatisation and ventilation.Reference Linder, Shah, Martha, Röösli and Emmett11 However, with cholesteatomas, tympanometry cannot properly measure ventilation and CT scans remain a ‘gold standard’.
Limitations
The limitations of this study should be mentioned. It is possible that partial volume effects in the CT scans affected the volumetric result. Partial volume effects are generated when air and bone coincide in the same voxel. Because of the resolution, the resulting density in that voxel is neither that of air nor of bone but the mean of both. One recent study examined ex-vivo mastoid air cell volume on micro-CT with a resolution of 35 μm.Reference Cros, Knutsson, Andersson, Pawels, Borga and Gaihede13 The data were then down-sampled to a resolution of 0.95 mm, and there was no difference in the volumes measured. We are therefore confident that our results from CT scans with a maximum slice thickness of 0.90 mm are only minimally affected by partial volume effects.
The mean volumes measured by tympanometry were higher than the volumes obtained in the 3D CT volumetry. We explain this by the fact that the tympanometry probe in the external ear canal usually does not reach the transition zone from the cartilaginous part to the bony part of the external ear canal (Figure 4). However, we used this transition zone in our 3D CT volumetry as the outer most border in order to get standardised measurements. Patients with no measurable tympanometric volume were excluded. We assume that in these patients the pressure generated by the tympanometer passively opened the Eustachian tube, and therefore recordings were not possible. Whether these patients actually classify as healthy with a low Eustachian tube opening pressure remains a topic of debate. Although it is generally accepted that tympanometry is less costly than a CT scan, we did not perform a cost analysis for this study.

Fig. 4. Visualisation of a tympanometry earpiece (arrow) in the external acoustic canal (EAC) on computed tomography (CT). The dotted line in the external acoustic canal shows the end of the bony part of the external acoustic canal. The bony part of the external acoustic canal was included into the volume measurements on CT, whereas the cartilaginous part was not. This was done in order to ensure consistent measuring.
Conclusion
Tympanometry volumes and the volume of ventilated mastoid air cells on CT scans are highly correlated in patients with dry tympanic membrane perforations. In patients with a tympanometry volume above 2 ml, there is an 89 per cent chance they have good mastoid ventilation. This may help reduce the need for pre-operative CT scans in uncomplicated cases with tympanic membrane perforations and can aid patient counselling regarding the risk of recurrence.
Competing interests
None declared


