1. Introduction
The Oligocene of New Zealand broadly corresponds to an interval of slow regional subsidence and a period of maximum transgression of the Zealandia subcontinent. The deposits predominantly comprise variably calcareous siltstones and marls with locally thick development of limestones, and more rarely, sandstones. In the Taranaki Basin (Fig. 1) the deposits are highly condensed in the west, and thicken eastwards towards the contemporaneous landmass (Fig. 1; King & Thrasher, Reference King and Thrasher1996; Hood et al. Reference Hood, Nelson and Kamp2003a; Strogen et al. Reference Strogen and King2014).
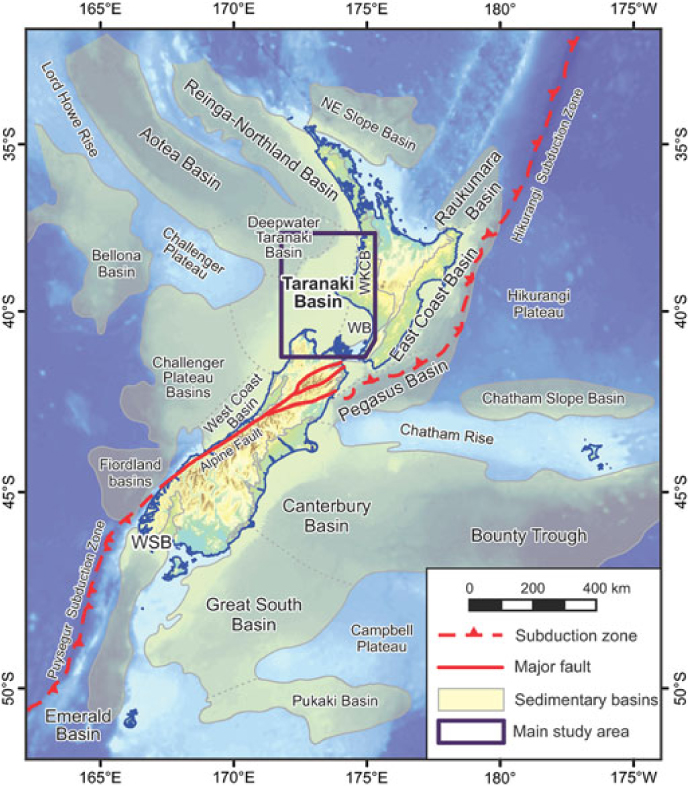
Fig. 1. Location map of the greater New Zealand region (Zealandia), showing bathymetry, distribution of major sedimentary basins and structural features, and localities named in the text. The main study area is indicated by the box. WB – Wanganui Basin; WKCB – Waikato–King Country Basin; WSB – Western Southland Basin.
The Late Eocene to Early Miocene interval is of interest for two reasons. Firstly, it marks the transition from transgressive to regressive sedimentation, as the basin morphed from a passive- to active-margin setting, associated with the inception of the Australian–Pacific convergent plate boundary along the eastern margin of Zealandia (Fig. 1; King et al. Reference King, Naish, Browne, Field and Edbrooke1999; King, Reference King2000). As such, understanding stratigraphic development during this interval can significantly advance our knowledge of the tectonic development of both the Taranaki Basin and wider Zealandia. Secondly, Oligocene strata form an important part of petroleum systems in the Taranaki Basin. Thickly developed fine-grained facies form regional top seals, while locally occurring limestones and sandstones form reservoirs in a number of commercial hydrocarbon discoveries.
Despite the economic and tectonic significance of Late Eocene – Early Miocene strata, and numerous well penetrations in the Taranaki Basin, this interval remains relatively poorly understood. Parts of the Oligocene succession have been the focus of previous studies (Hood et al. Reference Hood, Nelson and Kamp2003a,b; B. Hopcroft, unpub. M.Sc. thesis, Univ. Waikato, 2009), and Strogen et al. (Reference Strogen, Bland, Nicol and King2014) presented a reappraisal of the regional Oligocene palaeogeographic evolution in the Taranaki Basin. However, these studies have been relatively broad in nature, and have not attempted to break the Oligocene succession down into stratigraphic sequences, correlated around the basin. Moreover, the majority of studies have focused on Oligocene units cropping out in adjacent areas, such as the Waikato–King Country Basin (Nelson, Reference Nelson1978; Tripathi & Kamp, Reference Tripathi and Kamp2008; Kamp et al. Reference Kamp, Tripathi and Nelson2014) and the West Coast Basin (Riordan et al. Reference Riordan, Reid, Bassett and Bradshaw2014), often in isolation to facies development in the offshore portions of the basin.
In our study, we have attempted a regional correlation of Late Eocene – Early Miocene sediments in the Taranaki Basin using representative wells. This well data has been used to develop a better understanding of the distribution and development of facies through this interval, which will provide insights into both seal/reservoir potential and tectonic signals related to the development of the Australian–Pacific plate boundary zone.
2. Geological setting
The Taranaki Basin covers an area of c. 100,000 km2, predominantly offshore beneath the present-day shelf, to the west of New Zealand’s North Island (Figs 1, 2). It contains up to 11 km of mid-Cretaceous to Cenozoic strata, and is bounded along its eastern margin by the buried, >450 km long, crustal-scale Taranaki Fault System (TFS; King & Thrasher, Reference King and Thrasher1996; Stagpoole & Nicol, Reference Stagpoole and Nicol2008). It is one of a series of connected Cretaceous–Cenozoic basins that extend along the western margin of New Zealand (Fig. 1; King et al. Reference King, Naish, Browne, Field and Edbrooke1999), including the Reinga-Northland and West Coast basins (Fig. 1). Immediately east of the TFS lie the Waikato–King Country and Wanganui basins, which typically contain thinner and younger infill than the Taranaki Basin.
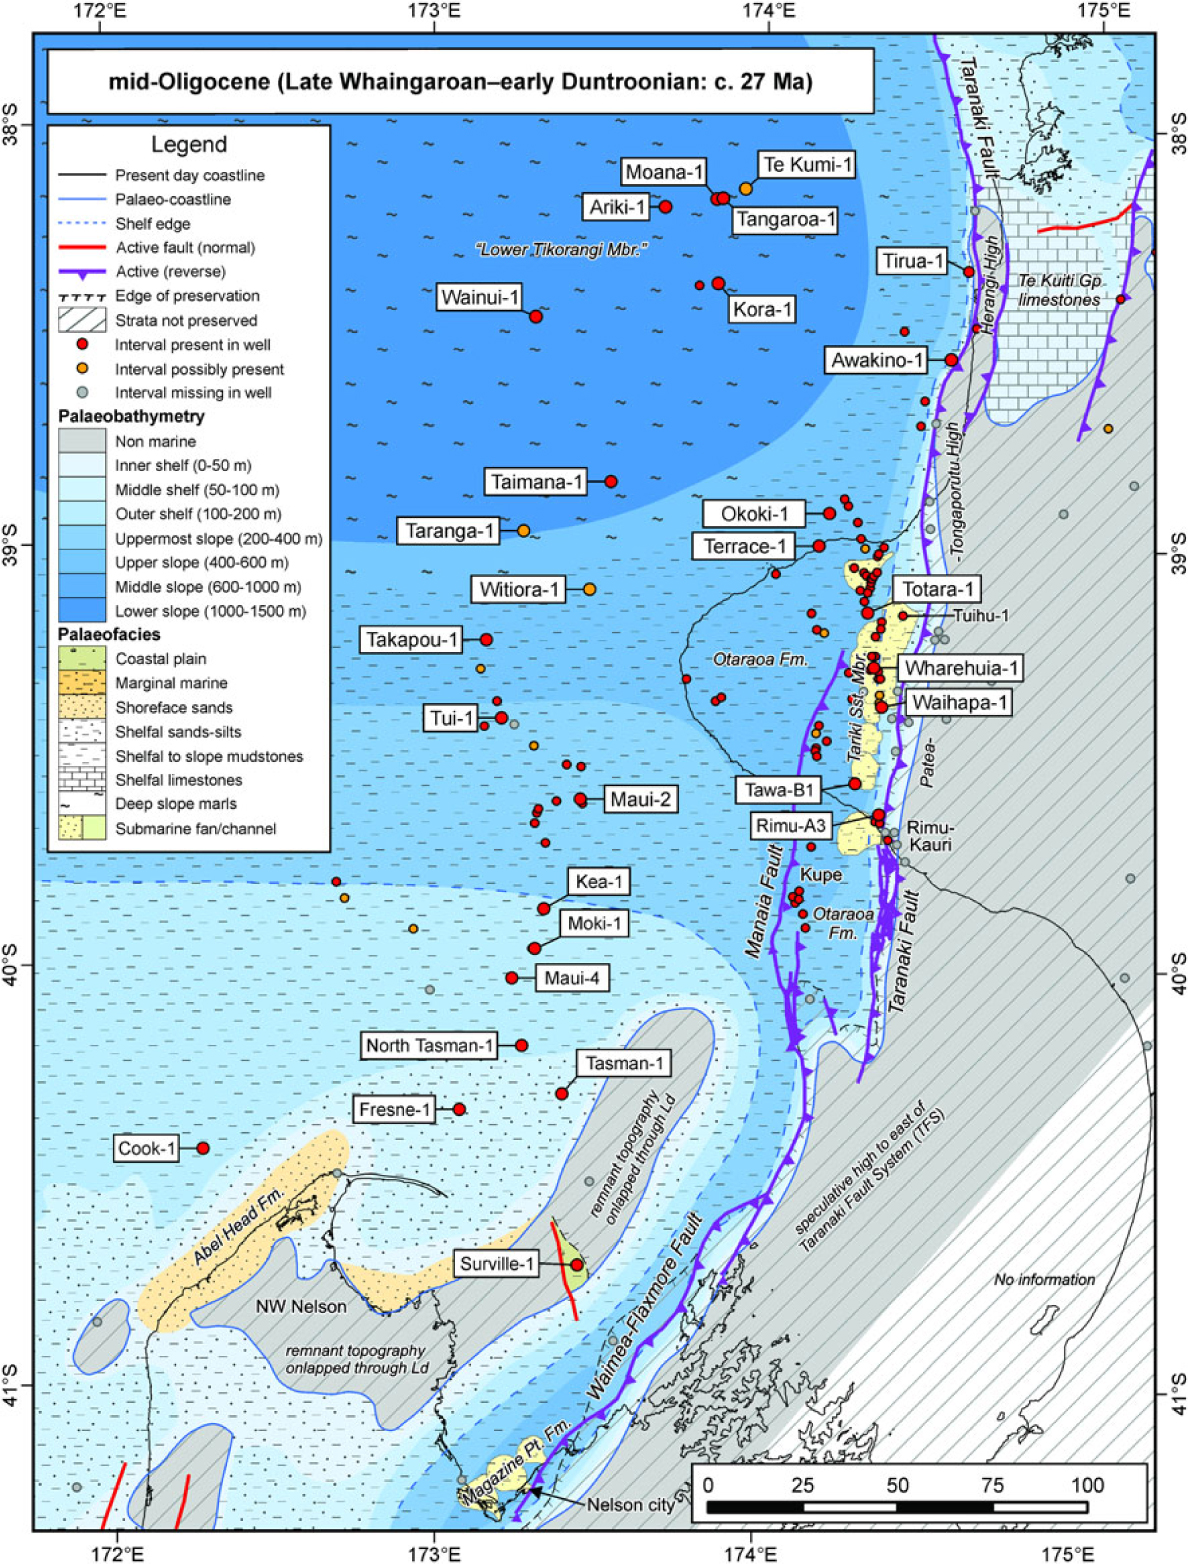
Fig. 2. Mid-Oligocene (latest Whaingaroan–Duntroonian) palaeogeography of the Taranaki Basin, after Strogen et al. (Reference Strogen and King2014), showing location (highlighted by boxes) of the study wells used in transects (Figs 9–11) and other features/places named in the text.
The Taranaki Basin and wider Zealandia region have experienced a complex tectonic history. Long-lived Paleozoic and Mesozoic subduction, terrane accretion and magmatism was followed by separation from eastern Gondwana during Cretaceous rifting, and finally by tectonics associated with convergence across the Australian–Pacific plate boundary that now bisects New Zealand (e.g. Walcott, Reference Walcott1978; Kamp, Reference Kamp1986; Bradshaw, Reference Bradshaw1989; King & Thrasher, Reference King and Thrasher1996; King, Reference King2000; Wood & Stagpoole, Reference Wood and Stagpoole2007; Strogen et al. Reference Strogen, Seebeck, Nicol and King2017). Across the study region, the pre-Neogene tectonic history has been variably overprinted by Australian–Pacific convergent plate boundary tectonics (King & Thrasher, Reference King and Thrasher1996; King, Reference King2000; Ghisetti & Sibson, Reference Ghisetti and Sibson2006; Stagpoole & Nicol, Reference Stagpoole and Nicol2008; Reilly et al. Reference Reilly, Nicol, Walsh and Seebeck2015). Eastern and southern parts of the Taranaki Basin are within the active plate boundary deformation zone, whereas western parts have remained relatively undeformed since latest Paleocene time.
2.a. Late Eocene – Early Miocene lithostratigraphy
The Late Eocene to Early Miocene stratigraphy of the Taranaki and surrounding basins is summarized in Figure 3. In the Taranaki Basin, the Late Eocene stratigraphy is well established, consisting of the proximal Kapuni Group (Mangahewa and McKee formations) and distal Moa Group (Turi and Tangaroa formations), and is not discussed further here (see King & Thrasher, Reference King and Thrasher1996; Higgs et al. Reference Higgs, King, Raine, Sykes, Browne, Crouch and Baur2012a). Table 1 describes the Oligocene–Early Miocene Ngatoro Group, which is divided into the Otaraoa, Tikorangi and Taimana formations (King & Thrasher, Reference King and Thrasher1996), as well as a number of informal units. Owing to lateral facies variations and changes in the use of terminology through time, the Oligocene lithostratigraphy in the Taranaki Basin is inconsistent and ambiguous. However, while we recognize that the lithostratigraphic scheme requires amendment, it is beyond the scope of the current paper to address this. We therefore primarily refer to biostratigraphically (Fig. 4) correlated units (U1–U6) through the remainder of this paper. The only outcrop exposures of Oligocene strata within the Taranaki Basin occur in NW Nelson (Figs 2, 5a, b). The range of petrographic facies encountered in Oligocene units is illustrated in Figures 5 and 6, showing the wide range of mixed siliciclastic–carbonate rocks present.
Fig. 3. Summarized Mid Eocene – Early Miocene stratigraphy for the Taranaki and surrounding basins, illustrating lithostratigraphic units (generally formations, groups on left), highly simplified lithology and regionally mapped seismic horizons. Taranaki Basin modified after King & Thrasher (Reference King and Thrasher1996) and New Zealand Petroleum & Minerals (2013). Waikato Basin modified after Kamp et al. (Reference Kamp, Tripathi and Nelson2014). All other basins modified after King et al. (Reference King, Naish, Browne, Field and Edbrooke1999). Seismic horizons after Strogen & King (Reference Strogen and King2014) and Bull et al. (Reference Bull, Hill, Strogen, Arnot, Seebeck, Kroeger and Zhu2016). CM – coal measures; KS – ‘Kauri Sandstone’; Ma – Mahoenui Gp; MK – McKee Fm; Mo – Moki Fm; MP – Magazine Point Fm; MS – Matapo Sandstone Mbr; Tg – Tangaroa Fm; TL – Tikorangi Limestone; TS – Tariki Sandstone Mbr; Wm – Waitemata Gp.

Fig. 4. Middle Eocene – Early Miocene timescale, showing comparison of international and New Zealand stages and substages, and criteria for their identification. After Morgans et al. (Reference Morgans, Beu, Cooper, Crouch, Hollis, Jones, Raine, Strong, Wilson, Wilson and Cooper2004) and Raine et al. (Reference Raine, Beu, Boyes, Campbell, Cooper, Crampton, Crundwell, Hollis, Morgans and Mortimer2015b). HO – highest occurrence; LO – lowest occurrence.
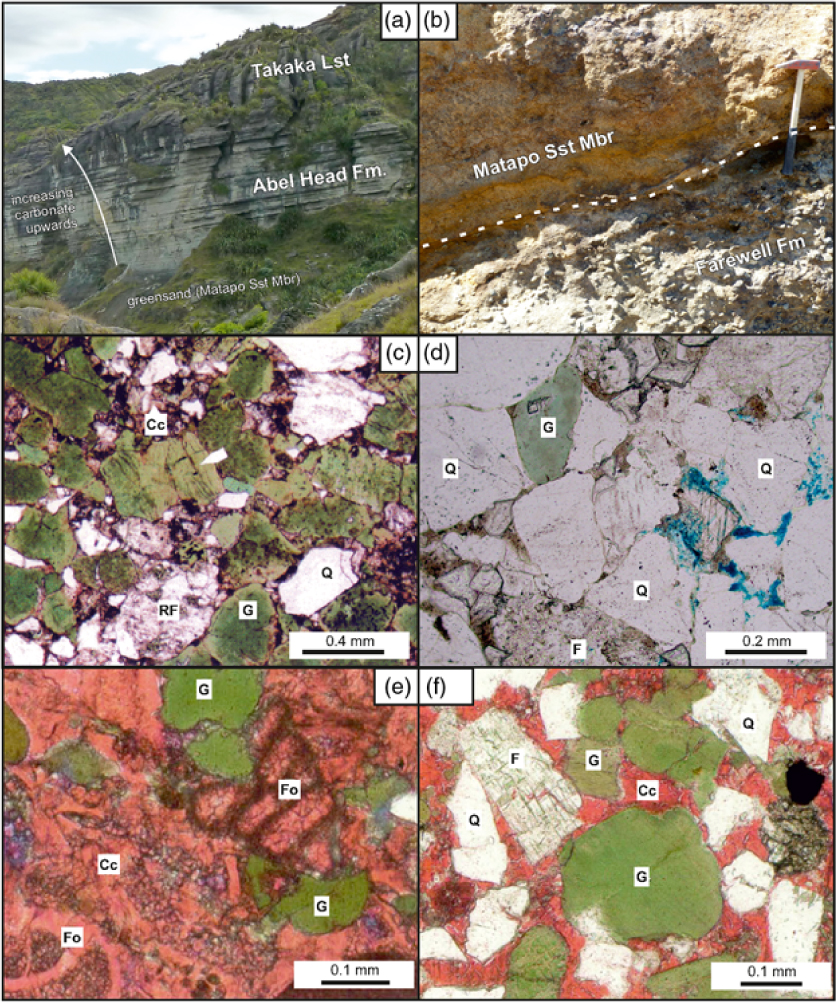
Fig. 5. Plates illustrating the basal Oligocene unconformity (CS4) and glauconitic beds. (a) Oligocene outcrop from NW Nelson, between South Head and Sharks Head. Thick basal greensand unit; its unconformable contact with the underlying Paleocene is obscured by vegetation. Above is a gradual transition from the sandstone-dominated Abel Head Formation to the carbonates of the Takaka Limestone, with calcareous beds becoming more common and thicker upwards. Total outcrop thickness ∼100 m. (b) Unconformity between the Paleocene Farewell Formation and the weathered glauconitic Oligocene Matapo Sandstone Member, Pillar Point, NW Nelson. Hammer for scale is 40 cm long. (c) Toru-1, 3765.4 m, Matapo Sandstone Member: thin-section view of a highly glauconitic sandstone with subordinate quartz, feldspar and lithic fragments. (d) Onaero-1, 3478 m, Matapo Sandstone Member: thin-section showing minor glauconite within a quartzo-feldspathic sandstone. (e) Kauri-A1, 3443 m, ‘Rimu Limestone’: thin-section showing glauconitic limestone with common skeletal grains. (f) Kauri-A1, 3442 m, ‘Rimu Limestone’: thin-section of a highly glauconitic sandstone with other grains including common quartz and feldspar. Q – quartz; RF – rock fragment; G – glauconite; Cc – calcite; Fo – foraminifera. Sources: (c) Martin & Baker (Reference Martin, Baker and Crocker1991); (d) Higgs et al. (Reference Higgs, Strogen, Griffin, Ilg and Arnot2012b); (e, f) Core Lab (2003).
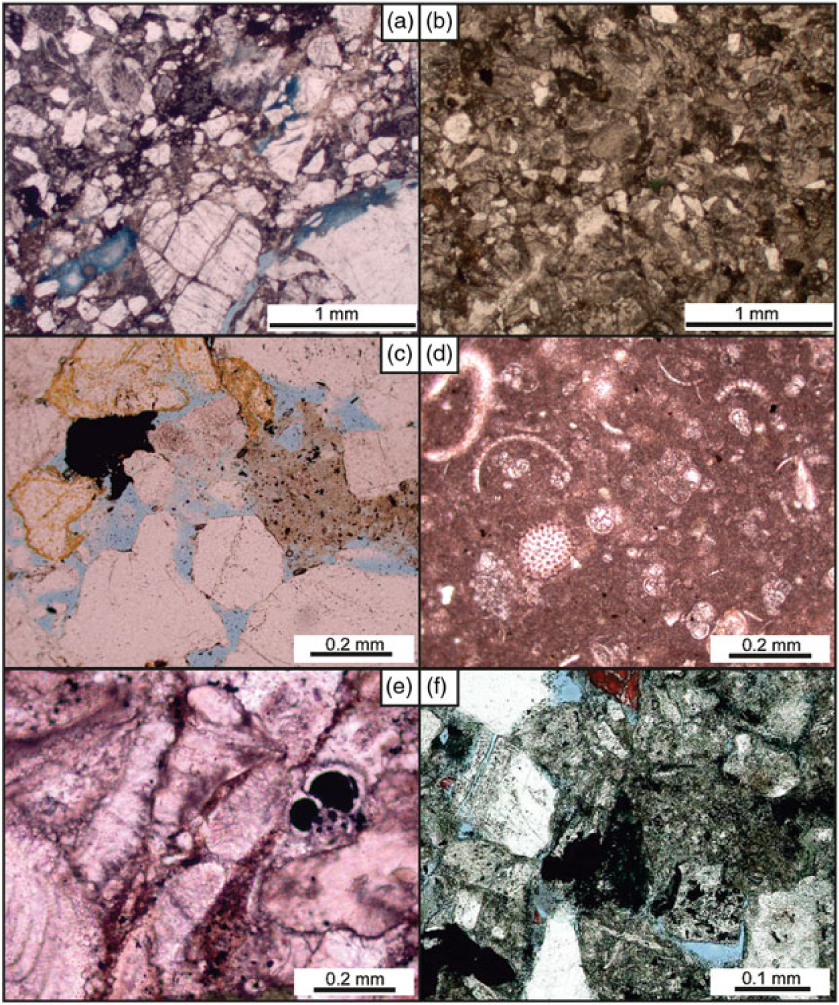
Fig. 6. Thin-section microphotographs illustrating the Oligocene mixed siliciclastic–carbonate system. (a, b) Awakino-1, 2169.5 and 2181.5 m, ‘Tikorangi Limestone’ (lLwh) showing variably sandy nature of foredeep megafacies; time-equivalent to the Tariki Sandstone Member. (c) Tariki-4A, 2717 m, Tariki Sandstone Member (lLwh) showing the quartzo-feldspathic and locally carbonate-poor composition of these submarine-fan facies. (d) Witiora-1, 3050 m, ‘Tikorangi Limestone’ (?Lwh) showing the micrite-dominated, condensed nature of these basinal megafacies with common foraminifera and echinoid spines. (e) Hu Road-1A, 3040 m, Tikorangi Limestone (Lw) illustrating common bryozoan, foraminifera and larger bioclasts within this shallow-marine grainstone. (f) Kauri-E4, 2565.85 m, ‘Kauri Sandstone’ showing a highly lithic composition compared with the older Tariki Sandstone Member (c). Sources: (a, b) GNS Science data; (c, d) Higgs et al. (Reference Higgs, Strogen, Griffin, Ilg and Arnot2012b); (e, f) Harris & Frankiewicz (Reference Harris and Frankiewicz2004).
Table 1. Summary of the Oligocene–Early Miocene stratigraphy of the Taranaki Basin
3. Data sources and methodology
This paper documents the geographic, stratigraphic and facies variability of Late Eocene to Early Miocene-aged strata in the Taranaki Basin. The work is based on borehole data, primarily from internal GNS Science studies (https://www.gns.cri.nz) and from data held by New Zealand Petroleum and Minerals (NZP&M; https://data.nzpam.govt.nz). A total of 44 petroleum wells (Fig. 2) with good-quality wireline log and biostratigraphic data have been used, demonstrating representative intervals from the latest Eocene (Runangan) to Early Miocene (Altonian). Data include stratal thickness, lithology, age and palaeobathymetry. See Table S1 in the online Supplementary Material for full well details. Much of the Oligocene section is either very thin (western areas) or heavily faulted (northeast), and so seismic data was not used as a primary input into this study. The entire Oligocene section (Fig. 7) is encompassed by only two regionally mapped seismic horizons (P50 and N05; Fig. 3), and so correlation of U1–U6 is below seismic resolution across much of the basin.
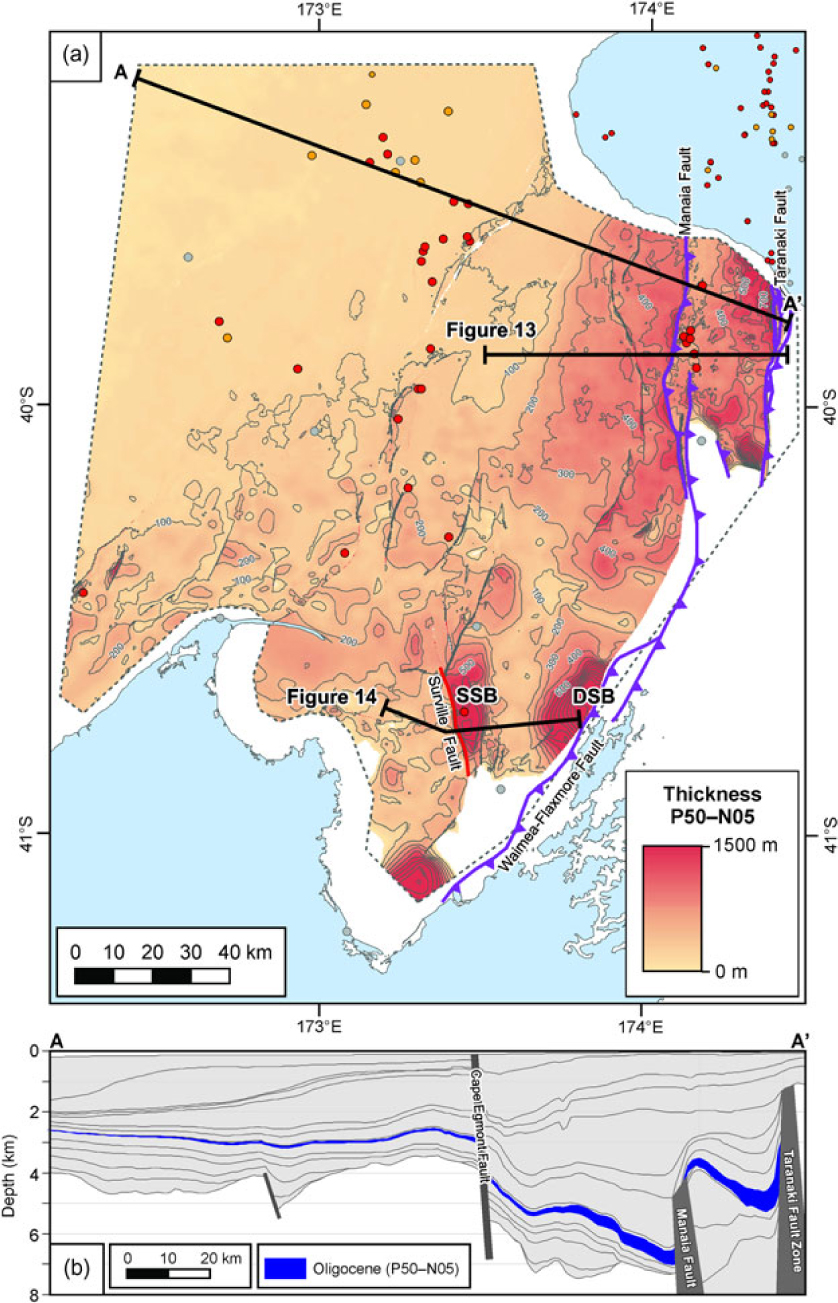
Fig. 7. (a) Thickness of the Oligocene, encompassed by regional horizons P50 and N05, from regional seismic mapping (after Bull et al. Reference Bull, Hill, Strogen, Arnot, Seebeck, Kroeger and Zhu2016). Major faults active during the study interval also shown; southern Manaia and Waimea–Flaxmore faults after King & Thrasher (Reference King and Thrasher1996). The location of the seismic sections shown in Figures 13 and 14 are also indicated. Well and fault symbology as in Figure 2. DSB – D’Urville Sub-basin; SSB – Surville Sub-basin. (b) Cross-section through the depth model of Bull et al. (Reference Bull, Hill, Strogen, Arnot, Seebeck, Kroeger and Zhu2016), drawn along line A–A’, with the Oligocene interval highlighted.
3.a. Biostratigraphy
In New Zealand, Paleogene stage boundaries are based primarily on the stratigraphic ranges of selected benthic and planktonic foraminifera (Hornibrook et al. Reference Hornibrook, Brazier and Strong1989; Morgans et al. Reference Morgans, Beu, Cooper, Crouch, Hollis, Jones, Raine, Strong, Wilson, Wilson and Cooper2004) calibrated to the International Geologic Time Scale (Gradstein et al. Reference Gradstein, Ogg, Schmitz and Ogg2012) following Raine et al. (Reference Raine, Beu, Boyes, Campbell, Cooper, Crampton, Crundwell, Hollis and Morgans2015a,b). Palynology is used as the primary dating tool for non- and marginal-marine strata (Raine, Reference Raine1984; revised in Raine, Reference Raine and Cooper2004). Foraminifera have been the main dating tool used in this study, although palynology has been used in a few wells to date non-marine strata. Local New Zealand stages covering the Late Eocene – Early Miocene interval, the criteria for their recognition and a comparison with the international timescale, are provided in Figure 4. This summarizes results from Hornibrook et al. (Reference Hornibrook, Brazier and Strong1989), Berggren et al. (Reference Berggren, Kent, Swisher, Aubry, Berggren, Kent, Aubry and Hardenbol1995), Morgans et al. (Reference Morgans, Scott, Beu, Graham, Mumme, St George and Strong1996, Reference Morgans, Beu, Cooper, Crouch, Hollis, Jones, Raine, Strong, Wilson, Wilson and Cooper2004), Cooper (Reference Cooper2004) and Nelson et al. (Reference Nelson, Lee, Maxwell, Maas, Kamp and Cooke2004).
Existing biostratigraphic data have been collated for all 44 study wells, and include quantitative and qualitative data, primarily for foraminifera, that provide age control for correlating units, and palaeoenvironmental information (Table 2) to aid log facies interpretation. Re-examination of several samples helped better define the lower part of the Runangan to Early Whaingaroan interval; these new interpretations are provided on the full well correlation panels in the online Supplementary Material (Figs S1–S4).
Table 2. Facies criteria used for latest Eocene to earliest Miocene strata

Facies are displayed adjacent to logs and biostratigraphy data in the online Supplementary Material (Figs S1–S4)
3.b. Geophysical well logs, cores and facies analysis
Conventional wireline log data have been examined from all study wells, with raw data sourced from NZP&M (https://data.nzpam.govt.nz). Log suites include gamma ray (GR), calliper (cali), neutron-density (N-D), sonic (DT) and resistivity (R). Data quality is generally good, although there are some data gaps and log-offsets close to casing points, which are marked for reference on the log plots.
Few conventional cores have been cut through Oligocene strata in the Taranaki Basin because of the dominant fine-grained lithologies. However, cores are available through the Matapo and Tariki Sandstone members, and through parts of the Tikorangi Formation (see Table S1 in the online Supplementary Material for details). Detailed work has previously been undertaken on numerous cores from the Tariki Sandstone Member (Higgs et al. Reference Higgs and Morgans2001, Reference Higgs, King, Browne and Morgans2004a) and the Tikorangi Formation (Hood et al. Reference Hood, Nelson and Kamp2003a,b), and results from these studies are incorporated here. Although representing only a fraction of the total Oligocene succession in the Taranaki Basin, the cored intervals nevertheless provide detailed facies and petrographic insight to some significant parts of the stratigraphy.
Facies have been assigned to Late Eocene – Early Miocene strata in all study wells. Given the paucity of core, the scheme is highly simplified and based on lithology interpreted from wireline log motifs and cuttings descriptions, with palaeobathymetry data derived largely from foraminifera (Hayward, Reference Hayward1986). A general guide to the criteria used to assign log facies is presented in Table 2. These log facies are grouped into three main proximal to distal facies associations as follows: (1) shallow marine, (2) shelfal and (3) bathyal; and four main lithologies, (1) siltstone–mudstone, (2) marl or calcareous siltstone, (3) limestone and (4) sandstone.
3.c. Stratigraphic correlation and mapping
Regional-scale stratigraphic correlation between study wells was undertaken, with correlation datums guided by wireline log response/profiles tied to biostratigraphy. Only a few key surfaces (Figs 8–11) have been picked because of poor resolution of biostratigraphic dating through the studied interval. Owing to the thin nature of the Oligocene in distal areas and complex post-Oligocene faulting in some thicker proximal areas, seismic correlation was not useful for subdivision of the study interval.
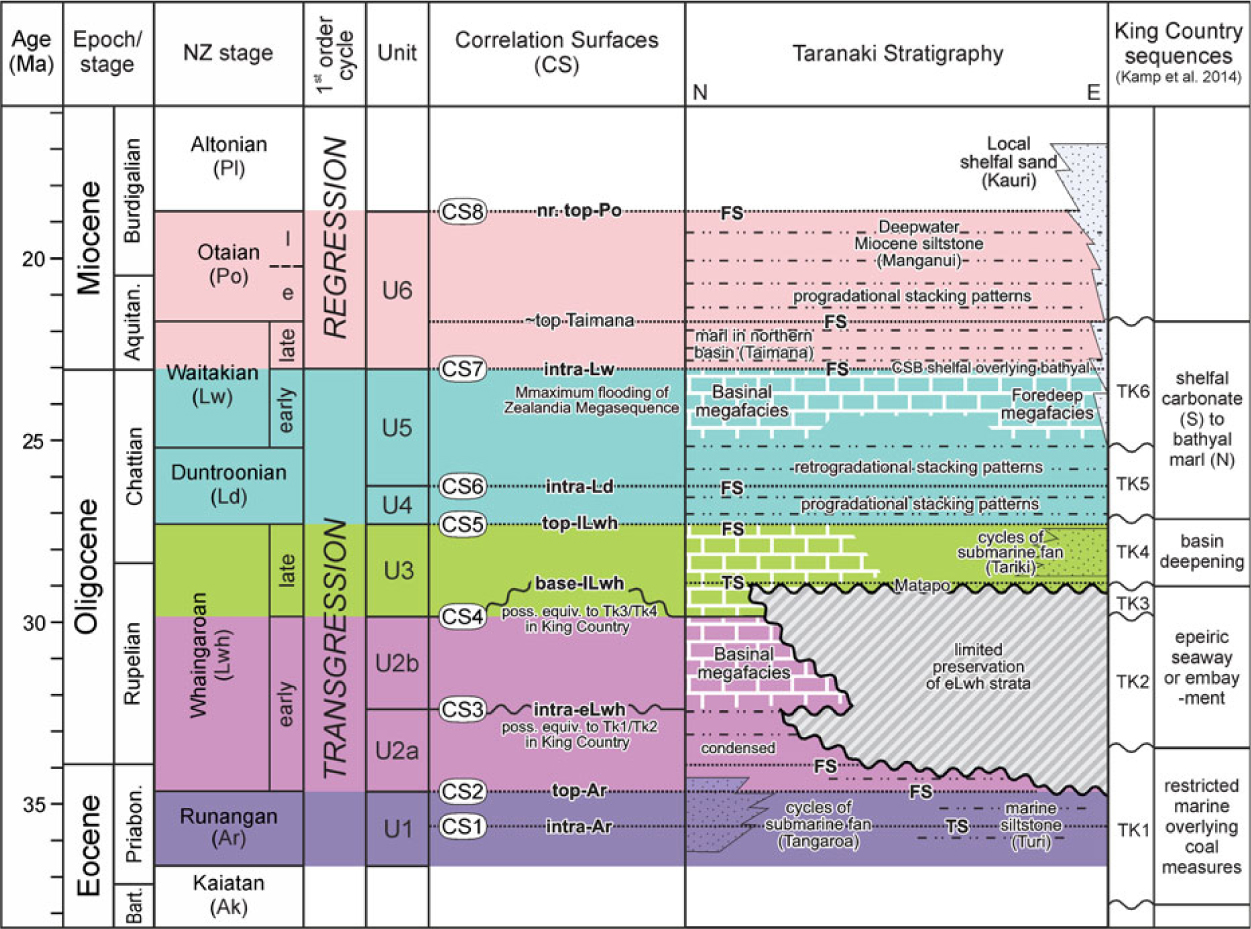
Fig. 8. Summary chronostratigraphic scheme for the latest Eocene – Early Miocene in the Taranaki Basin, showing the main units (U1–U6) and the correlation surfaces that divide them (CS1–CS8) identified in this study. The colours are used to discriminate the sequences in the transects shown in Figures 9–11.
Results from this study have been synthesized into a series of maps (Fig. 12) showing the thickness variations for each of the units correlated across the Taranaki Basin. Present-day along-hole depths (AHBKB) are used and have not been corrected for well deviation, structural dip or compaction, as most wells are vertical or near-vertical. The thickness maps are contoured, based only on well data, constrained where possible by additional data from measured sections onshore, in the Waikato–King Country (Kamp et al. Reference Kamp, Tripathi and Nelson2008) and Nelson (Nathan et al. Reference Nathan, Anderson, Cook, Herzer, Hoskins, Raine and Smale1986) regions. The TFS has been used as a gridding boundary.
4. Correlation of latest Eocene to earliest Miocene strata
Eight significant regional correlation surfaces (CS) have been picked, based on facies boundaries, across the Taranaki Basin (Fig. 8). They are shown on a series of well correlations, both parallel and perpendicular to the eastern basin margin, and are summarized into three N–S and two E–W cross-sections (Figs 9–11), with the full log suite and biostratigraphic data illustrated in the online Supplementary Material (Figs S1–S4). Five surfaces (CS2, 5–8) have log signatures characterized by an upward change to higher GR and wider N-D separation, and/or by GR spikes. In most cases this reflects a change from relatively carbonate-rich to more terrigenous sedimentation. Three surfaces (CS1, 3 and 4) are recognized on the basis of a sharp lithological change marked by a decrease in GR and a kick in the N-D log. In most cases this reflects a change to more carbonate-rich deposition. In many cases these correlated surfaces are close to stage boundaries, but owing to the poor biostratigraphic resolution, we have picked horizons as facies boundaries based on wireline log response. As such, correlation picks are likely to represent significant surfaces, and may represent transgressive surfaces, flooding surfaces and candidate sequence boundaries or their correlative conformities (Emery & Myers, Reference Emery and Myers1996; Catuneanu, Reference Catuneanu2006). These regional correlation surfaces (Fig. 8) break the succession into six major packages (U1–U6). CS3 is used to subdivide U2 into U2a and U2b, although these sub-units are not distinguishable biostratigraphically.

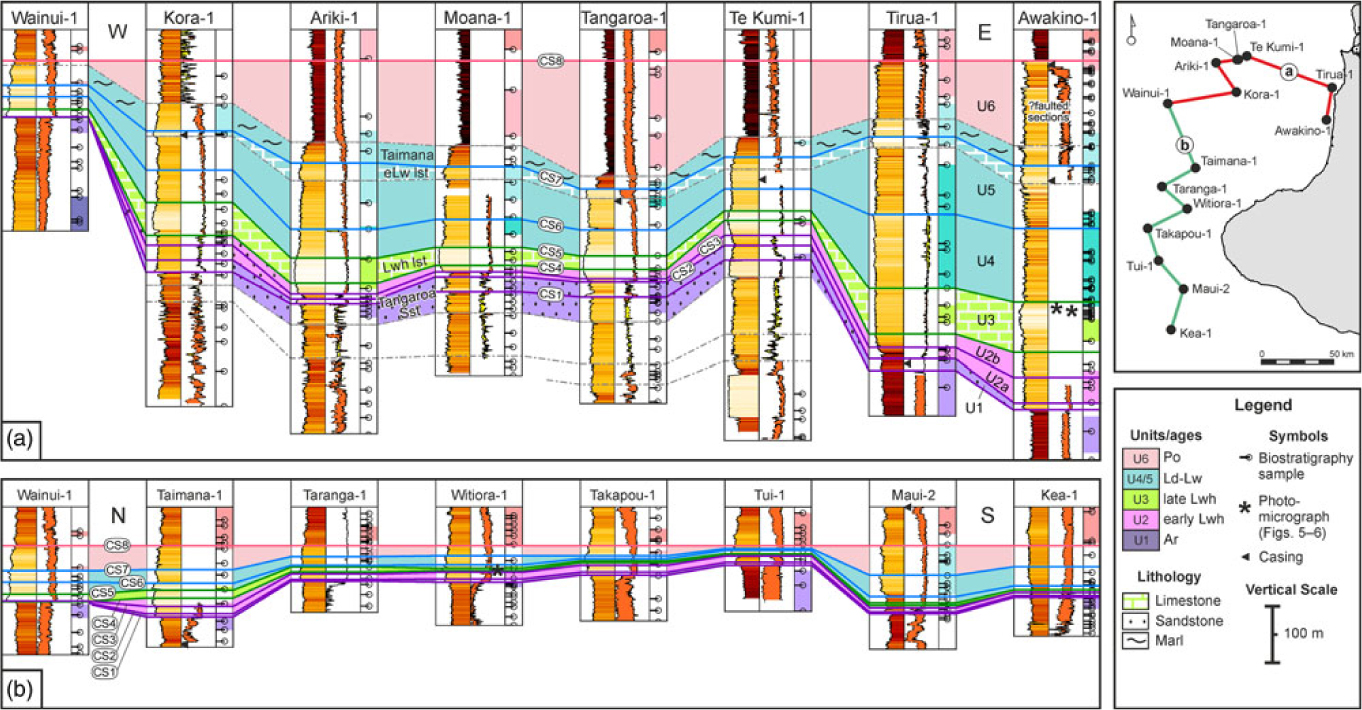
Fig. 9. Offshore (a) W–E and (b) N–S transects through Late Eocene to earliest Miocene, Taranaki Basin. Inset map shows well locations. The cross-section is hung on CS8 (approximate top Otaian). Illustrated for each well from left to right: GR log, neutron-density logs, biostratigraphy data, with age control shaded. See online Supplementary Material for correlations with full log suites and comments. Vertical scale same for all correlation panels.
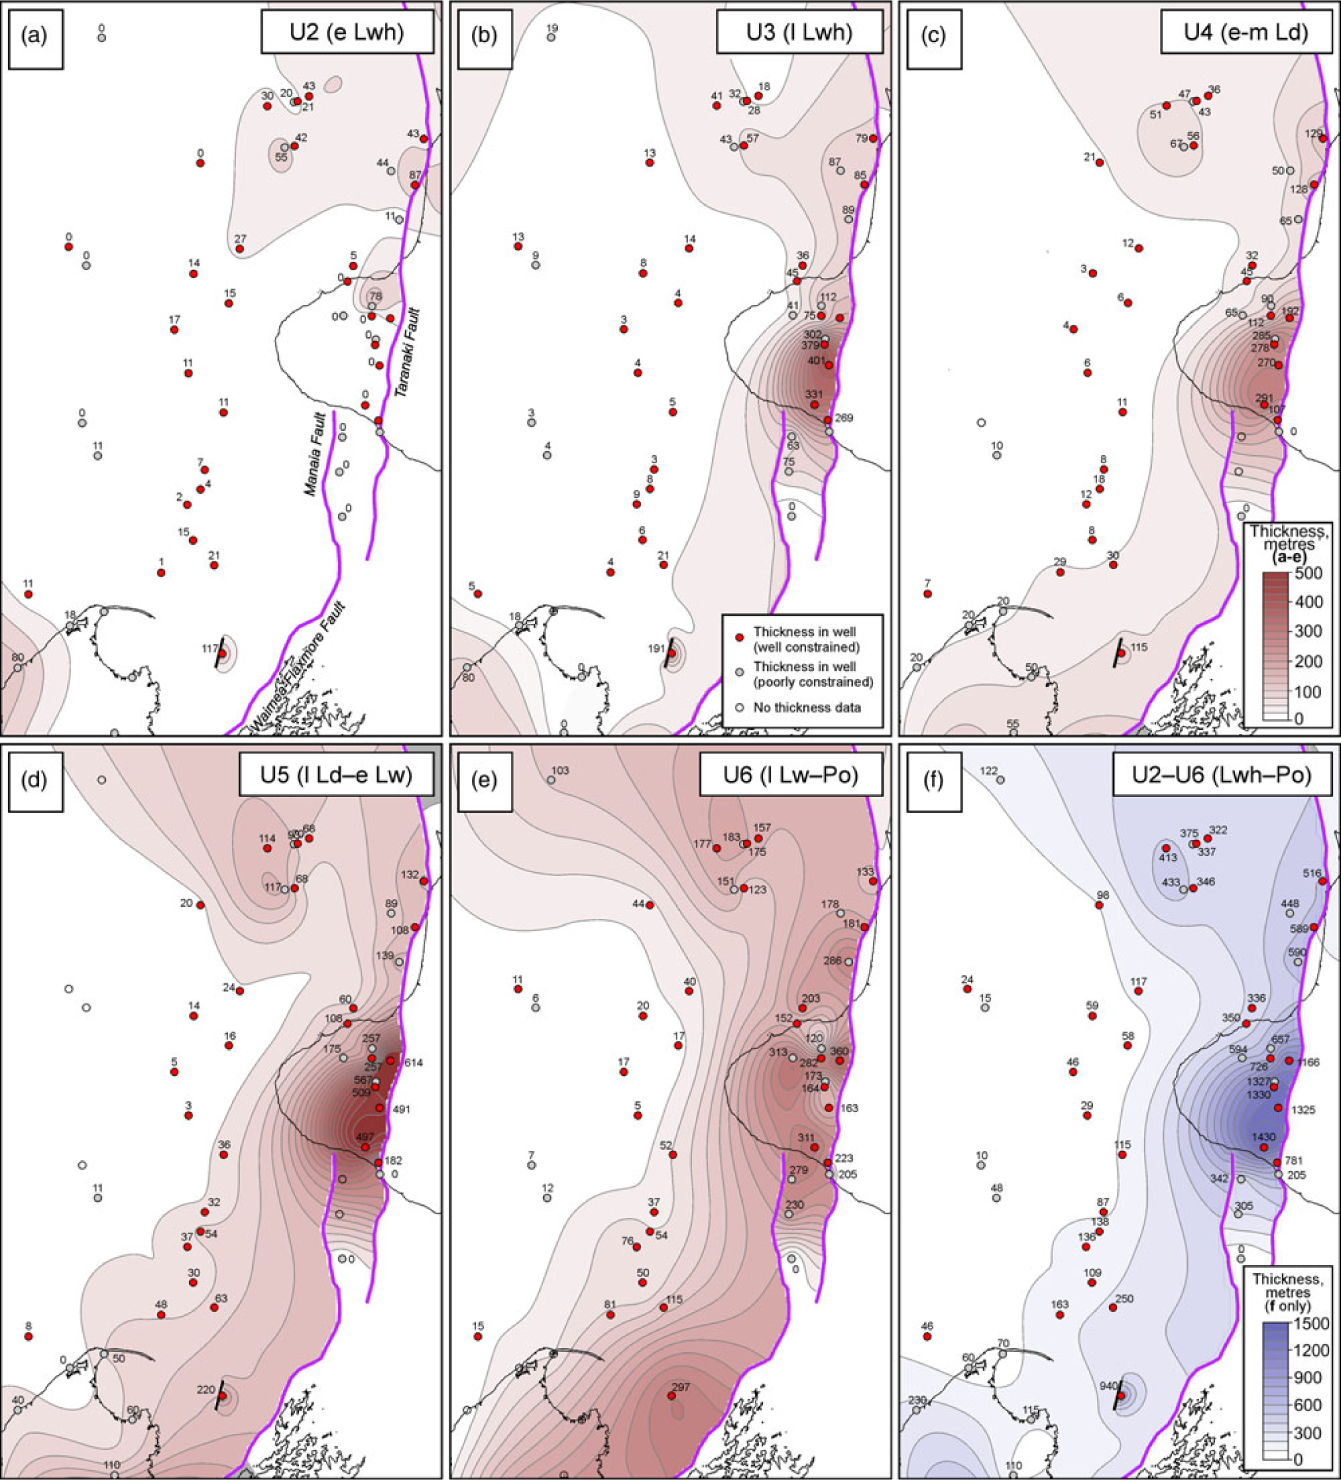
A description of the main correlation surfaces (CS1–8) and the intervening sediment packages (U1–6) are presented below, including thickness and facies variations across the Taranaki Basin within each package. Whilst these correlated packages are generally likely to be time-equivalent, the development of a detailed sequence stratigraphic model is beyond the scope of the study, owing to the generally poor temporal resolution of the biostratigraphic data. The thickness of the Oligocene section from regional seismic mapping in the southern Taranaki Basin (Fig. 7; Bull et al. Reference Bull, Hill, Strogen, Arnot, Seebeck, Kroeger and Zhu2016) compares well in general with the total thickness from well data (Fig. 12f) and mirrors the trends seen within individual units.
4.a. U1: latest Eocene (Ar)
Most deposits of latest Eocene (Runangan) age comprise terrigenous shelfal to bathyal siltstones and mudstones (Turi Formation; Fig. 3) with localized development of submarine-fan sandstones in the northern part of the basin (Tangaroa Formation; Gresko et al. Reference Gresko, Jordan and Thompson1992). Runangan-aged strata have been identified in most study wells, with notable exceptions being many southern wells where local uplift, tilting and erosion of Eocene deposits has occurred (Bierbrauer, Reference Bierbrauer2010; Strogen et al. Reference Strogen and King2014). No thickness map has been produced for U1, as its base has not been mapped.
In the north, an intra-Runangan (CS1) surface is taken at the base of a low GR and high N-D response that represents a transient, highly calcareous interval within the latest Eocene submarine-fan facies. This ‘Tangaroa Limestone’ (OMV, 2004, 2007; Strong, Reference Strong2008) is composed of hemipelagic marlstones that separate younger Tangaroa fan lobe deposits in the cored interval at Kora-4 (Jordan, Reference Jordan1989) and in Moana-1 (OMV, 2007). CS2 (top-Runangan) is characterized by a GR spike and a positive N-D inflection, well defined in northern parts of the basin, and also fairly well constrained by foraminiferal dating (e.g. Moana-1; Fig. 9a). Given the dominantly clastic marine depositional setting at this time, we interpret CS2 as a flooding surface (FS).
4.b. U2: Early Oligocene (eLwh)
Early Whaingaroan (U2) strata are best preserved in the north (<90 m; Fig. 9a), where bathyal palaeoenvironments dominate, with significant thicknesses recorded as far south as Witiora-1. Revised biostratigraphy suggests that the Tangaroa Formation extends into the Early Whaingaroan, at least locally (Kora-1, -4, this study; Moana-1, Strong, Reference Strong2008). Away from the main Tangaroa Formation depocentre, U2a comprises highly condensed bathyal mudstones, with bathyal carbonates (U2b) deposited above CS3.
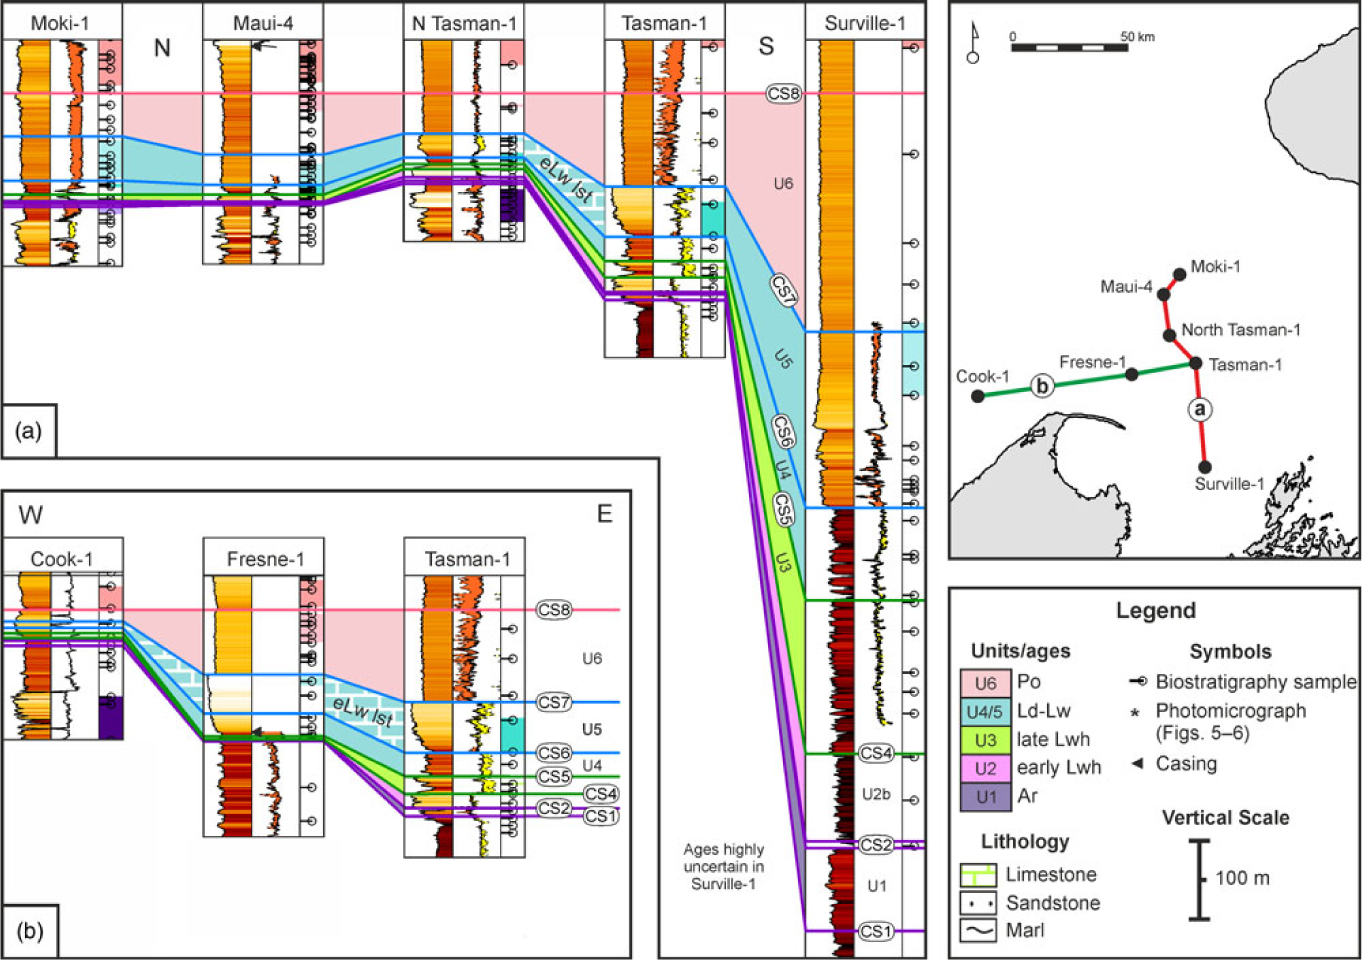
U2 has not been identified in most wells south of Takapou-1 (Fig. 9a), or in any wells on the Taranaki Peninsula (Fig. 11). However, thin U2 (<20 m) does occur in Cook-1 (Fig. 10b) and a few other offshore southern wells. Facies are very different to the north, with shallow-marine (Abel Head Formation, Tasman-1) to coastal-plain facies (Surville-1). U2 is unusually thick at Surville-1 (>100 m; Figs 10a, 12a). Although there is some uncertainty with dating, the entire Oligocene interval is very thick at Surville-1, and all correlated units are interpreted to increase in thickness relative to other southern wells (Fig. 12b–d). Seismic data suggest that the Surville Fault, currently a major reverse fault, was acting in a normal sense through Oligocene time, controlling a local depocentre (Fig. 14). This depocentre is also clearly picked out on regional seismic mapping (Fig. 7).

Fig. 10. Southern offshore (a) N–S and (b) W–E transects through Late Eocene to earliest Miocene, Taranaki Basin. Details as in Figure 9.
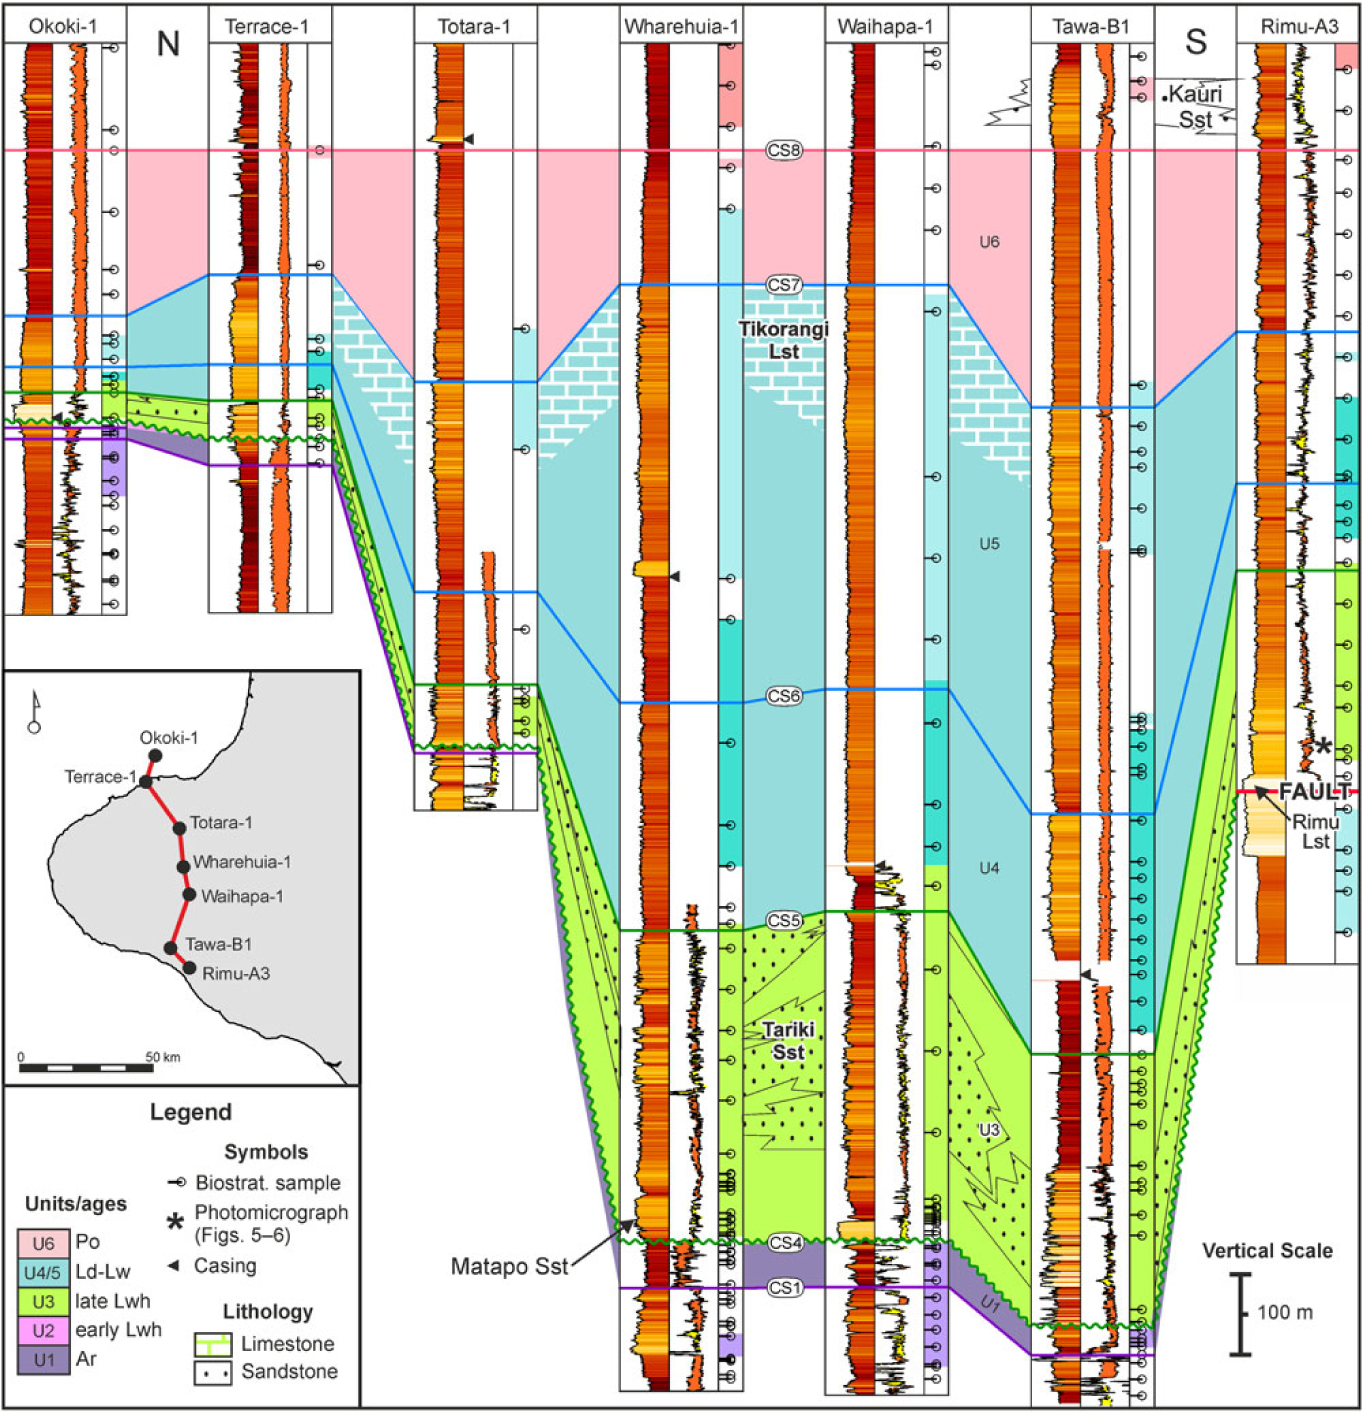
Fig. 11. Onshore (eastern Taranaki Basin) N–S transect through Late Eocene to earliest Miocene, Taranaki Basin. Details as in Figure 9.
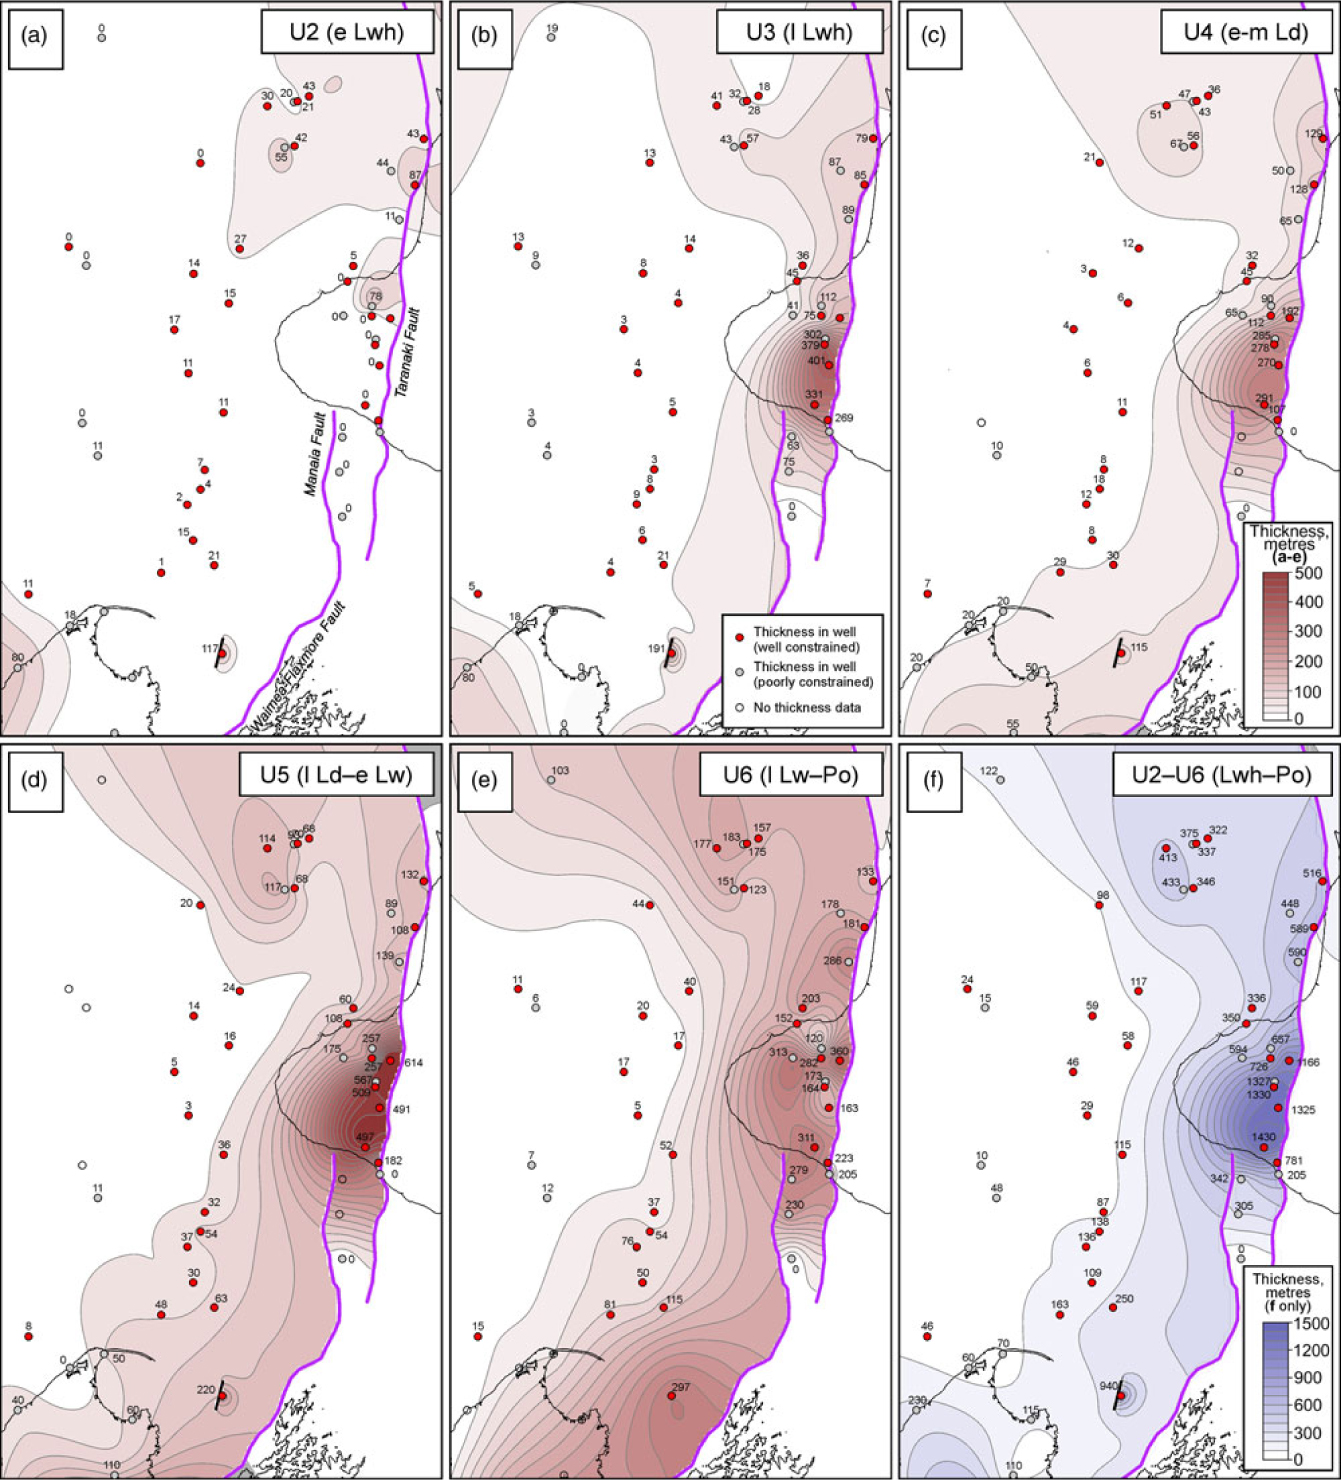
Fig. 12. (a–e) Thickness maps for the Oligocene to Early Miocene packages U2–U6 and (f) for their combined total thickness. Same colour scale for (a) to (e), but different for (f). No map was produced for U1 (latest Eocene), as its basal surface was not mapped. The Taranaki Fault System, used in the gridding process, is also shown. Based only on well and measured section data; thicknesses in metres. See text for discussion.
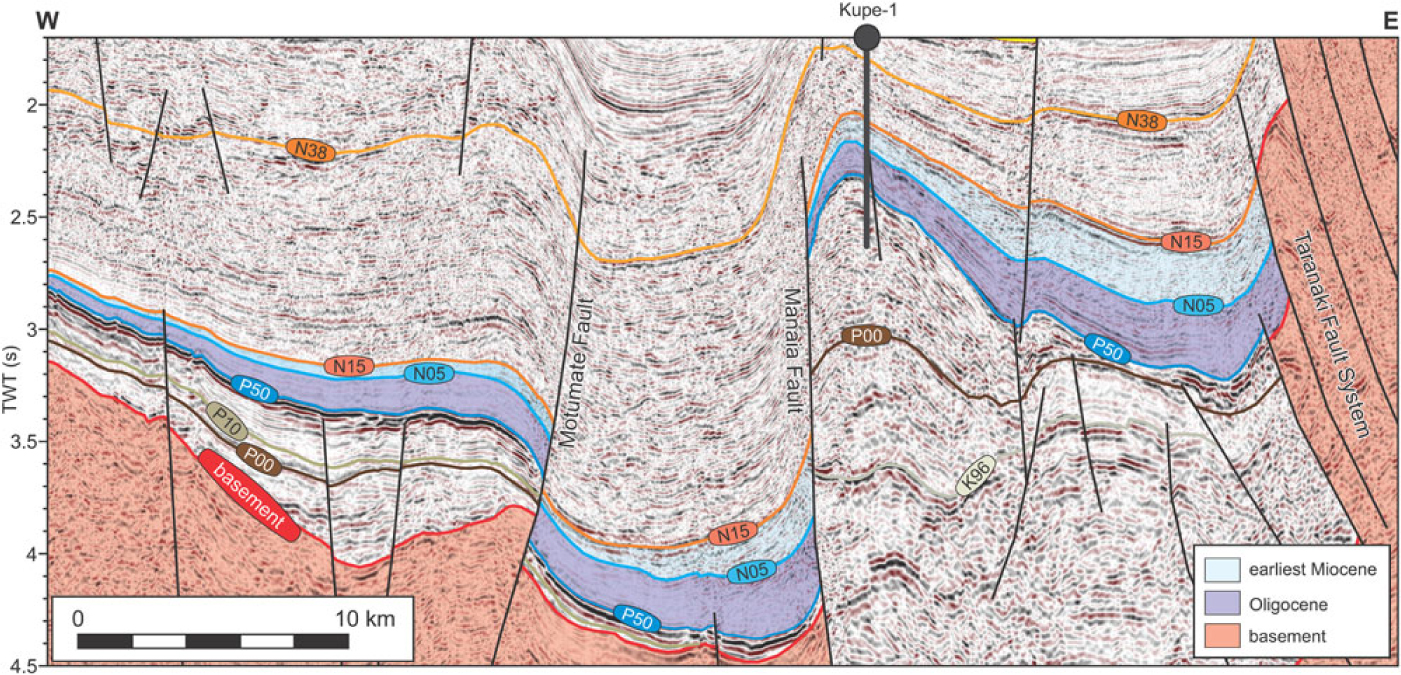
Fig. 13. Interpreted seismic transect (lines hzt82a-118 and sk-10) through well Kupe-1. Mapping after Bull et al. (Reference Bull, Hill, Strogen, Arnot, Seebeck, Kroeger and Zhu2016), with the Oligocene (P50–N05; purple) and earliest Miocene (N05–N15; light blue) highlighted. Both units can be seen to thicken from west to east towards both the Manaia and Taranaki faults, which were active as reverse faults during deposition. Basement highlighted in pink. See Figure 7a for location.
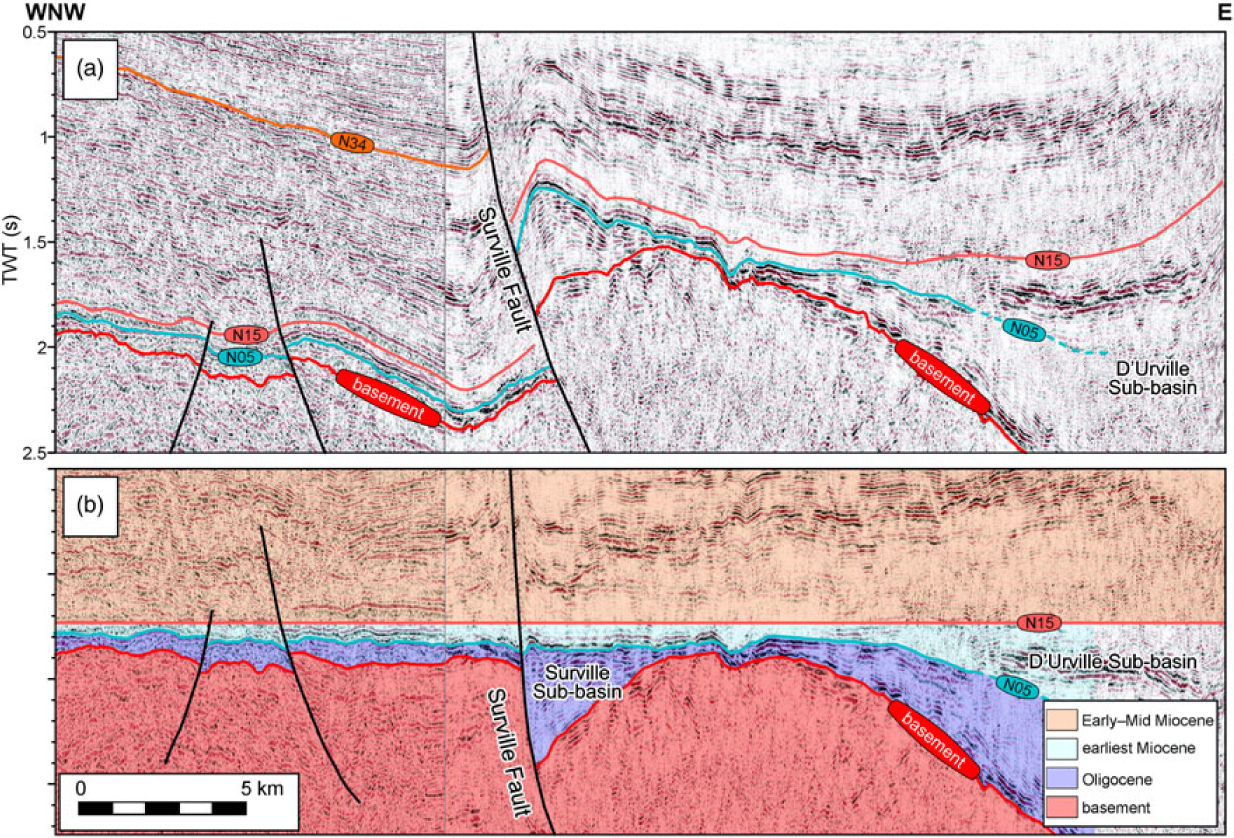
Fig. 14. Interpreted seismic transect (lines w83-6c and cs-3) across the Surville Sub-basin, ∼4 km south of well Surville-1. Mapping after Bull et al. (Reference Bull, Hill, Strogen, Arnot, Seebeck, Kroeger and Zhu2016). (a) Unflattened seismic transect. (b) Seismic transect flattened on N15 (Early Miocene, likely late Otaian). See Figure 7a for location. Although the Surville Fault has been active as a major reverse structure through most of the Neogene period (post N15), the flattened panel shows it was active as a normal structure through the Oligocene period (basement–N05). There is no obvious thickness variation across the fault in the earliest Miocene (N05–N15), suggesting likely inactivity. Both the Oligocene and earliest Miocene thicken to the east in the D’Urville Sub-basin, towards the Waimea–Flaxmore Fault (just beyond the righthand end of the section), which was likely active in a reverse sense throughout, although this is not certain.
In the northern Taranaki Basin, an intra-Early Whaingaroan surface (CS3) is recognized at a facies dislocation, well defined on logs (e.g. Moana-1, Ariki-1; Fig. 9a), between terrigenous mudstone/siltstone and overlying calcareous deposits. The upper part of U2 (U2b) is markedly more calcareous, and is characterized by bathyal marl and limestone. However, there is no clear difference in palaeobathymetry above and below CS3, with deposits above and below recording middle to lower bathyal palaeo-water depths, although these depth divisions are very broad (Table 2).
4.c. U3: mid-Oligocene (lLwh)
Most Whaingaroan-aged strata in the Taranaki Basin belong to U3 and show great variability in both thickness (Fig. 12) and lithology across the basin (Fig. 5). CS4 (base-Late Whaingaroan) is considered a particularly significant surface in that it locally represents a large time gap, whereby mid-Oligocene strata overlie rocks of Paleocene to Late Eocene age. This surface is the Oligocene unconformity described by King & Thrasher (Reference King and Thrasher1996), Leask (Reference Leask1993) and Strogen et al. (Reference Strogen, Bland, Nicol and King2014).
The unconformity passes into a correlative conformity in the northwestern part of the Taranaki Basin, where bathyal limestones accumulated throughout U2b and U3 (Fig. 8). In this region, Whaingaroan strata display a characteristic curving log profile that cleans upwards to CS4 (e.g. Te Kumi-1; Fig. 9). CS4 is taken near the curve inflection, with deposition above this surface representing predominantly calcareous deposition. In the west, U3 is interpreted as bathyal limestone deposits (Fig. 6d) belonging to the ‘basinal megafacies’ of Hood et al. (Reference Hood, Nelson and Kamp2003a,b) or the ‘Lower Tikorangi Member’ of OMV (2004). They thicken eastwards (Figs 7a, 12b) towards the TFS, where ‘foredeep megafacies’ dominate (Fig. 6a, b). These strata locally contain a high clastic component (Fig. 6a) and may be considered a calcareous Tariki Sandstone Member equivalent. CS5 in this northern region is marked by a clear increase in GR and N-D separation, indicative of the re-introduction of argillaceous clastic material in the Duntroonian times (Fig. 9a). Thickening of U3 in the northern basin (from 20 to 90 m) is not as dramatic as that seen further south.
U3 is thickest in the eastern parts of the basin, beneath the Taranaki Peninsula (Fig. 11), where strata of the mostly terrigenous Otaraoa Formation thicken to ∼400 m towards the Taranaki Fault (Fig. 12b). U3 commonly overlies Eocene (U1) deposits, suggesting that U2 is highly condensed, was eroded at the CS4 unconformity or was never deposited. This thickening can be seen on seismic in the southern Kupe area, where the P50–N05 interval, representing the whole Oligocene section, thickens towards both the Manaia and Taranaki faults (Fig. 13).
The Matapo Sandstone Member (Fig. 5a–d) is a highly glauconitic unit that occurs at or near the base of U3 in this area. It thins rapidly, to be replaced in the southern Taranaki Peninsula by the highly calcareous ‘Rimu Limestone’ (Fig. 11). Given the lithological similarities between these units (Fig. 5c–f), and the variation within them, this distinction seems somewhat arbitrary. Although the age of these units is poorly constrained, their deposition appears to be restricted to the Late Whaingaroan times. The Matapo Sandstone Member is associated with a sharp glauconite-related GR spike. Similar glauconitic units occur at several levels within the Abel Head Formation (Bishop, Reference Bishop1971) that crops out onshore NW Nelson (Fig. 5a, b; King & Thrasher, Reference King and Thrasher1996, their fig. 4.5), where stacked transgressive surfaces developed locally.
Identification of CS4 in the eastern Taranaki Basin is heavily reliant on biostratigraphic data, given the significant variations in lithology and log response. In Wharehuia-1, a conventional core of Late Whaingaroan age underlies the characteristic ‘Matapo’ GR spike, and CS4 is taken at the clear facies dislocation between strata likely belonging to U1 and U3 (Fig. 11). The cored section comprises a range of clean to slightly argillaceous bioturbated, glauconitic sandstones, indicative of the Skolithos and locally Cruziana ichnofacies (Higgs et al. Reference Higgs and Morgans2001), and are interpreted to represent transgressive lower-shoreface to shelfal sandstones. A similar, though undated, sandstone interval is observed below the characteristic ‘Matapo’ GR spike at Waihapa-1 (Fig. 11).
The majority of U3 beneath the Taranaki Peninsula is composed of bathyal siltstone/mudstone (Otaraoa Formation) and/or sandstone (Tariki Sandstone Member). The main depocentre was adjacent to the Taranaki Fault, in the central eastern peninsula (Fig. 12b), where interbedded sandstone and mudstone turbidites were deposited as submarine fans (de Bock et al. Reference de Bock, Palmer and Lock1990; Higgs et al. Reference Higgs and Morgans2001). Several cycles of submarine-fan development are interpreted, each capped by a clay-dominated unit (Fig. 11; Higgs et al. Reference Higgs and Morgans2001, Reference Higgs, King, Browne and Morgans2004a). Although clastic sedimentation dominated U3 in this part of the basin (e.g. Fig. 5c), sandstones are locally calcareous, with strata equivalent to the Tariki Member assigned to the ‘Rimu Limestone’ in Tawa-B1 (Fig. 11; Swift Energy New Zealand Ltd, 2005).
In some wells on the Taranaki Peninsula, CS5 is biostratigraphically well constrained, and generally corresponds to an increase in argillaceous content marked by higher GR and wider N-D separations (e.g. Totara-1, Wharehuia-1; Fig. 11). It likely represents a flooding surface, although no clear and consistent increase has been recorded in the palaeo-water depth of overlying strata. However, CS5 is difficult to pick in wells without good age constraint away from the main area of Tariki Sandstone deposition, where it occurs within a thick interval of bathyal Otaraoa Formation siltstones.
In southwestern parts of the basin, U3 is very thin and represents a highly condensed, variably calcareous unit (Figs 9b, 10). In some cases, CS4 is picked at the same depth as CS3, but we suggest this is due to non-deposition rather than erosion of U3. CS5 in this part of the basin is marked by a GR peak and an increase in N-D separation that is locally well constrained by foraminifera (e.g. Maui-4; Fig. 10a). This again is suggestive of a return to more argillaceous clastic sedimentation above CS5.
4.d. U4: early Late Oligocene (Ld)
Duntroonian (Ld) deposits are bracketed by CS5 and CS6. Age dating is not precise enough to confidently identify the top Duntroonian, and U4 likely consists of only early–mid Duntroonian strata (Fig. 8). Overall, U4 is relatively argillaceous, compared to the more calcareous or arenaceous U3, in northwestern and eastern areas, respectively. This is the ‘Middle Tikorangi Member’ of OMV (2004). CS6 is picked on a GR spike associated with an increase in the N-D separation. In some wells (e.g. Okoki-1, Tirua-1, Witiora-1, Taranga-1), palaeoenvironmental data also suggest an increase in palaeo-water depth above CS6, which we suggest forms a regional flooding surface.
U4 shows a similar thickness distribution to U3 (Fig. 12c), highly condensed in southwestern parts of the basin and thickening eastwards towards the TFS, to ∼300 m onshore Taranaki Peninsula (Fig. 11) and ∼130 m thick in northern areas (Fig. 9). Localised Duntroonian-aged sandstones occur, with ∼150 m thick sandstones penetrated in Tuihu-1 (‘Ld-sandstones’ of Higgs & Morgans, Reference Higgs and Morgans2001), and cropping out as the Magazine Point Formation at Nelson city (Fig. 2; Higgs et al. Reference Higgs, King, Browne and Morgans2004a). These were deposited from a range of gravity-driven mass-flows, in outermost shelf to upper bathyal (Tuihu-1) or deeper, mid-bathyal palaeo-water depths (Nelson city). Overall, submarine-fan development in U4 appears to have been even more areally restricted, more carbonate-rich and possibly deposited in deeper water than in U3.
Most of U4 is composed of monotonous, bathyal siltstone–mudstone. However, small-scale cyclicity is locally observed in the northern part of the Taranaki Basin, demonstrated by cyclical wireline log profiles, some of which show distinctive upward-cleaning packages (e.g. Tirua-1; Fig. 9a). A shelfal palaeo-water depth and overall upwards increase in resistivity logs at Tirua-1 may represent local carbonate bank or shoal development, with a cyclical upwards shallowing, or simply a reduction in terrigenous sediment input prior to rapid deepening above CS6.
4.e. U5: Late Oligocene (Ld–eLw)
U5 comprises a lower package of argillaceous siltstones that grade upwards into variably calcareous siltstone and limestone. CS7 is picked at the top limestone, and approximates the Early/Late Waitakian (Oligocene/Miocene) boundary. U5 also shows significant thickening, from <20 m in the far west to >500 m in the east, beneath the Taranaki Peninsula (Fig. 12d). This thickening is again less pronounced in the northern offshore region, with U5 relatively thick (∼100 m) compared to older units in the Kora-Ariki area, well to the west of the TFS (Figs 9a, 12d). This unit is very thin in distal western wells in the south (<10 m), showing slight thickening to the east (>60 m). However there are no well data constraining this in the east, close to the TFS (Manaia and Waimea–Flaxmore faults; Fig. 12d).
In eastern areas, particularly beneath the onshore Taranaki Basin (Fig. 11), U5 displays an overall upward-cleaning above CS6, from argillaceous bathyal siltstone into limestone facies (the Tikorangi Formation, sensu Palmer, Reference Palmer1985; or ‘foredeep megafacies’ of Hood et al. Reference Hood, Nelson and Kamp2003a,b). These thick bathyal limestones are supportive of considerable mass-emplacement of shelf-derived carbonate sediment through the Late Oligocene times.
Further north, at least two sedimentary cycles are evident from the logs. The topmost, cleanest limestone unit (labelled ‘eLw lst’ on Fig. 9a) has a locally blocky log response and is likely the ‘Upper Tikorangi Member’ of OMV (2004). However, most of the interval is relatively argillaceous and has been included within the basinal megafacies of Hood et al. (Reference Hood, Nelson and Kamp2003a). It is possible that the block-shaped GR log signature at the top, together with bathyal palaeo-water depths, may indicate some mass-emplacement of limestone towards the end of the interval.
An upward-cleaning through U5 is also observed in parts of the southern basin, where the gamma log locally displays a characteristic barrel-shape (e.g. Tasman-1; Fig. 10). This is the Takaka Limestone equivalent, generally considered to represent inner shelf carbonates (Hood et al. Reference Hood, Nelson and Kamp2003a). However, palaeo-water depths based on foraminifera suggest outer shelf to uppermost bathyal conditions, and further work is needed to investigate whether these deposits represent limestones redeposited from the Takaka Limestone high.
4.f. U6: Early Miocene (lLw–Po)
Unit U6 marks a return to more terrigenous deposition, with CS7 marking a boundary between the limestones of U5 and the overlying marls of the Taimana Formation (King & Thrasher, Reference King and Thrasher1996). These marls represent a transitional facies, characterized by an intermediate wireline log response, between the underlying limestone and overlying siltstones (e.g. Wainui-1 to Tirua-1; Fig. 9a). These comprise several stacked progradational packages in the northern Taranaki Basin adjacent to the TFS (Fig. 9a). This lithological change is accompanied by an increase in palaeobathymetry, observed in several wells, from upper to mid-bathyal, consistent with CS7 representing a flooding surface. In some cases, marls overlying CS7 are dated as Early Waitakian, perhaps suggesting this correlation surface may be somewhat diachronous. As with older units, U6 shows thickening from the west (<10 m) to east (>300 m) towards the TFS (Fig. 12e), this being less pronounced in the north. This thickening is observed on seismic in the south (Kupe area), where the N05–N15 (Early Miocene) interval thickens towards both the Manaia and Taranaki faults (Fig. 13).
Most of U6 is composed of bathyal siltstones and mudstones of the Manganui Formation, with high GR and wide N-D separation, commonly showing a slight upward-cleaning log profile. CS8 is tentatively picked on a possible flooding surface at the approximate Otaian/Altonian boundary. However, precise age dating is problematic, and generally, CS8 is picked on the log response. Sandstone stringers are rarely developed within the Otaian siltstones, but are locally well developed in the overlying Altonian siltstones (above CS8), and include the majority of the ‘Kauri Sandstone’ (Figs 6f, 11). Although this unit is as old as Duntroonian, it was most extensively developed in the Waitakian–Altonian times (U6 and younger), spreading as far west as Kupe (Higgs et al. Reference Higgs, Pollock, Field and Strong2004b). Biostratigraphic data suggest an intra-Waitakian shallowing in the Rimu-Kauri area, followed by a subsequent deepening in the U6 ‘Kauri Sandstone’ (Higgs et al. Reference Higgs, Pollock, Field and Strong2004b).
5. Discussion: sedimentary evolution through the Late Eocene–Early Miocene times
The Cretaceous–Cenozoic sedimentary record of New Zealand has been described in terms of a first-order depositional cycle (King & Thrasher, Reference King and Thrasher1996). Within this cycle, the Oligocene represents a time of major change in sedimentation patterns coincident with maximum marine flooding, represented by the Waka Supergroup (Mortimer et al. Reference Mortimer, Rattenbury, King, Bland, Barrell, Bache, Begg, Campbell, Cox, Crampton, Edbrooke, Forsyth, Johnston, Jongens, Lee, Leonard, Raine, Skinner, Timm, Townsend, Tulloch, Turnbull and Turnbull2014). This unit is linked to a culmination of passive margin sedimentation and inception of a new subduction margin. In the Taranaki Basin, Oligocene sedimentation is marked by a shift from the previous and prolonged (>40 Ma) coastal-paralic clastic deposition through Late Cretaceous–Eocene time, into a deepwater carbonate-dominated system, with maximum transgression marked by the top of the Early Waitakian (U5) Tikorangi Limestone (King & Thrasher, Reference King and Thrasher1996). This shift in regional sedimentation patterns is attributed to the onset of reverse movement on the TFS and the associated development of a foredeep along the eastern margin of the basin (e.g. Tripathi & Kamp, Reference Tripathi and Kamp2008; Strogen et al. Reference Strogen and King2014) in response to the initial development of a new boundary between the Australian and Pacific plates (Stagpoole & Nicol, Reference Stagpoole and Nicol2008; Bache et al. Reference Bache, Sutherland, Stagpoole, Herzer, Collot and Rouillard2012; Reilly et al. Reference Reilly, Nicol, Walsh and Seebeck2015).
Results from our study are consistent with regional stratigraphic patterns, and indicate intermittent but overall transgression from Late Eocene (U1) to Late Oligocene (U5) times, followed by overall regression in the Early Miocene (U6) time. Within this overall transgressive–regressive system there is also evidence for smaller-scale cyclicity, shown by stacking patterns observed on wireline log profiles, and by the regional development of carbonates and interpreted transgressive or flooding surfaces (Fig. 8). These superimpose a possible second-order cyclicity, which is interpreted to have spanned much of the Oligocene period (c. 6 Ma). Important elements of the development of the Taranaki Basin through Late Eocene to Early Miocene times, based on the results from this study, are discussed below.
5.a. Late Eocene – Early Oligocene: transition from passive- to early active-margin
Latest Eocene strata in the Taranaki Basin are interpreted as the transgressive systems tract (TST) of the Middle–Late Eocene second-order sedimentary cycle (Higgs et al. Reference Higgs, King, Raine, Sykes, Browne, Crouch and Baur2012a). Sedimentation (U1), during ongoing regional transgression, was dominated by calcareous shelfal siltstones (Turi Formation) with deepening palaeobathymetry through time. Deposition of the Tangaroa Formation deepwater submarine fans in latest Eocene – earliest Oligocene times in the northern Taranaki Basin represent a striking facies change compared to the transgressive shoreline to shelfal facies, typical of the Eocene period (King & Thrasher, Reference King and Thrasher1996; Higgs et al. Reference Higgs, King, Raine, Sykes, Browne, Crouch and Baur2012a, Reference Higgs, Crouch and Raine2017). The presence of these fans, the deepening and steepening of palaeobathymetry (Strogen et al. Reference Strogen and King2014) and the slight thickening of U2 towards the Taranaki Fault (Fig. 12a) likely represent the first mild influence on sedimentation of reverse faulting on the TFS, at least in the northern Taranaki Basin. This is also supported by changes to provenance at this time. Recycled Mesozoic pollen within the Tangaroa Formation sandstones is indicative of a Murihiku Supergroup basement source east of the Taranaki Fault (King & Thrasher, Reference King and Thrasher1996), whereas detrital mineral composition and zircon data of the sandstones are consistent with sediment derivation primarily from recycled older Cretaceous–Eocene deposits (Higgs & King, Reference Higgs and King2018).
Sediment cyclicity is evident within the Tangaroa Formation, some of which may simply represent lobe-switching. However, the presence of the correlatable ‘Tangaroa Limestone’ within the sands could be evidence of superimposed, higher-order sedimentary cyclicity, possibly related to periodic movement on the Taranaki Fault. It likely represents a pelagic ooze deposit during a time of low siliciclastic sediment supply, and is consistent with a stratigraphically important break in clastic sedimentation.
Where Early Whaingaroan strata are preserved in the northern Taranaki Basin, CS3 marks a significant facies change from predominantly siliciclastic (U2a) to carbonate (U2b) deposition. Although the age of CS3 is poorly constrained, it may correlate to the Early Whaingaroan TK1/TK2 sequence boundary interpreted by Tripathi & Kamp (Reference Tripathi and Kamp2008) in the Waikato–King Country Basin (Fig. 8). This marked an expansion of marine and carbonate deposition in the area to the east of the TFS, which may explain the change to more carbonate facies in U2b in the northern Taranaki Basin.
5.b. Mid-Oligocene uplift, erosion and condensed sedimentation
The base-Late Whaingaroan unconformity (CS4) reflects a period of locally significant erosion and tilting of underlying strata in the southern Taranaki Basin. U3 overlies strata as old as Paleocene, with U2 absent across much of the southern Taranaki Basin. The age of CS4 (c. 30 Ma) approximately corresponds to a substantial eustatic fall on global sea-level curves (e.g. 28.5 Ma; Hardenbol et al. Reference Hardenbol, Thierry, Farley, Jacquin, De Graciansky, Vail, de Graciansky, Hardenbol, Jacquin and Vail1998), and therefore eustacy could have played some part in its development. In addition, unconformities of Oligocene age, such as the Marshall Paraconformity of Carter (Reference Carter1985) or Marshall Unconformity of Field et al. (Reference Field, Browne, Davy, Herzer, Hoskins, Raine, Wilson, Sewell, Smale and Watters1989), are widespread in sedimentary rocks throughout New Zealand, particularly in South Island. These surfaces have been the subject of considerable debate, including the number of unconformity surfaces, their ages and the reasons for their development (Carter & Landis, Reference Carter and Landis1972; Lewis & Belliss, Reference Lewis and Belliss1984; Carter, Reference Carter1985; Fulthorpe et al. Reference Fulthorpe, Carter, Miller and Wilson1996; King et al. Reference King, Naish, Browne, Field and Edbrooke1999; Lever, Reference Lever2007). They are usually associated with phosphatisation, glauconite concentrations in overlying sediments and the development of hardgrounds (Carter & Landis, Reference Carter and Landis1972) and are widely thought to be related to significant Oligocene oceanographic changes in Southern Ocean circulation.
However, there is clear evidence for major changes in the tectonic regime in the Taranaki Basin, starting as early as the Late Eocene times (e.g. Stagpoole & Nicol, Reference Stagpoole and Nicol2008; Strogen et al. Reference Strogen and King2014; Higgs & King, Reference Higgs and King2018). It is likely, therefore, that erosion and tilting, such as that seen in the Kupe area (Strogen et al. Reference Strogen and King2014, their fig. 5), represents a phase of regional Late Eocene to Early Oligocene tectonic uplift and inversion. This may be linked to inversion observed throughout the greater Tasman Frontier region, which has been related to subduction initiation processes (Sutherland et al. Reference Sutherland, Spasojevic and Gurnis2010, Reference Sutherland, Collot, Bache, Henrys, Barker, Browne, Lawrence, Morgans, Hollis, Clowes, Mortimer, Rouillard, Gurnis, Etienne and Stratford2017; Bache et al. Reference Bache, Sutherland, Stagpoole, Herzer, Collot and Rouillard2012), although the precise age of this uplift is as yet poorly constrained as possibly Late Eocene (Etienne et al. Reference Etienne, Collot, Sutherland, Patriat, Bache, Rouillard, Henrys, Barker and Juan2018). The CS4 unconformity in the Taranaki Basin is, therefore, interpreted to have developed in response to the ongoing transition from passive- to active-margin tectonics, and is unlikely, therefore, to be a purely eustatic feature or related to the Marshall Paraconformity/Unconformity.
The condensed Matapo Sandstone and ‘Rimu Limestone’ sit above CS4, their glauconitic nature representing localized sediment bypass or starvation (Bishop, Reference Bishop1971; King & Thrasher, Reference King and Thrasher1996). These deposits are most likely diachronous, representing a phase of gradual transgression, prior to the onset, still within Late Whaingaroan time, of rapid localized subsidence and deepening (see Section 5.c below).
5.c. Foredeep creation and mixed siliciclastic–carbonate deposition
Soon after the gradual transgression of CS4, rapid Late Whaingaroan subsidence resulted in the creation of an elongated foredeep close to the TFS (Figs 2, 12b). Throughout the remainder of the Oligocene period, this foredeep was filled with a thick sequence of strata of varying lithology. Oligocene units all thin westwards (Fig. 12) to more distal areas, where limestones were deposited in bathyal water depths and generally represent background pelagic ooze deposits (‘basinal megafacies’). This deepening marks the onset of significant reverse activity on the TFS, at least in central and southern parts of the Taranaki Basin. It likely correlates with deepening seen above the mid-Oligocene TK3/TK4 sequence boundary in the Waikato–King Country Basin (Tripathi & Kamp, Reference Tripathi and Kamp2008), which formed a piggyback basin to the east of the TFS. This is the most extensive intra-Oligocene unconformity in the Waikato–King Country Basin, with uplift and erosion over a 30 km wide zone east of the TFS, and marks the onset of severe deformation in the hangingwall of the TFS (Kamp et al. Reference Kamp, Tripathi and Nelson2014). Development of the foredeep fill in the Taranaki Basin was punctuated by several changes in depositional facies, which reflect local and more regional tectonic and provenance signals.
Initial, Late Whaingaroan (U3), deposition in the foredeep beneath the Taranaki Peninsula was clastic dominated, including thick variably calcareous submarine-fan sandstones (Tariki Sandstone Member; de Bock et al. Reference de Bock, Palmer and Lock1990) and thick bathyal mudstones (Otaraoa Formation). Several discrete cycles of submarine-fan sedimentation occurred (Higgs et al. Reference Higgs and Morgans2001, Reference Higgs, King, Browne and Morgans2004a), likely controlled by episodic fault activity on the TFS. The fans were sourced primarily from east of the Taranaki Fault, where older Paleogene sediments and basement were uplifted and eroded (Higgs & King, Reference Higgs and King2018). Further north, redeposited limestones (‘foredeep megafacies’; Hood et al. Reference Hood, Nelson and Kamp2003a,b) were deposited close to the TFS during the Whaingaroan times (U2b–U3). These likely represent redeposition of contemporaneous platform limestone facies that occur in the Waikato–King Country Basin (Nelson, Reference Nelson1978; Tripathi & Kamp, Reference Tripathi and Kamp2008; Kamp et al. Reference Kamp, Tripathi and Nelson2014). While lithologically different, they formed by similar processes to the Tariki Sandstone Member, namely hangingwall uplift and erosion on the TFS. Less pronounced relative thickening is seen throughout Oligocene times (U3–U5) in the northern Taranaki Basin, compared to beneath the Taranaki Peninsula (Fig. 12b–d). This may reflect less intense uplift along the northern portion of the TFS, and explain the reworking of contemporary platform carbonate facies, rather than deeper erosion of older cover rocks and basement further to the south during Late Whaingaroan time.
The end-Whaingaroan (CS5) marks an end to both carbonate deposition in northern Taranaki and to extensive coarse clastic deposition in the eastern Taranaki Peninsula. Although sandstone facies are present within U4 (‘Ld-sands’, ‘Kauri Sandstone’ and Magazine Point Formation), they are far less extensive than in U3. Possible reasons for this Duntroonian reduction in coarse clastic material could include regional transgression leading to a reduced area of uplifted hangingwall available for erosion, or a relative waning in activity on the TFS. However, these are not supported by the continued high sedimentation rates in Duntroonian time (Fig. 12b–c). A change in provenance could be one reason for this switch to more argillaceous facies. Continuing hangingwall uplift and erosion, resulting in the complete removal of older cover rocks to the east of the TFS by the end-Whaingaroan, may have led to a change from reworking of coarse quartzose Cretaceous–Paleogene cover rocks to direct erosion of highly argillaceous Eastern Province basement (Higgs & King, Reference Higgs and King2018). The change from calcareous to more argillaceous facies in U4 in the northern Taranaki Basin may also reflect this provenance change to a more argillaceous Eastern Province source, tied to an increase in clastic sediment input. Progradational siltstone/mudstone packages within U4 may reflect episodic activity on the TFS.
By Early Waitakian time (upper U5), thick resedimented limestones (‘foredeep megafacies’ of Hood et al. Reference Hood, Nelson and Kamp2003a,b; Tikorangi Formation, sensu Palmer, Reference Palmer1985) dominated deposition in the peninsula foredeep. These were likely sourced from platform facies on the adjacent Patea-Tongaporutu High (Fig. 2; Hood et al. Reference Hood, Nelson and Kamp2003a,b), indicating this was now transgressed. Similar platform carbonates are known to have been resedimented from the Herangi High in the north (Nelson et al. Reference Nelson, Kamp and Young1994). Input of coarse clastic sediment was restricted to the Rimu-Kauri area in the south (‘Kauri Sandstone’; Higgs et al. Reference Higgs, Pollock, Field and Strong2004b). As in U3, these distinctions are somewhat arbitrary, with highly calcareous Kauri Sands and sandy Tikorangi Limestone facies occurring, indicating a continuum between coarse clastic and carbonate facies.
5.d. Controls on regional subsidence and transgression
Regional subsidence and transgression occurred throughout the Late Eocene–Oligocene times in the Taranaki Basin and surrounding areas. Transgression was punctuated by several flooding surfaces, some of which may correlate to those in the Waikato–King Country Basin (Fig. 8; Kamp et al. Reference Kamp, Tripathi and Nelson2014). While compressional processes controlling foredeep creation dominated subsidence close to the TFS, gradual transgression was manifested by the spread of increasingly carbonate-dominated facies across adjacent platform areas, such as in the Waikato–King Country Basin (Nelson, Reference Nelson1978; Tripathi & Kamp, Reference Tripathi and Kamp2008; Kamp et al. Reference Kamp, Tripathi and Nelson2014) and NW Nelson (Nathan et al. Reference Nathan, Anderson, Cook, Herzer, Hoskins, Raine and Smale1986). Transgression culminated in Early Waitakian times, marked by a return to calcareous facies in the Taranaki Basin (Fig. 8). This time represents maximum regional transgression throughout Zealandia, with widespread carbonate deposition (King et al. Reference King, Naish, Browne, Field and Edbrooke1999; Mortimer et al. Reference Mortimer, Rattenbury, King, Bland, Barrell, Bache, Begg, Campbell, Cox, Crampton, Edbrooke, Forsyth, Johnston, Jongens, Lee, Leonard, Raine, Skinner, Timm, Townsend, Tulloch, Turnbull and Turnbull2014).
This ongoing slow regional Eocene–Oligocene transgression may reflect continuing post-rift thermal subsidence, although considerable time had passed since the end of rifting (>20 Ma in the proximal Taranaki Basin, as much as 50 Ma in distal areas; Strogen et al. Reference Strogen, Seebeck, Nicol and King2017). This may have been enhanced by an episode of more rapid regional deepening, following on from earlier regional uplift discussed previously (Etienne et al. Reference Etienne, Collot, Sutherland, Patriat, Bache, Rouillard, Henrys, Barker and Juan2018). This deepening has been ascribed to lithospheric processes related to subduction initiation (e.g. Sutherland et al. Reference Sutherland, Spasojevic and Gurnis2010; Bache et al. Reference Bache, Sutherland, Stagpoole, Herzer, Collot and Rouillard2012; Baur et al. Reference Baur, Sutherland and Stern2014). Deepening is observed in subsidence curves in western wells such as Tane-1 (Strogen et al. Reference Strogen and King2014), well away from the effects of the TFS, although its timing is poorly constrained.
5.e. earliest Miocene onset of regression in the Taranaki Basin
A major change occurred within the Waitakian, marking the onset of a long-lived regression that has continued to the present day, and was related to an intensification of plate boundary deformation throughout Zealandia (King et al. Reference King, Naish, Browne, Field and Edbrooke1999; King, Reference King2000; Bull et al. Reference Bull, Nicol, Strogen, Kroeger and Seebeck2018). The Taimana Formation (lower U6) represents the first minor influx of clastic sediments (Fig. 8) and the transition from the carbonate- to clastic-dominated depositional system. Deposition of thin (Fig. 12e), highly condensed deep bathyal marls continued in the western Taranaki Basin throughout U6, prior to the slope-shelf progradation that would not reach distal areas until later in the Miocene, post CS8 (King & Thrasher, Reference King and Thrasher1996; Strogen, Reference Strogen2011; Bull et al. Reference Bull, Nicol, Strogen, Kroeger and Seebeck2018).
The earliest Miocene saw changes to the foredeep adjacent to the TFS, which spread further south, along much of the eastern margin of the Taranaki Basin, compared to the Oligocene period (compare Fig. 12b–d and e). This reflects Early Miocene southward translation of the locus of reverse faulting onto the Manaia and Waimea–Flaxmore faults. This is illustrated by significant thickening of Early–Mid Miocene strata in the footwall of the Manaia Fault, compared to Oligocene–earliest Miocene units (Fig. 13; Bull et al. Reference Bull, Hill, Strogen, Arnot, Seebeck, Kroeger and Zhu2016). This southward translation of faulting is also consistent with the onset of significant reverse faulting in the Murchison Basin and elsewhere on the West Coast in the Early Miocene times (Otaian–Altonian; Ghisetti et al. Reference Ghisetti, Sibson and Hamling2016). It also fits with observations that the northern segment of the Taranaki Fault, north of the Taranaki Peninsula, was inactive by late Early Miocene times (late Altonian; Stagpoole & Nicol, Reference Stagpoole and Nicol2008).
5.f. Evidence for extension in the southern Taranaki Basin
Through Late Eocene–Oligocene times, the southern Taranaki Basin sat close to a transition between compression related to the developing plate boundary in the north and extension related to sea-floor spreading in the Emerald Basin in the south (e.g. King, Reference King2000). This extension resulted in widespread, but poorly constrained, Late Eocene–Oligocene extension in the West Coast (Nathan et al. Reference Nathan, Anderson, Cook, Herzer, Hoskins, Raine and Smale1986; Riordan et al. Reference Riordan, Reid, Bassett and Bradshaw2014) and western Southland (Fig. 1) basins (Turnbull et al. Reference Turnbull, Uruski, Anderson, Lindqvist, Scott, Morgans, Hoskins, Raine, Mildenhall, Pocknall, Beu, Maxwell, Smale, Watters and Field1993, Reference Turnbull, Browne, Mortimer and Raine2008). The northward termination of this rifting has always been unclear. It has been suggested to extend into the southern Taranaki Basin (King & Thrasher, Reference King and Thrasher1996), but poor seismic reflection data quality and intense structural inversion have made this hard to demonstrate.
We suggest that the Surville Sub-basin (Figs 7, 14) is the first well-documented example of Oligocene extension in the Taranaki Basin, and explains the anomalous thickness of Oligocene strata in Surville-1 (Figs 7, 10a) compared to other southern Taranaki Basin wells. The Surville Fault (Fig. 14) appears to have been active as a normal fault throughout the Oligocene times (horizons P50–N05), experienced a brief period of quiescence in the earliest Miocene times (N05–N15) and then experienced a significant structural inversion as a reverse fault from the late Otaian (post-N15) onwards. This faulting history is similar to that suggested for many normal faults in the West Coast region from the Murchison Basin southwards (Ghisetti et al. Reference Ghisetti, Sibson and Hamling2016).
The major D’Urville Sub-basin (Fig. 7a) depocentre just to the east of the Surville Sub-basin appears to be a southwards continuation of the foredeep associated with the TFS, although its Oligocene history is far from clear, owing to extremely poor seismic data and coverage. This suggests there may be a complex interaction between normal and reverse faulting in this area.
6. Conclusions
This paper documents the geographic, stratigraphic and facies variability of Late Eocene to Early Miocene strata in the Taranaki Basin, using high-quality wireline log data from 44 petroleum wells together with biostratigraphic data to constrain the age and depositional setting. This succession comprises widely variable clastic and carbonate facies that transition from sandstone through calcareous sandstone to limestone, and from micritic limestone through marl to siltstone/mudstone. This has resulted in an inconsistent and often ambiguous lithostratigraphic scheme for Oligocene strata, which requires revision.
We have subdivided the latest Eocene to Early Miocene succession in the Taranaki Basin using eight regional surfaces (CS1–CS8) based primarily on wireline log response augmented with foraminiferal control. The surfaces record facies dislocations relating to changes in lithology (e.g. carbonate/clastic) and/or palaeo-water depth, and divide the succession into units U1 to U6, summarized in Figure 8.
Significant thickness variations are observed across the Taranaki Basin in all mapped units (Fig. 12) and show similar patterns of eastward thickening towards the TFS from mid-Oligocene to Early Miocene times (U3–U6). The thickness of the Oligocene section from regional seismic mapping in the southern Taranaki Basin compares well in general with the total thickness from well data and mirrors the trends seen within individual units. Early Whaingaroan (U2) strata are limited to parts of the northern and southern Taranaki Basin. Elsewhere U2 is highly condensed, absent owing to erosion at CS4 or, in most cases, likely never deposited. This mid-Oligocene unconformity (CS4) remains somewhat enigmatic, although its clearly angular nature in parts of the southern Taranaki Basin implies it was tectonically driven. The creation of this unconformity and subsequent regional subsidence during U3 are most likely related to plate boundary initiation processes preceding more intense localized tectonic activity on the TFS itself. In the northern Taranaki Basin, U2 reflects sedimentation patterns associated with early mild compression on northern parts of the TFS.
Mid-Oligocene to Early Miocene (Late Whaingaroan–Otaian) thickness maps all illustrate the presence of thick sediments deposited in a foredeep adjacent to the TFS, with the thickest strata beneath the eastern part of the Taranaki Peninsula. These patterns suggest that sedimentation in the eastern Taranaki Basin was controlled by reverse movement on the TFS. Strata thin away from this foredeep into the western basin, where very thin and condensed sedimentation persisted throughout latest Eocene to earliest Miocene times. The shape of this foredeep changed in Early Miocene time, broadening and extending further to the south. This reflects a southward movement in the locus of faulting along the TFS, and coincides with the onset of significant reverse faulting to the south in onshore South Island.
Notably, the small Surville Sub-basin in the southernmost Taranaki Basin is shown to have acted as an extensional feature through the Oligocene period, prior to its Miocene inversion. This marks the northernmost confirmed extension related to Emerald Basin formation, and confirms the southern Taranaki Basin as a transitional zone between compressional deformation in the north and extension to the south during Oligocene time.
Author ORCIDs
Dominic P. Strogen 0000-0002-1744-1289
Acknowledgements
This study forms part of ongoing research into the evolution of New Zealand’s sedimentary basins as part of the Sedimentary Basin Research (SBR) programme being undertaken at GNS Science. Funding for this project is provided by the New Zealand Government (Ministry for Business, Innovation and Enterprise). Thanks to Kyle Bland, Greg Browne and two anonymous reviewers for providing reviews of the manuscript which helped to greatly improve it.
Supplementary material
To view supplementary material for this article, please visit https://doi.org/10.1017/S0016756818000997.