


Introduction
Agriculture, especially animal husbandry, causes considerable greenhouse gas emissions (GHGE). In the EU-15, agriculture accounted for approximately 10% of total GHGE in 2000Reference Gugele, Ritter and Mareckova1. On the one hand, cattle and other ruminants emit relatively large quantities of greenhouse gases (GHGs), particularly methane from enteric fermentation. On the other hand, a large percentage of the agriculturally utilized land in Austria is located in mountainous areas and uplands2. As in other regions that are dominated by grassland, cattle and other ruminants are an essential element of regional agricultural food production. Cessation of (livestock) farming in these regions would therefore have tremendous socio-economic and high ecological costs2, Reference Luick3.
Grasslands, pasture and (tropical) forests are vegetations with a high environmental value, with high biodiversity and carbon storage potentialReference Fehrenbach, Giegrich, Reinhardt, Schmitz, Sayer, Gretz, Seizinger and Lanje4, 5. Land-use change (LUC), especially in combination with forest clearing in the tropics, is assumed to cause up to one-quarter of anthropogenic CO2-emissions5. However, the relative contribution of LUC to GHGE from traditional grassland-based dairy production through imported concentrates has not yet been studiedReference Garnett6. Another source that is sometimes not considered in estimations of GHGE is the emissions occurring during the rearing period of heifers, on the one hand; on the other hand, beef from calves and cull cows are important by-products from dairy production which result in a relative reduction of GHGE accountable to milk production, but are nevertheless not always considered in respective calculations (e.g. Löthe et al.Reference Löthe, Fuchs, Zeddies, Adger, Pettenella and Whitby7).
Given the regional importance of agriculture in general, and especially of dairy production in alpine regions of Europe, local traditional production systems (PS) must be further developed, including a reduction of their GHGE. Nevertheless, for these PS mitigation options have not yet been extensively analyzed in the literature as most studies have covered more intensive lowland PS which were characterized by greater livestock density and higher quantities of purchased production factors, such as bought-in feed or chemicals (e.g. Thomassen et al.Reference Thomassen, van Calker, Smits, Iepema and de Boer8, Williams et al.Reference Williams, Audsley and Sandars9 and Cederberg and MattsonReference Cederberg and Mattson10).
Therefore the goals of this study were to estimate the level of GHGE for selected milk PS in Austria, taking a great number of sources for GHGE into account, to analyze relevant influencing factors and to identify options for their reduction.
Material and Methods
Models for different PS were built, using MS Excel for calculation and taking into account emissions of methane (CH4) and nitrous oxide (N2O) from enteric fermentation and from manure management, as well as of CH4, N2O and carbon dioxide (CO2) from soil, from the use of fuels and other energy sources and from production and application of mineral fertilizers and pesticides. Total emissions per cow and year, per kg milk and per ha of farmland used were calculated by adding up the emissions of CH4, N2O and CO2 as CO2-equivalents (CO2-eq). Conversion factors used to calculate the global warming potential are 23 kg CO2-eq for 1 kg methane and 296 kg CO2-eq for 1 kg N2O (100-year-horizon)11.
Modeled dairy PS
Models for Austrian dairy PS were built on farm-level for alpine regions, uplands and lowlands, each one for organically and conventionally managed PS. PS a (alpine) represents a traditional alpine farm at more than 800 m asl and steeply sloping grassland. PS U (uplands) represents a dairy farm in a region of transition from alpine to lowlands with about 20% of arable land and 80% of permanent grassland, while PS L (lowlands) is located in the lowlands, farming on permanent grassland and arable land at a ratio of about 50:50. Generally, the intensity of production (i.e., among others, stocking rate and milk yield per cow) increases within these PS (PS A<PS U<PS L), while PS UP (uplands, pasture) represents a low-input, pasture-based production system with a relatively high stocking rate. Herein, the appendices ‘org’ and ‘con’ are used to further differentiate between organic and conventional PS, respectively. These PS may not necessarily represent the average Austrian dairy farm, but rather represent a wide spectrum of different conditions for dairy production. The great variability in farming conditions in Austrian dairy production are due to the geographic heterogeneity, to the originally small farm size and the different development during the past three decades. According to an analysis, which was based on a comprehensive Austrian agricultural statistical database (Invekos)12, about 14% of Austrian dairy farms could be assigned to the PS Acon, Aorg, UPcon and UPorg (between 4500 and 6000 kg milk quota per cow and year in an alpine or upland region), with a relatively high share (26%) of organic farms. Within these 14%, pasture-based PS contribute an estimated 15%. Although currently only relatively few farms exist which are strictly following a pasture-based low-input approach with the highest possible proportion of pasture (up to 60%; Table 1) and seasonal calving, this concept of dairy production is extensively discussed as a future strategy of milk production in permanent grassland regionsReference Kirner13. PS UPcon and UPorg were defined to represent farms following such a strategy. PS Ucon and Uorg represent another 8% of Austrian dairy farms (i.e., with a share of grassland between 65 and 85%), with 16% of farms being organically managed. Furthermore, about 4% of Austrian dairy farms are represented by PS Lcon and Lorg with a milk quota of 6500–8000 kg milk per cow (among them about 9% of organic farms).
Table 1. Emissions from manure management, direct and indirect soil emissions for the eight PS.

Due to differences in management (e.g., number of harvests, dietary proportion and type of bought-in and home-grown feed), milk yield and usage of fuel, mineral fertilizers and pesticides, among other factors, differ between the eight PS. Key characteristics for these PS are shown in Tables 1, 2 and 3.
Table 2. Characteristics of feed production, feed quality and dietary composition for the eight PS.

1 Including clover silage and maize silage in uplands and lowlands PS if existing.
2 Feedstuffs ranked according to their dietary percentage.
Crop and grassland yields, feeding value
Values for crop yields were derived from Austrian statistical databases14, differentiating between conventional and organic production. Yields for grassland were taken from Buchgraber and GindlReference Buchgraber and Gindl15 and an agricultural national database16 and were equal for conventional and organic production but were adjusted to the altitude. The main reasons for the assumption of equal forage yields were similar amounts of manure applied, lower gaseous N-losses in organic housing due to higher proportions of pasture and straw-based manure systems (20 and 30% gaseous N-losses from NH3 and NOx emissions for pasture and storage of solid manure, respectively, as compared to 40% N-losses for slurry systems; IPCCReference Eggleston, Buendia, Miwa, Ngara and Tanabe17, Tables 10.22 and 11.3) and a higher share of legumes in organic grassland and hence higher biological N-fixation (e.g. Rahmann and BöhmReference Rahmann, Böhm and Rowlinson18). Information on nutrient contents of crops and forage were derived from DLG feed tables19, Buchgraber et al.Reference Buchgraber, Gruber, Resch and Wiedner20 and Resch et al.Reference Resch, Guggenberger, Wiedner, Kasal, Wurm, Gruber, Ringdorfer and Buchgraber21. The management and production factors for the different PS were defined based on Austrian agricultural statistical data14, 16, Reference Amon, Fröhlich, Weißensteiner, Zablatnik and Amon22, Reference Amon, Fröhlich, Weißensteiner, Zablatnik and Amon23, and are described in Tables 2 and 3.
Forage quality depended, among others, on altitude, cutting frequency and time of harvest or grazing, ranging from 5.35 to 6.15 MJ NEL (‘net energy lactation’Reference Van Es24, 25) per kg of dry matter (DM)Reference Buchgraber and Gindl15, Reference Resch, Guggenberger, Wiedner, Kasal, Wurm, Gruber, Ringdorfer and Buchgraber21.
Feeding regimen and milk yields
The relative proportion of pasture in the total forage was assumed to decrease from PS UP via PS A to PS U; in PS Lcon, cows were not grazed anymore. The dietary percentage of hay also decreased in the same order, whereas the percentage of silage increased. In general, organic PS fed more hay and used more grazing than conventional PS, as it is shown in Table 2. In the most intensive PS Lcon, about 40% of grass-clover silage were replaced by maize silage. Forage harvest-losses were related to the type of forage fed: pasture 25%, indoor grass feeding 5%, grass silage 20% and hay 30%, on a DM basis16.
The annual average percentage of concentrate in the diets was assumed to be between 13% of total feed intake in PS UP (conventional and organic) and 24% in PS Ucon and PS Lcon. In the pasture-based PS UPcon and PS UPorg, the concentrate only consisted of grains and mineral premix. Organic concentrate consisted of barley, wheat, faba beans, peas and mineral premix for PS Aorg, PS Uorg and PS Lorg. Conventional concentrate contained barley, wheat, corn, rapeseed cake, extracted soybean meal, faba beans and mineral premix for PS Acon, PS Ucon and PS Lcon. Forty-five percent of the rapeseed for oil milling (from which rapeseed cake originates as a by-product) was assumed to be imported from abroad (mainly from European countries such as Hungary and Slovakia), the rest was produced in Austria26. It was assumed that the production and extraction of soybeans took place mainly in South America and Germany, respectively27. While PS A and PS UP had to buy-in all the concentrates, PS Ucon, PS Uorg, PS Lcon and PS Lorg bought-in 56, 58, 53 and 24% of total concentrates, respectively.
Milk yields ranged from 5500 kg per lactation (organic and conventional PS UP and PS A) to 8000 kg per year (PS Lcon), with an estimated average lifetime performance of 23,650 kg milk, as was recorded for Austria's main breed, Simmental28.
Livestock density per hectare (stocking rate) was related to the PS as well as the feeding strategy and was between 1.0 and 1.5 livestock-units of dairy cows per hectare. Internal farmland was assumed to be between 0.67 and 1.0 ha per cow, but due to the demand on land for the production of bought-in feed, total farmland required ranged from 0.84 to 1.23 ha per cow (Table 3). Although cash crops may be produced, particularly in PS U and PS L, only land for cattle feed production was considered herein.
Table 3. Key characteristics of the eight PS.

1 For the production of homegrown feedstuffs.
2 For the production of homegrown plus bought-in feedstuffs.
Sources of emissions
Enteric fermentation
Unlike CO2 emissions from livestock, which are assumed to be zero due to photosynthesis of plants, emissions of CH4 have to be considered according to IPCC11. CH4 emissions from enteric fermentation were estimated using an equation established by Kirchgeßner et al.Reference Kirchgeßner, Windisch, Müller, Engelhardt, Leonhard-Marek, Breves and Giesecke29:
where ‘CH4’ describes the enteric methane emissions (in g), ‘CF’ is dietary crude fiber (in kg), ‘NfE’ is the dietary easily soluble carbohydrates (N-free extracts; in kg), ‘CP’ is the dietary crude protein (in kg) and ‘EE’ is the ether extracts (in kg). Table 4 shows some characteristic traits for the rations (Table 2) fed in the eight PS.
Table 4. Nutrient intake and their relative dietary proportions for the eight PS.

CF, dietary crude fiber; NfE, dietary easily soluble carbohydrates; CP, dietary crude protein; EE, ether extracts.
Energy consumption
The energy directly used on farm for dairy production, as well as the fuels and electric energy that were consumed during the production of mineral fertilizers and pesticides, were considered herein. The greatest share of the electric energy needed on dairy farms is used to cool milk and to produce and supply (concentrate) feed. Therefore, the amount of energy used was related to the annual milk yield, also considering that more feed was required and that higher-mechanized (energy-consuming) housing systems coincided with higher milk yields. A value of 0.05 kWh per kg milk was assumedReference Öhlinger, Dell and Egger30. All calculations in this model were done per cow and did not account for differences in farm size. Emissions were estimated to be 0.453 kg CO2-eq per kWh on average31. The amount of fuel used for cultivating the fields was estimated using standard values from a national database32, resulting emissions were calculated according to Fehrenbach et al.Reference Fehrenbach, Giegrich, Reinhardt, Schmitz, Sayer, Gretz, Seizinger and Lanje4. Additionally, the energy needed in transporting externally produced feedstuffs was also taken into account according to Wilting et al.Reference Wilting, Benders, Kok, Biesiot and Moll33. Mineral fertilizers and pesticides must not be used in the organic PS and were also not used on the grassland of the conventional PS, PS Acon and PS UPcon. However, a proportionate input of these factors was accounted for the concentrates imported into the conventional PS.
Emissions occurring during the production of mineral fertilizers and pesticides were derived from Patyk and ReinhardtReference Patyk and Reinhardt34 and Biskupek et al.Reference Biskupek, Patyk, Radtke, Kaltschmitt and Reinhardt35. Table 5 shows energy-related emission factors used herein and the references from which the data were derived. PS Acon is used as an example to demonstrate how the emissions attributed to these sources were calculated (Table 6).
Table 5. Overview on used emission factors.

Table 6. Consumption of energy and inputs per cow and year: PS Acon as an example.

1 Taking into account the amount of nutrients in the manure.
Construction of machinery and buildings were not included as sources of emissions in the model calculations, as they were expected to be equal for all PS.
Manure management
The manure systems were assumed to represent the situation in Austria: 60.7 and 59.7% of the organic and conventional dairy cows, respectively, are housed in straw-based systemsReference Amon, Fröhlich, Weißensteiner, Zablatnik and Amon23. The remaining systems are slurry-based. Therefore, differences occur between the eight PS, according to the proportion of time spent on pasture; according to Amon et al.Reference Amon, Fröhlich, Weißensteiner, Zablatnik and Amon22, Reference Amon, Fröhlich, Weißensteiner, Zablatnik and Amon23, the amount of manure per cow, its organic DM and nitrogen (N) contents, which are in turn related to milk yield and feed intake. Representative data were derived from Gruber and SteinwidderReference Gruber and Steinwidder36, the amounts of manure were calculated to be between 19.4 (for both PS A and PS UP) and 22.4 (for PS Lcon) Mg per cow and year. The content of volatile solids excreted daily (DM) was calculated to be between 4.0 and 4.6 kg per cow, based on SchechtnerReference Schechtner37. The quantity of nitrogen excreted was estimated to vary from 86.2 to 100.6 kg per cow and year if a moderate N-content of feed is assumedReference Pötsch38. Based on these values, the amounts of CH4 and N2O emitted were estimated according to IPCCReference Eggleston, Buendia, Miwa, Ngara and Tanabe17 (tier 2; equations 10.23 and 10.25) and are given in Table 1, using methane conversion factors of 0.3, 0.04 and 0.015 for slurry, farmyard manure and pasture, respectively. Emission factors used for calculation of N2O were 0.02 and 0.001 for farmyard manure and slurry, respectivelyReference Eggleston, Buendia, Miwa, Ngara and Tanabe17.
Soil N2O
Direct N2O emissions were calculated based on the amount of nitrogen introduced into the soil (IPCC-tier 2, equation 11.2)Reference Eggleston, Buendia, Miwa, Ngara and Tanabe17. Amounts of N from mineral fertilizers, mineralization, manure and crop residues were multiplied by the default emission factors of 0.01 kg N2O-N per kg of N applied; a factor of 0.02 kg N2O-N was used for each kg of N excreted by cows on pasture. Indirect soil emissions from deposited nitrogen and leaching were estimated according to IPCCReference Eggleston, Buendia, Miwa, Ngara and Tanabe17 (default values in Tables 10.22 and 11.3). In Table 1, amounts of N and related N2O-emissions are shown for the different PS. N2O emitted during cultivation of bought-in concentrates was included, because of its relevance for the N-balance of the total dairy supply chain. Due to a low demand on farmland and less grazing, soil N2O-emissions per cow seem to be lower for more intensive PS. On the contrary, emissions from manure are higher for more intensive systems with little or no grazing (Table 1).
LUC and changes in soil organic carbon stocks
LUC for soybean production was calculated according to statistics on imports (98% of imported soybean meal originated from South America27) and based on estimates for the conversion of savannah-type vegetation into soybean fieldsReference Fehrenbach, Giegrich, Reinhardt, Schmitz, Sayer, Gretz, Seizinger and Lanje4. The emissions from LUC, which may be even higher in the case of rainforest clearance, were calculated depending on loss of carbon from the soil and aboveground biomass and were allocated to soybean oil and extracted soybean meal based on their caloric values.
As supported by data from the European Environment Agency (EEA)39, LUC from grassland to arable land could be neglected for Austria, but had to be considered for imports of rapeseed from Eastern and Central Europe. An equivalent of 53% of LUC-related GHGE was estimated for the CO2-eq value of rapeseed cake by Fehrenbach et al.Reference Fehrenbach, Giegrich, Reinhardt, Schmitz, Sayer, Gretz, Seizinger and Lanje4, which was used as feedstuff for dairy cattle, because 45% of the rapeseed further processed in Austria was imported mainly from Eastern and Central Europe in 200426. Consequently, LUC-related GHGE of 5.41 and 0.40 kg CO2-eq were calculated for soybean meal and rapeseed cake, respectively, in addition to emissions from cultivating, transport and processing.
CO2 sequestrated into soil or released from soil organic carbon stocks was calculated according to Küstermann et al.Reference Küstermann, Kainz and Hülsbergen40 for Bavaria, Germany, where on-site conditions can be expected to be very similar to those in Austria. CO2-emissions and -sequestration occur for conventionally (+202 kg ha−1 a−1) and organically managed soils (−400 kg ha−1 a−1), respectively, due to differences in crop rotation and manure management. An even higher sequestration rate of 575 kg CO2 ha−1 a−1 was observed in a previous long-term study in SwitzerlandReference Fliessbach, Oberholzer, Gunst and Mäder41, where on-site conditions could also be expected to be similar to those in Austria.
It was estimated that 1 kg of conventional concentrate caused emissions of 0.05 kg CO2-eq from soil organic carbon changes, based on +202 kg CO2-eq ha−1 a−1 and an average grain yield of 4000 kg ha−1 a−1. One kilogram of an organic concentrate was expected to be related to a sequestration of 0.111 kg CO2-eq (−400 kg CO2-eq ha−1 a−1 and an average grain yield of 3600 kg ha−1 a−1). Due to its long history of relatively constant management, it was assumed that Austrian alpine grassland is at an equilibrium state and that its soils did not emit or sequestrate further CO2Reference Soussana, Loiseau, Vuichard, Ceschia, Balesdent, Chevallier and Arrouays42.
Rearing phase and beef as a by-product
The rearing phase of dairy cows prior to first calving has to be considered as an important source of GHGE, together with beef as the by-product from dairy production having a related mitigating effect for GHGE per kg of produced milk.
In the model calculations, the GHGE during the rearing phase were calculated for each PS based on the average emissions per MJ NEL consumed during the rearing phase. In the same way, emissions for a growing–fattening heifer were calculated as a standard of comparison for each PS, based on the emissions per MJ NEL. The mitigating effect of beef as a by-product from cull cows and newborn calves (50% bodyweight estimated as carcass) was calculated, using growing–fattening heifer as a model for beef from each PS. By considering all sources of GHGE except electric energy for cooling milk, 1 MJ NEL was burdened with 0.15 kg CO2-eq (PS Lorg) to 0.19 kg (PS Acon). The total requirement for energy during a dairy cows' rearing phase was assumed to be about 31,000 MJ NEL with an age at first calving of 28 months28, Reference Kirchgeßner43. As a consequence, emissions during the rearing phase were calculated to vary from 4.7 for PS Lorg to 5.9 Mg CO2-eq per cow in PS Acon. Emissions during the growing–fattening of a heifer (about 20,000 MJ NEL required for 600 kg final body weight) were estimated to vary from 3.0 to 3.8 Mg CO2-eq per head; the mitigating effect of beef from slaughter cows and newborn calves was therefore calculated to be between 3.1 and 3.9 Mg CO2-eq per cow.
Results and Discussion
GHGE from dairy PS
Emissions related to input factors and milk yield
Total emissions per cow (related to a lifetime milk yield of 23,650 kg) are presented in Table 7. The majority of GHGE evolved from enteric fermentation (40–62%), while the use of fuels and energy (in total 5–9%) as well as production of external inputs such as mineral fertilizers and pesticides (up to 7%) contributed relatively little. In Figure 1, GHGE from soil (N2O), from fuels, fertilizers and pesticides used, were aggregated to GHGE accountable to forage and concentrate supply. As the same sources—except electric energy for cooling milk—contribute to emissions during the rearing period and to the mitigation of emissions indirectly caused by the by-product beef, total GHGE from enteric fermentation are actually higher than presented in Figure 1 and Table 7. For example, total GHGE from enteric fermentation are 53% of total emissions (i.e., 3326 kg CO2-eq per year) as compared to 49% (i.e., 3100 kg CO2-eq annually) which are attributed to one productive year of a dairy cow.
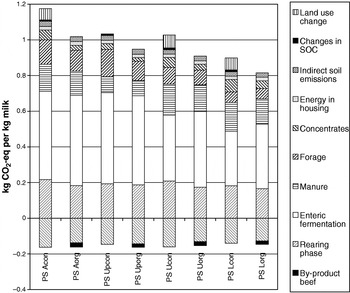
Figure 1. GHGE (kg CO2-eq) per kg milk for the eight PS.
Table 7. Emissions of GHGs (kg CO2 eq cow−1 year−1; [%]) from different sources for the eight PS, including the source ‘rearing phase’ and beef as a by-product.

In previous calculations, which focused on the relation between GHGE and milk yield, emissions which originated from the rearing phase were not always taken into account (e.g., Löthe et al.Reference Löthe, Fuchs, Zeddies, Adger, Pettenella and Whitby7). Although milk yield remains to be an essential factor, the rearing phase is equally important, as a heifer needs nearly the same amount of energy for growth and maintenance as a cow during one lactation. Additionally, the production of beef as a by-product of dairy production, lifetime performance and the number of lactations that a cow lasts, are important factors as well. Following FürstReference Fürst44, conventional and organic Austrian dairy cows are expected to produce about the same amount of milk in their lifetime, but with the latter being different.
Generally, PS with a higher output of milk showed higher GHGE per cow and year but were superior over PS with a lower output if emissions were expressed per kg of milk. GHGE per kg of conventional and organic milk were between 0.90 and 1.17 kg CO2-eq per kg of milk and between 0.81 and 1.02 kg CO2-eq per kg of milk, respectively (Table 7, Fig. 1). These numbers illustrate that differences may be smaller between production methods (i.e. conventional versus organic) than between regions: on average, organic PS showed about 11% lower GHGE per kg milk than comparable conventional PS, while the relative difference between the lowest emissions from the PS L and the highest emissions from the PS A amounted to 22%. Generally, the higher the dietary energy and nutrient density, the higher the milk yield, which results in lower GHGE per kg of milk due to reduced enteric fermentation and performance-related degression.
As the nutritional value of forages and concentrates is routinely characterized by proximate analysis in Austria, enteric fermentation was calculated according to the regression equation published by Kirchgeßner et al.Reference Kirchgeßner, Windisch, Müller, Engelhardt, Leonhard-Marek, Breves and Giesecke29. In order to check these estimates, a regression equation derived by Hindrichsen et al.Reference Hindrichsen, Wettstein, Machmüller, Jörg and Kreuzer45 was used. It was found that estimates resulting from the equation by Kirchgeßner et al. were on average 8% higher than those resulting from the equation of Hindrichsen et al., with the difference being greater for rations that are rich in crude fiber and being lower for rations rich in soluble carbohydrates.
The role of LUC
Another highly relevant source of GHGE has to be taken into account whenever conventional PS utilize soybean meal originating from South America: the production of soybeans is linked to an LUC from former savannah-type vegetation into arable land. In contrast to most previous calculations of GHGE and life-cycle assessments which did not incorporate LUC in their calculations (e.g., Lehuger et al.Reference Lehuger, Gabrielle and Gagnaire46), LUC was taken into account in this study (Table 7, Figs. 1 and 2) due to its high relevance on the global scaleReference Fehrenbach, Giegrich, Reinhardt, Schmitz, Sayer, Gretz, Seizinger and Lanje4, 5, 11. Estimates for GHGE from LUC vary considerably, e.g., about 5 kg CO2-eq per kg of Argentinean soybean mealReference Dalgaard, Schmidt, Halberg, Christensen, Thrane and Pengue47 as compared to more than 10 kg CO2-eq per kg of Brazilian soybean meal. The latter occurs if soybean is cultivated on deforested land (calculated from Renewable Fuels Agency48). Herein, a change from extensive grassland (savannah) to arable land was assumedReference Fehrenbach, Giegrich, Reinhardt, Schmitz, Sayer, Gretz, Seizinger and Lanje4, but without deforestation. Since 2000, the area for soybean cultivation expanded predominantly on deforested landReference Smaling, Roscoe, Lesschen, Bouwman and Comunello49 and therefore emissions from LUC may actually be even higher than calculated by both Fehrenbach et al.Reference Fehrenbach, Giegrich, Reinhardt, Schmitz, Sayer, Gretz, Seizinger and Lanje4 and within this study. Nevertheless, even with relatively low estimates for GHGE from LUC, emissions per kg milk will be lower for PS which do not import soybean meal into their system, but utilize homegrown or locally produced protein sources such as grain legumes or oilseed cakes. This contributes to the average difference in GHGE of 11% between conventional and organic PS studied herein. About 8% of total GHGE in conventional farming (average over all conventional PS excluding PS UPcon) result from LUC, mainly (93%) for extracted soybean meal originating from South America.
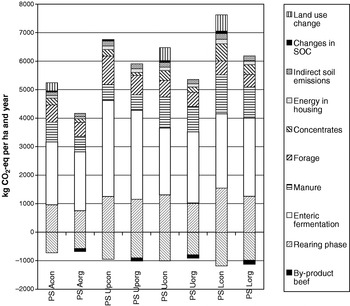
Figure 2. GHGE (Mg CO2-eq) per ha and year of total farmland for the eight PS, including the source, rearing phase, and beef as a by-product.
Emissions and regional location of dairy production
The difference in GHGE between alpine and lowlands PS with both conventional and organic management is mainly due to higher milk yields in the lowlands as well as a decreased enteric fermentation as a consequence of increased dietary energy density. Pasture-based PS (UP) emit relatively low amounts of GHGE per kg milk, despite their comparably low milk yield of 5500 kg per cow and year. This is caused by several factors, including reduced emissions from manure in housing (with cows being on pasture for 60% of the time) and the use of low amounts of concentrates. On the contrary, GHGE from enteric fermentation are slightly higher as compared to PS that use less hay but more silage. Pasture-based systems also have higher GHGE from forage because of a doubled rate of N2O from N excreted during grazingReference Eggleston, Buendia, Miwa, Ngara and Tanabe17, as compared to N spread as manure. Both the conventional and organic PS UP show a high productivity per ha of farmland required and low GHGE, which are similar to those of PS U.
Only very few studies are available about GHGE from dairy PS located in alpine or nearby regions (e.g. Weiske et al.Reference Weiske, Vabitsch, Olesen, Schelde, Michel, Friedrich and Kaltschmitt50 and Olesen et al.Reference Olesen, Schelde, Weiske, Weisbjerg, Asberg and Djurhuus51). In contrast to the results presented herein, Weiske et al., using a model based on Olesen et al., reported generally higher GHGE per kg milk of between 1.2 and 2.0 kg CO2-eq although LUC was not included in their calculations. The differences may be due to the lower milk yield and a lack of differentiation between organic and conventional PS in milk yield as assumed by Weiske et al., a greater number of input factors considered (e.g., the production of mineral premix and seeds), but also disregarding the emission-mitigating effects of by-products.
Great differences occur between PS when GHGE are related to the area of farmland used (Fig. 2). From this perspective, low-input systems show clearly better results. Organic PS need more area per cow due to lower yields especially from arable land, and at the same time show less GHGE per cow. As presented in Figure 2, GHGE per hectare of total farmland vary from 5.2 to 7.6 Mg CO2-eq and from 4.2 to 6.2 Mg CO2-eq for conventional and organic PS, respectively. Olesen et al.Reference Olesen, Schelde, Weiske, Weisbjerg, Asberg and Djurhuus51 reported comparable results of 8.7 Mg CO2-eq for conventional PS and 6.0 Mg CO2-eq for organic PS calculated according to an IPCC tier 2 methodology52.
Mitigation options for dairy PS
A number of possibilities exist to mitigate GHGE, some concerning the animals, e.g., their genetics for milk yield, but most address management practices. Because of the complex interactions between the various elements of dairy PS and the factors influencing them, any measures intended to reduce the GHGE must be thoroughly examined, as they may exert effects that eventually counteract the intended mitigation.
Feed quality and LUC
One of the most effective strategies to reduce emissions is to increase the energy density of the diet, which usually results in the suggestion to increase the proportion of dietary concentrates. On the one hand, this will lead to a significant decrease of GHGE from enteric fermentation (e.g., −6.5% for PS Ucon as compared to PS Uorg if equal milk yields and energy intakes are assumed). On the other hand, increased GHGE from soils and from the use of fertilizers coincide with this mitigating effect and partially counteract it. If an increased use of concentrates is accompanied by LUC (i.e., by converting grassland or pasture into arable land), the mitigating effect of using concentrates turns into an aggravating effect, as shown herein. Another limitation of this practice is the growing probability for digestive and other health disorders associated with increased levels of concentrates in the diet of dairy cowsReference Fleischer, Metzner, Beyerbach, Hoedemaker and Klee53, Reference Van Soest54. Due to the core role of forages in grassland-based PS (herein, diets were assumed to consist of 76–87% of forage), improving the nutrient density of forage should be prioritized in order to reduce GHGE from enteric fermentation. The greatest effect may be achieved by reducing crude fiber in forage by earlier harvesting (or grazing), but this option is also limited for reasons of grassland ecologyReference Weyermann, Kampmann, Peter, Herzog and Lüscher55, Reference Kampmann, Herzog, Jeanneret, Konold, Peter, Walter, Wildi and Lüscher56. According to the calculations conducted within this study, an increase of 0.1 MJ NEL per kg forage DM will lead to a reduction of total GHGE of about 1.5%.
Lifetime performance
Reducing age at first calving and thereby the rearing phase as well as decreasing the number of lactations in which a constant lifetime performance is yielded would result in a reduced demand for dietary energy and therefore in a reduction of GHGE. On the contrary, a decreased age at first calving and a continuing increase in milk yield per lactation may negatively affect lifetime performance, the number of lactations and the number of offspring per cowReference Knaus57. However, an improved lifetime performance (together with a constant or even increasing number of lactations) may be an effective way to decrease GHGE, because emissions from the rearing period will be distributed over a greater amount of milk: GHGE per kg of milk would be reduced by 1.4% on average if lifetime performance was increased by 5000 kg (i.e., from a current value of 23,650 to 28,650 kg for Austria).
Manure management
Furthermore, great potential for reduction of GHGE arises from changes in manure management. The PS in this study were assumed to represent the Austrian situation, where 59.7 and 60.7% of the dairy cows were kept in straw-based systems on conventional and organic farms, respectivelyReference Amon, Fröhlich, Weißensteiner, Zablatnik and Amon23. All other cows were kept in systems with slurry production. GHGE from cows' excreta were lower for housing systems with straw litter than for slurry-based systems. A change toward straw-based systems would therefore be desirable because of reduced GHGE and also of a potentially beneficial effect on animal welfareReference Tuyttens58. GHGE per kg milk may be mitigated by 0.9% if a further 10% of dairy barns are changed from slurry- to straw-based systems. However, this is not reflected by the current trend in Austria, where most of the newly built housing systems are slurry basedReference Amon, Fröhlich, Weißensteiner, Zablatnik and Amon22. Moreover, the separation of slurry into solid and liquid phases, as well as an aeration of slurry and composting of farmyard manure would contribute to a mitigation of GHGE, but may lead to increased ammonia emissionsReference Amon59. Over all PS covered herein, slurry separation and slurry aeration would reduce total GHGE by 1.8% on average.
When calculating GHGE from manure falling on pasture, only CH4, but not N2O, was taken into account, as the latter was already included in the emissions from soilReference Eggleston, Buendia, Miwa, Ngara and Tanabe17. Overall, pasture-based systems can be considered not only as animal friendly but also as favorable from the point of view of GHGE, as they are emitting less GHG than any other housing systems. On average, cows that spend 10% of their annual time budget on pasture emit 2.4% less GHG as compared to cows that are confined all year round.
Another very substantial reduction potential arises from anaerobic fermentation of manure for biogas production60, whereby GHGE per kg milk can be decreased by about 5%. Additionally to this direct reduction, the substitution of fossil fuels by biogas could contribute to a further decrease, as 1 Mg of cattle manure can be transformed into 32 kWh of electric energy in a biogas plantReference Amon, Kryvoruchko, Amon and Zechmeister-Boltenstern61. For the PS covered in this study, this would lead to a reduction of total GHGE per kg milk by 7%. Depending on the degree of utilization of the heat that emerges in a biogas plant and the potential substitution of fossil energy for heating, a further potential reduction of GHGE arises.
Utilization of oil seeds for feed and biofuels
The utilization of by-products from the production of biofuels in livestock nutrition is frequently advocated as a contribution to improved sustainability of agricultural production (e.g., UN-Energy62). Nevertheless, certain energy crops, such as rapeseed, are frequently reported to cause higher emissions of N2O than assumed by IPCC and as used in this study and in most previous calculations and reports (e.g., The Royal Society63)Reference Crutzen, Mosier, Smith and Winiwarter64. According to Crutzen et al.Reference Crutzen, Mosier, Smith and Winiwarter64, the N2O-emissions from rapeseed are 3–5 times higher than reflected by IPCCReference Eggleston, Buendia, Miwa, Ngara and Tanabe17 default values and current state of life cycle analysis. Assuming five times higher N2O-emissions for rapeseed, total GHGE from milk would increase by an average of about 2%—or even more in the case of LUC—for the conventional PS.
Reducing energy required for mineral fertilizers and fuels
Besides the production of renewable energy from biogas (as stated in ‘Manure management’ section), the application of fertilizers and related management measures deserve specific attention concerning their contribution to GHGE. Because emissions from soil increase when the available amount of N in the soil increasesReference Eggleston, Buendia, Miwa, Ngara and Tanabe17, the quantity of nitrogen applied must be thoroughly adjusted to the requirements of plants. Furthermore, mineral fertilizers that need large amounts of (fossil) energy during production and transport should be substituted as much as possible by livestock manure. On a long-term basis, housing and manure management systems should therefore be designed in a way that the emissions of nitrogen are kept as low as possible. According to IPCCReference Eggleston, Buendia, Miwa, Ngara and Tanabe17 and calculations herein, pasture can be expected to protect nitrogen very well against emission processes. The use of fossil energy can also be reduced if feeding is generally based on the utilization of pastures and the avoidance of feedstuffs transported over long distances. As an example, the transport of soybeans from Brazil and of extracted soybean meal to be used in PS Lcon requires 12.3 liters of diesel per cow and year (0.57% of total GHGE).
Conclusions
From the results presented herein and from information provided in the literature, it is concluded that organic milk PS are superior over conventional systems in terms of GHGE both per ha of farmland and per kg of milk. A relevant factor for these differences is LUC as a source for emissions, especially associated with soybean production in South America. For the systems considered in this study, the difference in GHGE per kg of milk between conventional and organic systems depends on the site-specific conditions for agricultural production: the higher the potential milk output per cow, the lower the differences that can be expected.
Regardless of the actual production system, the greatest proportion of GHGE originates from enteric fermentation. Although this inevitable source of emissions can be influenced quantitatively, clear limits exist for the degree of reduction that can be reached. Apart from enteric fermentation, manure management and forage supply also contribute substantially to GHGE. Consequently, dairy PS in which the focus lies on optimum forage quality, a high proportion of pasturage and additional fermentation of the manure in biogas plants will produce relatively low GHGE.
Despite the focus of this paper, the question of sustainable food production should not be restricted to factors that are currently discussed in connection with climate change. However, organic and low-input PS undoubtedly possess a number of strong points with regard to ecological and ethical aspects of sustainability.


