INTRODUCTION
Estuaries are transition zones between rivers and the sea. The phytoplankton of these important zones is the main source for primary production, and plays a key role in estuary ecosystems via the composition diversity and abundance variation (Yoshiyama & Sharp, Reference Yoshiyama and Sharp2006; Gonzalez del Rio et al., 2007; Popovich & Marcovecchio, Reference Popovich and Marcovecchio2008; Costa et al., Reference Costa, Huszar and Ovalle2009; Domingues et al., Reference Domingues, Anselmo, Barbosa, Sommer and Galvão2011a, Reference Domingues, Anselmo, Barbosa, Sommer and Galvaob). The basis of all the food webs in estuary ecosystems (Juhl & Murrell, Reference Juhl and Murrell2005; Lionard et al., Reference Lionard, Azemar, Bouletreau, Muylaert, Tackx and Vyverman2005; Thompson et al., Reference Thompson, Bonham and Swadling2008; Quinlan et al., Reference Quinlan, Jett and Phlips2009), some of phytoplankton species occasionally bloom and accumulate into ‘red tides’, posing a threat to the aquatic ecosystem (Thomas et al., Reference Thomas, Perissinotto and Kibirige2005; Badylak et al., Reference Badylak, Phlips, Baker, Fajans and Boler2007; Livingston, Reference Livingston2007; Boyer et al., Reference Boyer, Kelble, Ortner and Rudnick2009; Tas et al., Reference Tas, Yilmaz and Okus2009; Guinder et al., Reference Guinder, Popovich, Molinero and Perillo2010). Information on the phytoplankton of an estuary is necessary to understand the structure and function of the ecosystem, and to monitor the fisheries resource productivity and water quality.
The Changjiang estuary is one of the largest estuaries in the world. It has formed a large wet, sandy delta with moderate tides, featuring a geomorphological pattern of ‘three bifurcations and four outlets’. The Changjiang River Three Gorges Project, damming the river, was implemented in November 1997 and completed in 2009. The phytoplankton community in the Changjiang estuary has been extensively investigated (Guo & Yang, Reference Guo and Yang1992; Gu et al., Reference Gu, Yuan, Yang and Hua1995b; Gao & Song Reference Gao and Song2005; Zhou et al., Reference Zhou, Shen and Yu2008; Zhu et al., Reference Zhu, Ng, Liu, Zhang, Chen and Wu2009; Jiang et al., Reference Jiang, Yu, Song, Cao and Yuan2010; Li et al., Reference Li, Li, Tang, Wang, Liu and He2010). The present paper outlines a comprehensive analysis of the phytoplankton community of the Changjiang estuary, focusing on its important ecological features.
MATERIALS AND METHODS
Study area and sampling
The Changjiang estuary covers a large portion of Shanghai and a portion of Jiangsu Province. It includes a near-shore zone (the near-shore zone of the East China Sea) (Mikhailov et al., Reference Mikhailov, Korotaev, Mikhailova, Li and Liu2001) and a river section, the upper boundary of which is Datong on the main course of the Changjiang River (624 km upstream from the estuary). The morphometric characteristics of this area are: maximum water flow of 9.26 × 10⁷ dm3s−1 and minimum of 4.62 × 10⁶dm3s−1, with a mean annual water flow of 2.93 × 10⁷ dm3s−1, and the annual water discharge amountsd to 9.21 × 10¹⁴dm3. Water discharge is highly variable at different times in the Changjiang estuary, with 71.7% of the annual value in the flood period (May–October) and 28.3% in the dry period (November–April). The convergence of near-bottom flow associated with the estuarine circulation maintains the turbidity at a maximum, a typical phenomenon reflecting the settling and resuspension of fine sediment and acting as a filter in the estuary (Shen & Pan, Reference Shen and Pan2001).
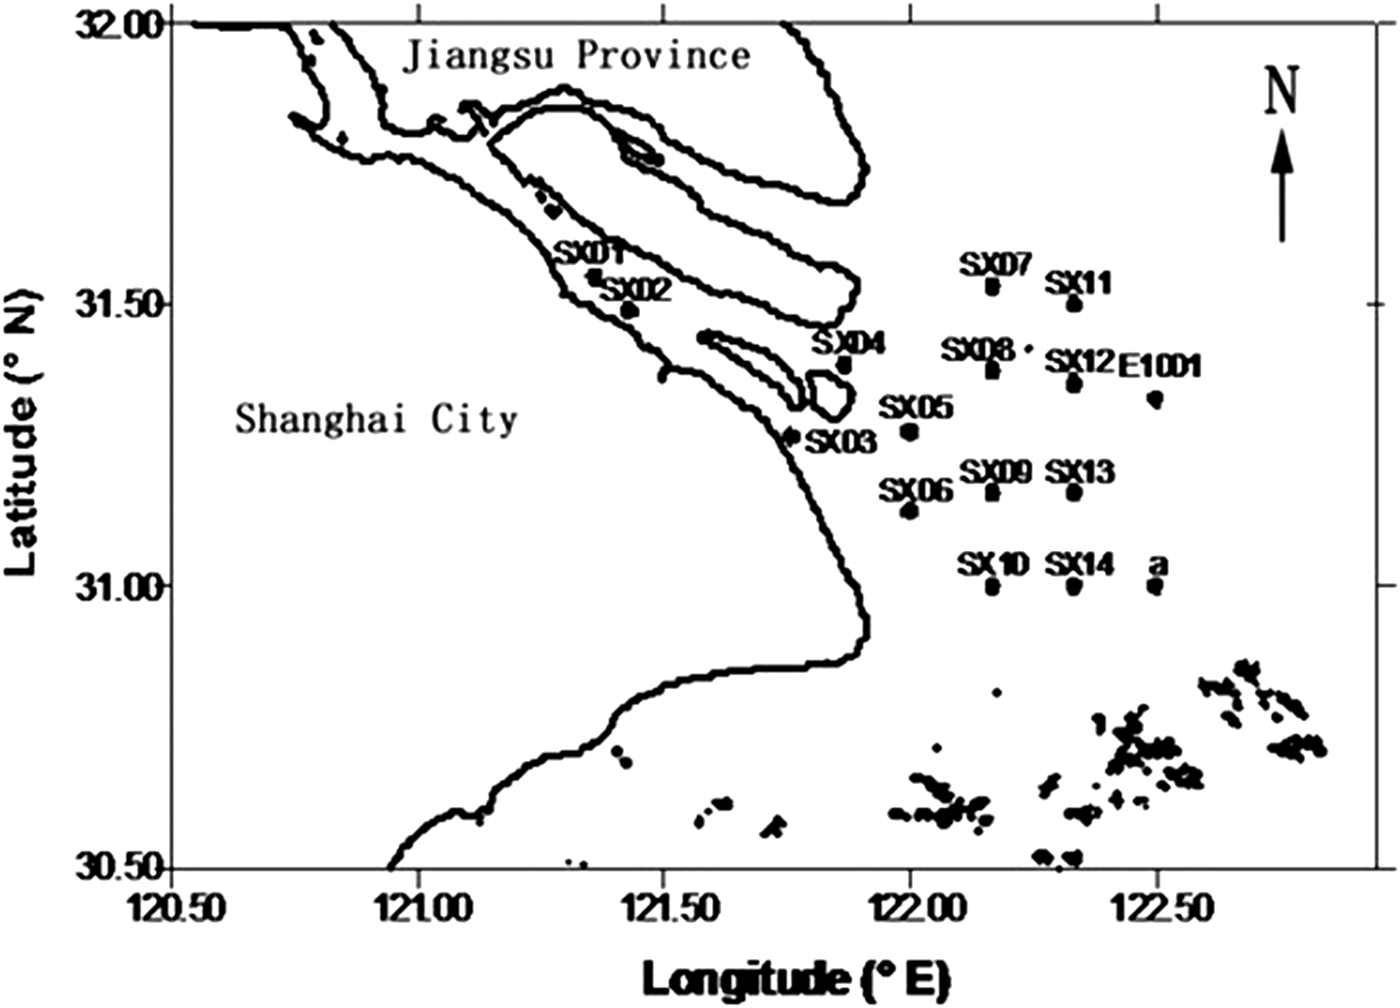
Sixteen sampling stations were located in Changjiang estuary between the coordinates 31°00′–31°32′N and 121°21′25″–122°30′E (Figure 1). The stations from SX01 to SX06 were continuous sampling stations. The biological, chemical and hydrological investigations were carried out in February and March 1999 (the dry period), August 1999 (the flood period) and February and March 2000 (the dry period). Quasi synoptic observation for spring–neap tide was conducted at each continuous station. Water flow velocity and direction were simultaneously sampled at 1 h interval for a period of at least 12 h. The sampling interval was reduced to 0.5 h during slack tide, peak flood tide and peak ebb tide. Samples for hydrochemical and chlorophyll-a investigations were collected at surface, medium and bottom layers at different phases during rapid tidal flow. Phytoplankton was collected after tidal fluctuation. Unlike the continuous sampling stations SX01–06, irregular phytoplankton sampling was adopted for the other stations (SX7–14, E1001, a).

Fig. 1. Hydrographic basin of Changjiang estuary and the location of sampling stations.
Phytoplankton acquisition and processing
A qualitative phytoplankton sampler (shallow water type III) was employed for different layers, and the samples were fixed with neutral formaldehyde solution (5% sample volume). The phytoplankton samples for quantitative analysis were prepared according to the specification for oceanographic marine biological survey (GB 12763.6-91) (State Bureau of Technical Supervision of China, 1991). A quantitative phytoplankton sampler was used in the surface layer and the bottom layer to a final volume of 1 dm3, and the samples were fixed with saturated iodine solution (6–8 ml). The collected samples were brought back to the laboratory for further study. The fixed water samples were concentrated or diluted to an appropriate volume according to the amount of phytoplankton in the samples. The sample was stirred with a sampling tube. The tube was quickly turned upright in the sample and 0.5 ml samples were placed into plankton counting chamber. A cover slip was put on the chamber, then the phytoplankton was identified and counted by microscope. Dinoflagellates and other flagellates were identified by a combination of in vivo and fixed water samples. Sediment concentration was estimated by the gravimetric method, and salinity and nutrients were estimated by salinometer and spectrophotometric methods under the specification for marine monitoring (GB17378-1998) (State Bureau of Technical Supervision of China, 1998).
Statistical analysis
DETERMINATION OF DOMINANT SPECIES
The Dominance Index (Y) (Xu et al., Reference Xu, Wang, Chen and Shen1995), was found using the equation:
where n i is individual amount of the species organism, N is total individual amount and f i is occurrence frequency. Dominant species was determined to >0.01 significance level.
PHYTOPLANKTON COMMUNITY STRUCTURE
Phytoplanktonic taxa with high frequency of occurrence were included in a cluster analysis. The Pearson correlation coefficient was employed as the distance measure between the group centres (Sneath & Sokal, Reference Sneath and Sokal1973).
BIODIVERSITY INDEX
The Simpson diversity index (D) (Simpson, Reference Simpson1949), the Shannon–Weaver diversity index (H) (Shannon & Weaver, Reference Shannon and Weaver1963), and the evenness index (J) (Pielou, Reference Pielou1966), were calculated according to the following equations:
 $$\eqalign{D & = 1 - \sum_{i = 1}^S \lpar n_i / N\rpar ^2 \cr H &= -\sum_{i = 1}^S \lpar n_i / N\rpar \log_2 \lpar n_i / N\rpar \cr J &= {H \over \log_2^S}\comma \; }$$
where N i is individual amount of the species organism, N is total individual amount and S is total species at any station.
RESULTS
Species diversity and ecotypes of phytoplankton
PHYTOPLANKTON COMPOSITION
In summary, 208 species (varieties included) were recorded in this study, belonging to 109 genera (Table 1). Diatoms was the group with the highest specific richness of 143 species (68.75%), while Chlorophyta were represented by 31 species (14.76%) in 19 genera, and Cyanobacteria contributed 17 species (8.10%) in 14 genera. There were 10 species of Dinoflagellata in six genera, four species of Euglenophyta in three genera, two species (one genus) of Xanthophyta and only one species in Ochrophyta. The diatoms genera with the highest species number were Chaetoceros (14 species), Coscinodiscus (14 species) and Thalassiosira (nine species).
Table 1. Phytoplankton species collected in the Changjiang estuary during the entire sampling period.

*, Dominant species
PHYTOPLANKTON ECOTYPES
Judging from the distribution and ecological characteristics of phytoplankton in the Changjiang estuary, the phytoplankton community was divided into the following five ecotypes:
(1) Freshwater species, including Aulacoseira granulata, Fragilaria sp., Cymatopleura solea, Cyclotella comta, Pediastrum simplex var. clathratum, Monoraphidium griffithii, Monactinus simplex, Tribonema sp. and others. Due to the river run-off in the estuary, this ecotype species was observed in waters with a salinity value of <5.
(2) Estuary brackish water species, including Paralia sulcata, Ceratoneis closterium Nitzschia sigma, Nitzschia punctata and others. Highest abundance (2.80 × 10³ ind. dm−3) of these species was observed in the bottom layer, compared to the surface layer (1.45 × 10³ ind. dm−3) during the flood period in 1999.
(3) Inshore low salinity species, including Thalassionema frauenfeldii, Odontella sinensis, Thalassiosira anguste-lineata, Ditylum brightwelli, Neoceratium tripos, Neoceratium fusus, Neoceratium longissimum, Chaetoceros castracanei, Chaetoceros denticulatus, Actinoptychus trilingulatus, Bellerochea malleus and others.
(4) Inshore widespread species, including Skeletonema costatum, Rhizosolenia setigera, Thalassionema nitzschioides and others. Skeletonema costatum was the dominant species during all the periods for all the sampling stations, with a minimum 45.21% of the whole phytoplankton abundance in the dry period.
(5) Off-sea high salinity species, including Neocalyptrella robusta, Pseudosolenia calcar-avis, Chaetoceros lorenzianus, Proboscia alata, Thalassiosira subtilis, Rhizosolenia styliformis and others. Neocalyptrella robusta and Pseudosolenia calcar-avis were widespread species.
Phytoplankton community structure
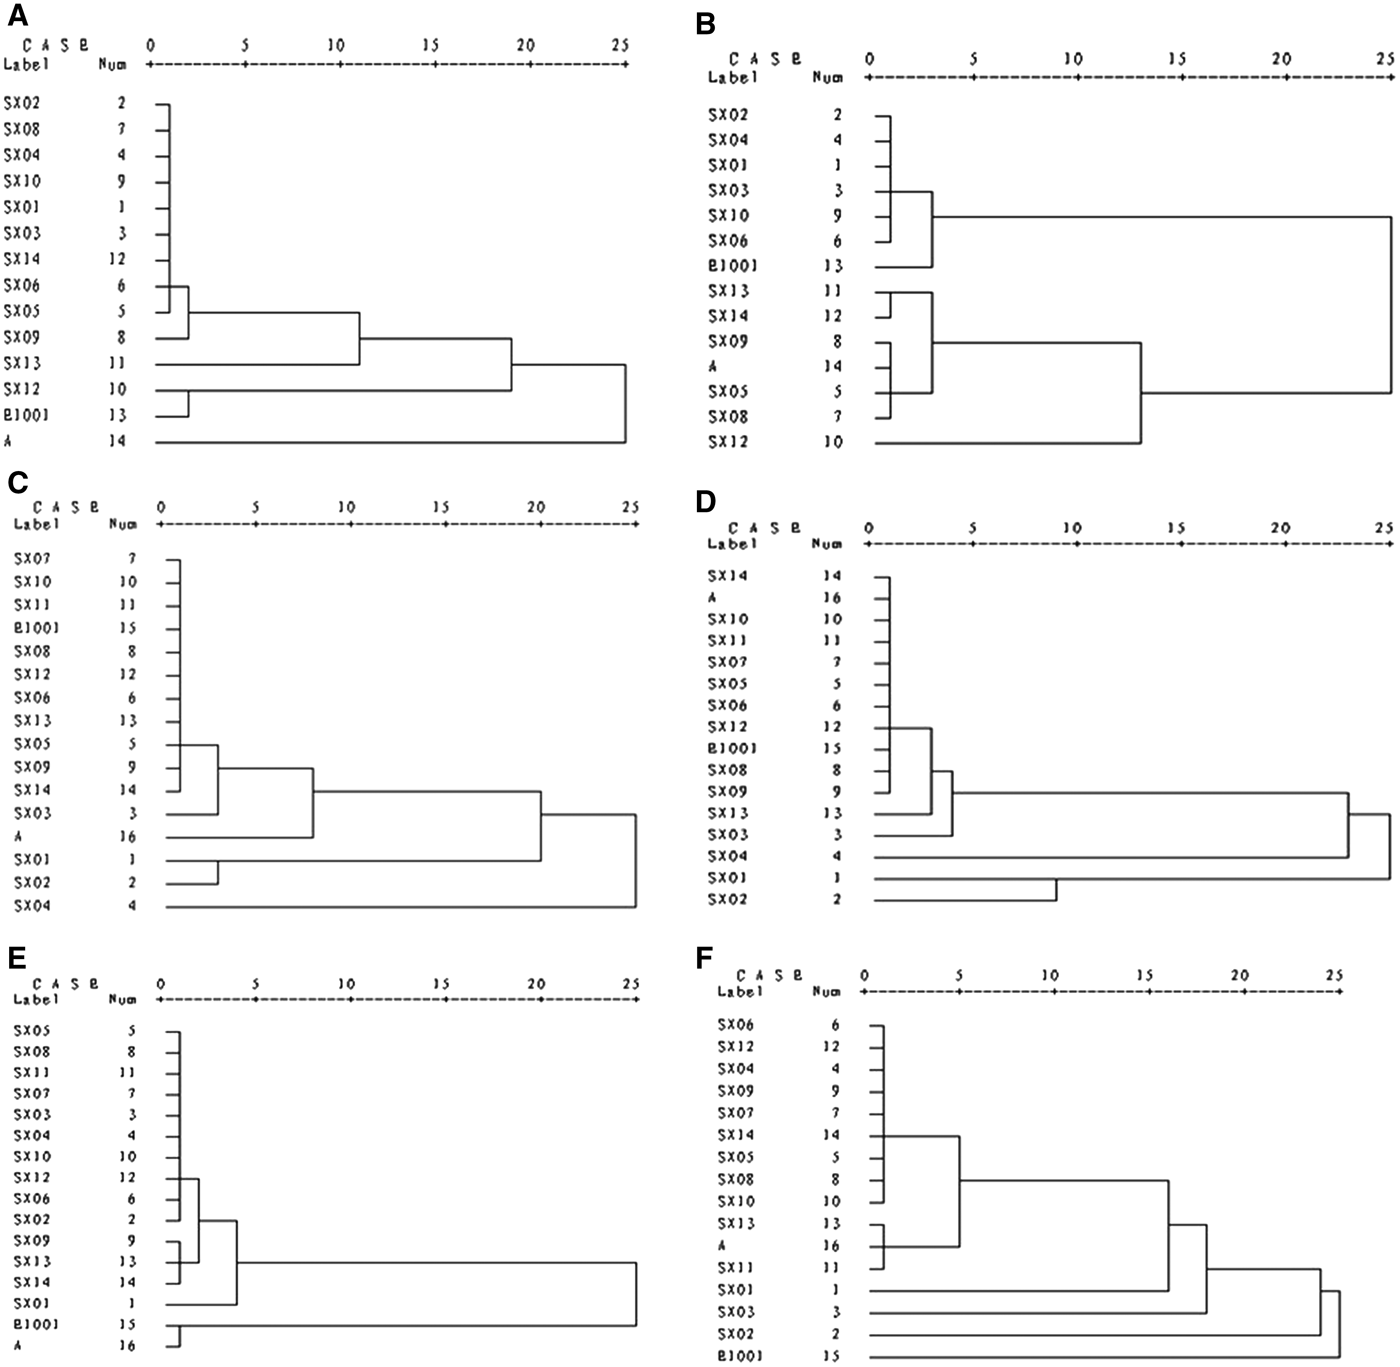
The classification for the phytoplankton community (Figure 2A–F) was produced using cluster analysis. During the dry period in 1999, there was no significant difference in community structure among the sampling stations SX01–SX14, with a, SX12, E1001 stations as the exceptions (Figure 2A). Thus, phytoplankton in the surface layer in the dry period can be generally classified into estuary inshore and offshore populations. Community structure in the bottom layer is distinguished from that in the surface layer over the same time scale (Figure 2B). The whole phytoplankton community structure fell into two major groups. Based on high similarity, SX05, SX08, SX09, SX12, SX13, SX14 and a sampling stations were considered as one group, whilst the rest fell into the other group. During the flood period in 1999, the population structures of the two layers were different in only three stations: SX01, SX02 and SX04 (Figure 2C, D), consisted of estuary, inshore and offshore populations. This may have resulted from the within river estuary locations of these stations. The river run-off was obviously increased during the flood period, leading to relatively lower salinity. Therefore, more freshwater species in waters affected by the run-off resulted in the inshore and offshore population difference. For the dry period in 2000, the population structure of the surface layer (Figure 2E) was similar to that of 1999, and there was no significant difference in community structure among the sampling stations, with the exceptions of a and E1001. Moreover, community structure of the bottom layer in 2000 was distinguished from that of the surface layer (Figure 2F), coinciding with that in 1999. Notably, only sampling stations SX01–SX03 in the estuary and sampling station E1001 offshore were different, suggesting that the bottom layer in the estuary was composed of the estuary low salinity ecotype represented by freshwater and low-salinity phytoplankton.

Fig. 2. Dendrogram of phytoplankton in the Changjiang estuary during dry and flood periods: (A) during the dry period in 1999 in the surface layer; (B) during the dry period in 1999 in the bottom layer; (C) during the flood period in 1999 in the surface layer; (D) during the flood period in 1999 in the bottom layer; (E) during the dry period in 2000 in the surface layer; and (F) during the dry period in 2000 in the bottom layer.
Analysis of the biodiversity
PHYTOPLANKTON PERIOD CHANGE
The phytoplankton biomass was most abundant in the flood period in 1999, with 142 species observed, including 85 diatoms, 26 Chlorophyta, 16 Cyanobacteria, nine Dinoflagellata, three Euglenophyta, two Xanthophyta and one Ochrophyta. There were only 86 phytoplankton species in the dry period of 1999, with 81 diatoms, two Chlorophyta, two Dinoflagellata and one Cyanobacteria. During the dry period in 2000, 116 species were found: 85 diatoms, 15 Chlorophyta, six Dinoflagellata, three Euglenophyta, seven Cyanobacteria. Xanthophyceae and Chrysophyceae were only present in August, 1999.
SPECIES DIVERSITY
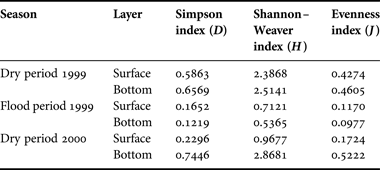
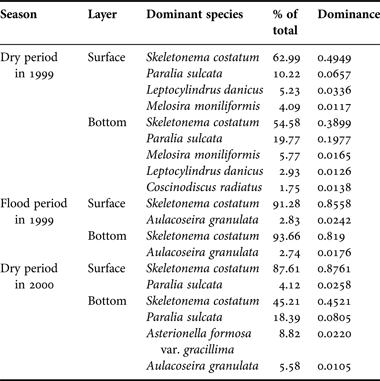
Overall, the Simpson index (D) coincided with Shannon–Weaver index (H) for the phytoplankton community in the Changjiang estuary (Table 2). Highest values of the diversity indices (D and H), evenness index (J), and spatial heterogeneity were in the dry period of 1999, with 48 and 44 species present in the surface and bottom layers, respectively, and 4–5 dominant species for both layers. The dominance of Skeletonema costatum in the surface and bottom layer varied between 62.99% and 54.58%, coupled with Paralia sulcata between 10.22% and 19.77%. For the flood period in 1999, 68 and 45 species were observed in the surface and bottom layers, respectively, with Skeletonema costatum (91.28% and 93.66%, respectively) and Aulacoseira granulata (2.83% and 4.12%, respectively) as the dominant species. For the dry period in 2000, there were 49 species in the surface layer and Skeletonema costatum and Paralia sulcata were the dominant species. Algae abundance was relative and restricted to Skeletonema costatum (87.61%). However, higher diversity (0.7446, 2.8681) and evenness (0.5222) registered in the bottom layer, compared with the values in the surface layer (0.2296, 0.9677 and 0.1724). Skeletonema costatum accounted for 45.12% of the total abundance, along with other three dominant species.
Table 2. Diversity Index and Evenness Index of phytoplankton in the Changjiang estuary.

Quantitative distribution
PHYTOPLANKTON DISTRIBUTION
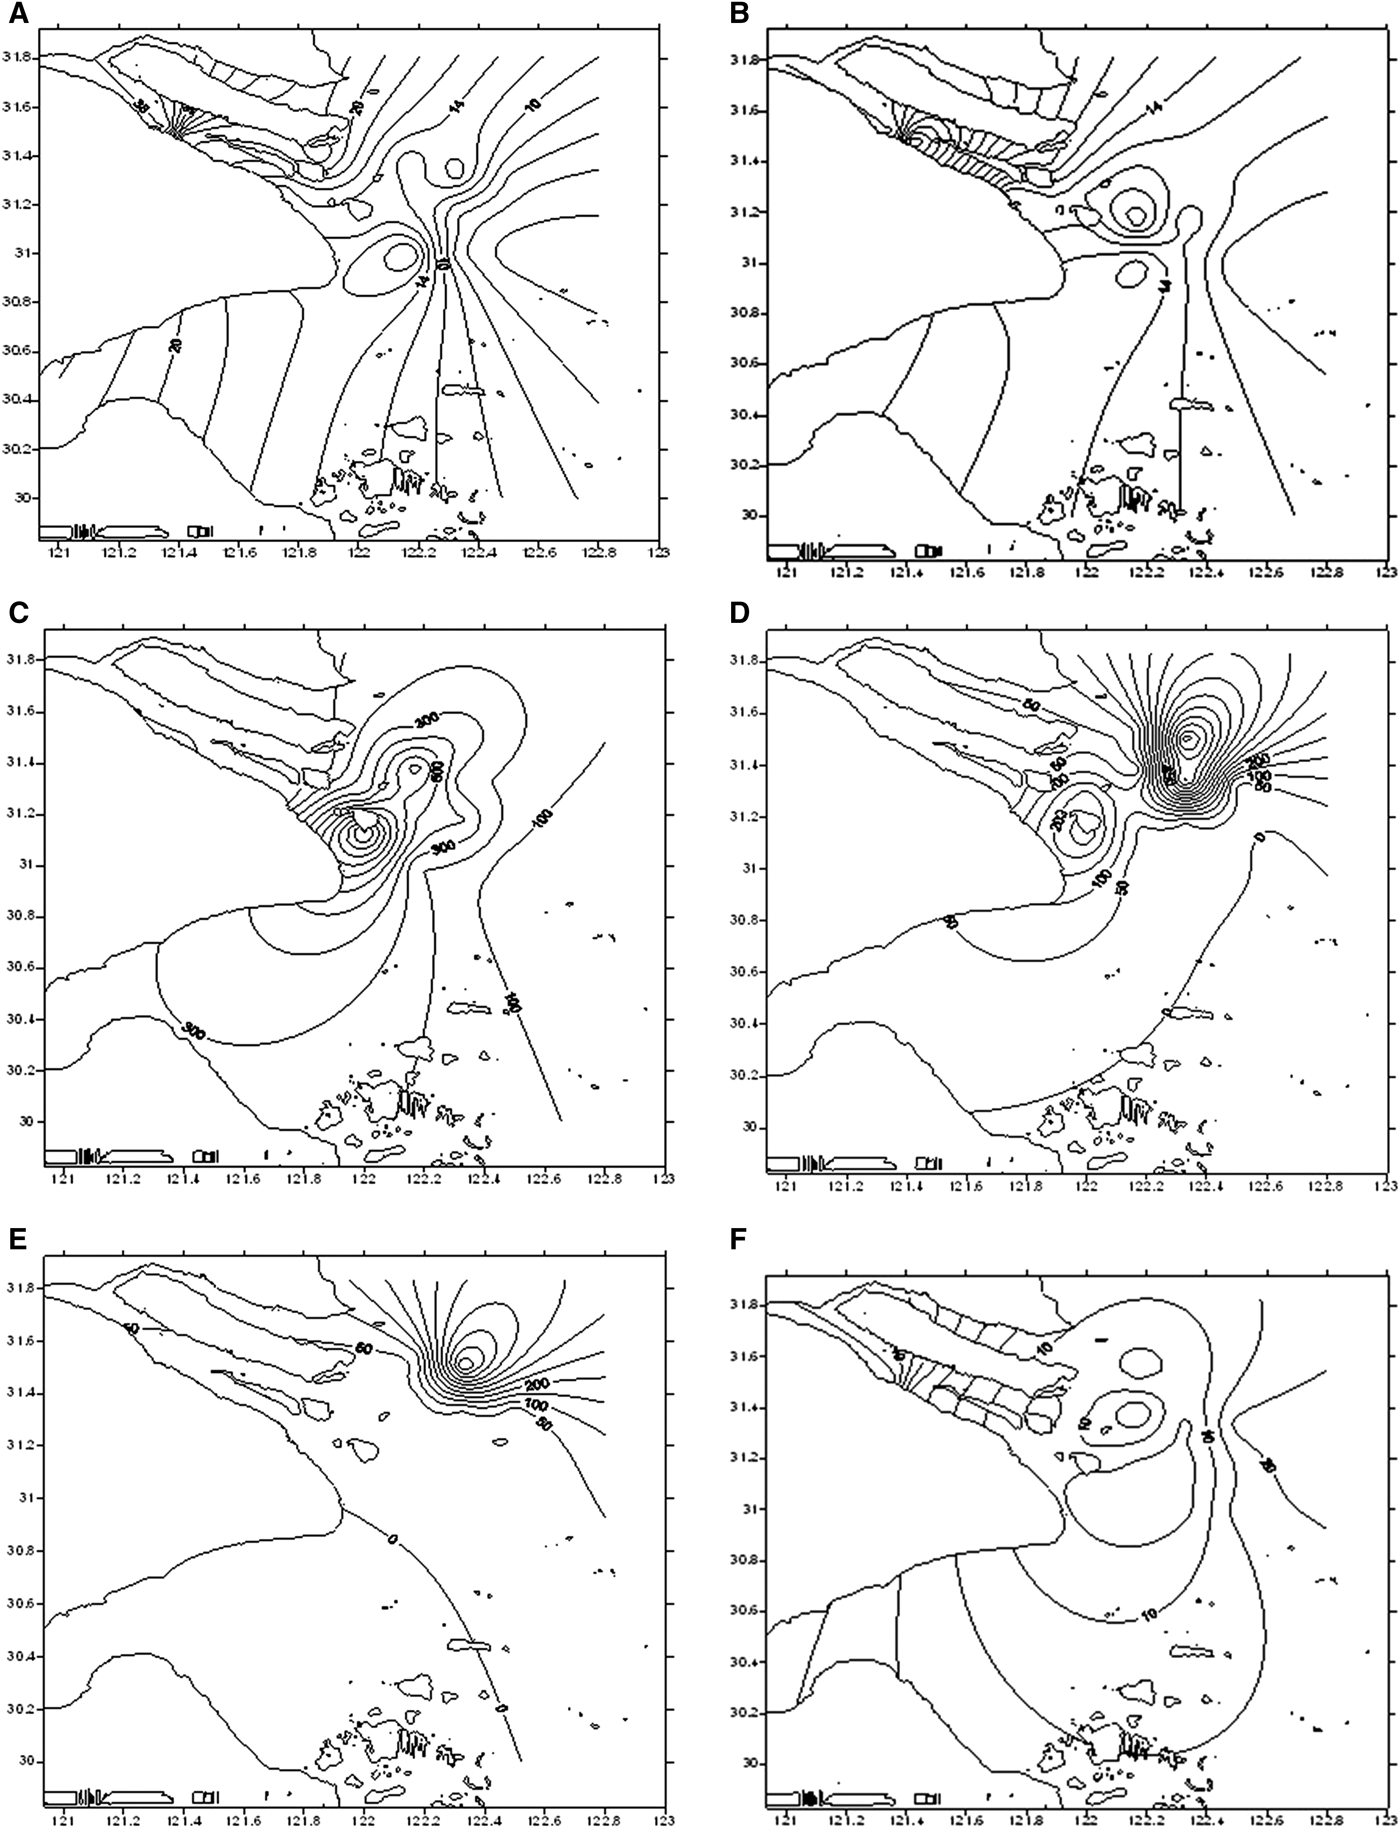
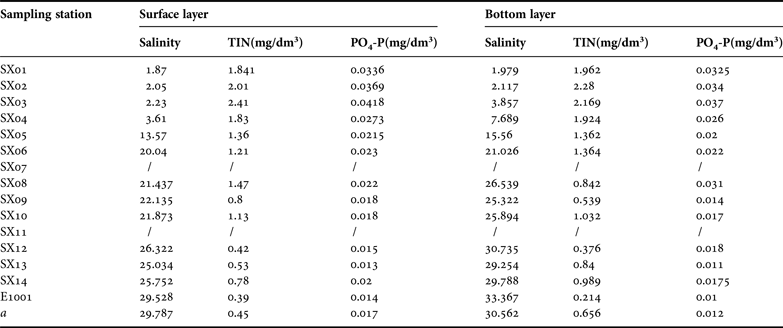
The salinity and nutrients in the Changjiang estuary during the dry periods in 1999 are shown in Table 3. The phytoplankton abundance in the surface layer decreased from the estuary (38.17 × 10³ ind. dm−3) to the offshore during the dry period in 1999, with the highest density area (20.64 × 10³ ind. dm−3) at the south near-shore SX10 sampling station and lowest density area (15.44 × 10³ ind. dm−3) at the SX12 sampling station (Figure 3A). Higher abundance in the estuary was also observed in the bottom layer (Figure 3B), highest at the SX02 sampling station (40.47 × 10³ ind. dm−3) and decreased offshore. At the SX09 and SX10 stations the phytoplankton was distributed unevenly, with high density (17.09 × 10³ ind. dm−3) and low density (4.17 × 10³ ind. dm−3) areas.

Fig. 3. The distribution of phytoplankton in the Changjiang estuary during dry and flood periods: (A) during the dry period in 1999 in the surface layer; (B) during the dry period in 1999 in the bottom layer; (C) during the flood period in 1999 in the surface layer; (D) during the flood period in 1999 in the bottom layer; (E) during the dry period in 2000 in the surface layer; and (F) during the dry period in 2000 in the bottom layer.
Table 3. Salinity and nutrients in the Changjiang estuary during the dry periods in 1999.

For the surface layer in the flood period in 1999, abundance was lower in the estuary and offshore area (Figure 3C), reaching 65.90 × 10³ and 56.65 × 10³ ind. dm−3 at estuary locations SX03 and SX04, and 33.20 × 10³ ind. dm−3 at the offshore a sampling station. Two concentrated areas emerged in the inshore region: SX06 (1277.88 × 103 ind. dm−3 and SX08 (757.70 × 10³ ind. dm−3). The general observation of the bottom layer was similar to the results from the surface, (Figure 3D). Sampling stations SX05 and SX06 in the estuary formed a concentrated area, with 237.15 × 10³ ind. dm−3 and 294.45 × 10³ ind. dm−3, respectively. Highest concentration was located at the SX11 (785.81 × 10³ ind. dm−3) and SX12 (674.20 × 10³ ind. dm−3) stations. Sampling station a only obtained a value of 6.80 × 10³ ind. dm−3.
For the surface layer in the dry period in 2000 (Figure 3E), the SX11 sampling station (611.0 × 10³ ind. dm−3) on the north coast of the inshore was the highest concentration area. The other stations varied from 8.9 × 10³ to 55.3 × 10³ ind. dm−3. For the bottom layer (Figure 3F), estuary and offshore had the highest abundance, with the highest amount of 46.90 × 10³ ind. dm−3 at station SX01. In the inshore area, SX10 was as low as 2.45 × 10³ind. dm−3, and the only concentrated region was located at SX08 (20.6 × 10³ ind. dm−3).
Notably, some species can predominate in some local waters. During the dry period in 1999, Aulacoseira granulata accounted for 2.26% and 2.09% in the surface and bottom layers, respectively. In the surface layers of SX06 and SX08 sampling stations, this species can reach 1.03 × 10³ and 2.2 × 10³ ind. dm−3, respectively. In the surface layers of SX10, SX13 and SX14 sampling stations, it was 1.23 × 10³, 1.54 × 10³ and 1.39 × 10³ ind. dm−3, respectively. During the dry period in 2000, Asterionella formosa var. gracillima accounted for 3.26% in the surface layer, with 16.00 × 10³ and 13.20 × 10³ ind. dm−3 at SX01 and SX02 sampling stations, respectively. At SX01 sampling station, 5.40 × 10³ ind. dm−3 and 10.80 × 10³ Ind. dm−3 were observed for Synedra sp. (3.13%) and Cyanobacteria (6.70%). During the flood period in 1999, Trichodesmium thiebautii accounted for 2.32% and 1.08% in surface and bottom layers, respectively, with 30.00 × 10³, 20.00 × 10³ and 27.70 × 10³ind. dm−3 at SX04, SX05 and SX14 sampling stations, respectively.
DOMINANT SPECIES DISTRIBUTION
Inferred from the Dominance Index (Y) for the dominant phytoplankton species (Table 4), diatoms had the greatest species richness in both the dry and flood periods. They were mainly freshwater species, estuary brackish water species and inshore widespread species. Skeletonema costatum was dominant in the surface and bottom layers, accounting for up to 90% of the total phytoplankton abundance during the flood period.
Table 4. Dominant species of phytoplankton in the Changjiang estuary.

The dry period in 1999
The following results are based on the analysis of the dominant species Paralia sulcata and Skeletonema costatum. Paralia sulcata formed two concentrated areas close together in the inshore and offshore regions: one was centred on SX09 (4.05 × 10³ ind. dm−3) and the other on SX12 (5.9 × 10³ ind. dm−3) and E1001 (4.50 × 10³ ind. dm−3) (Figure 4A). The abundance of Skeletonema costatum decreased from estuary to the offshore (Figure 4B), similar to the previous results for total abundance in the surface layer (Figure 3A). The concentrated areas were located at estuary station SX01 (34.31 × 10³ ind. dm−3) and inshore station SX10 (16.12 × 10³ ind. dm−3), respectively.

Fig. 4. The distribution of dominant species of phytoplankton in the Changjiang estuary during dry and flood periods: (A) Paralia sulcata (the dry period in 1999 in the surface layer); (B) Skeletonema costatum (the dry period in 1999 in the surface layer); (C) Paralia sulcata (the dry period in 1999 in the bottom layer); (D) Skeletonema costatum (the dry period in 1999 in the bottom layer); (E) Skeletonema costatum (the flood period in 1999 in the surface layer). The distribution of dominant species of phytoplankton in the Changjiang estuary during dry and flood periods: (F) Skeletonema costatum (the flood period in 1999 in the bottom layer); (G) Paralia sulcata (the dry period in 2000 in the surface layer); (H) Skeletonema costatum (the dry period in 2000 in the surface layer); (I) Paralia sulcata (the dry period in 2000 in the bottom layer); (J) Skeletonema costatum (the dry period in 2000 in the bottom layer).
In the bottom layer (Figure 4C), among the three concentrated regions observed for Paralia sulcata, the inshore region centred around stations SX05 and SX08 contributed to the concentrated region found in Figure 3B. There was a decrease from the estuary to the offshore for Skeletonema costatum (Figure 4D).
The flood period in 1999
The distribution pattern for Skeletonema costatum was observed for this period. The two concentrated areas for the surface layers at the inshore stations SX06 (1260.38 × 103ind. dm−3) and SX08 (740.30 × 10³ ind. dm−3) represented 98.63% and 97.70%, respectively (Figure 4E). The two concentrated areas for the bottom layers were around SX05 and SX06 (229.28 × 10³ 289.23 × 10³ ind. dm−3, respectively) and SX11 and SX12 (784.60 × 10³ and 664.60 × 10³ ind. dm−3, respectively) (Figure 4F).
The dry period in 2000
There were no Paralia sulcata in the surface layer in the estuary, but an increase was observed from the inshore to offshore (Figure 4G). Skeletonema costatum was abundant in the north inshore (Figure 4H), especially at the SX11 sampling station (606.20 × 10³ ind. dm−3), probably resulting in the concentrated area in Figure 3E.
For the bottom layer, Paralia sulcata increased from the estuary moving offshore, reaching 14.70 × 10³ind. dm−3 at the offshore E1001 station (Figure 4I). The species accounted for 66.82% of the total abundance, having an major influence on the distribution of Figure 3F. Skeletonema costatum decreased as Paralia sulcata increased (Figure 4J). Skeletonema costatum formed concentrated areas, with different densities in the estuary and inshore regions, leading to the distribution pattern in Figure 3F.
In summary, the distribution for the two layers in the different period was mainly determined by the distribution of the dominant species.
DISCUSSION
Zhu et al. (Reference Zhu, Ng, Liu, Zhang, Chen and Wu2009) investigated the phytoplankton community in the Changjiang estuary. Results indicated that in spring diatoms and chlorophytes contribute equally to phytoplankton biomass, while phytoplankton community structure is mainly composed of diatoms in the summer. A comparative study analysing the shift of phytoplankton composition from the mid-1980s to the 2000s was also made in the Changjiang estuary. The proportion of diatoms in the whole phytoplankton community showed a decreasing trend from about 85% in 1984 to about 60% in 2000 (Zhou et al., Reference Zhou, Shen and Yu2008) and from 84.6% during 1985–1986 to 69.8% during 2004–2005 (Jiang et al., Reference Jiang, Yu, Song, Cao and Yuan2010). Gao et al. (Reference Gao and Song2005) examined phytoplankton taxonomic composition, abundance, diurnal variability and spatial distribution in the Changjiang estuary from 19 to 26 May 2003. Eighty-seven species, including 54 species of diatoms were identified. Correlation between phosphorus and abundance supported the conclusion that phosphorus is the controlling factor in phytoplankton growth in the Changjiang estuary, where light is not limiting. However, there is only limited long-term ecological data, especially from the period before the completion of the Three Gorges Project completion. Such a study, emphasizing the influences of human activities is a prerequisite for improving the estuarine ecosystem and its response to environmental stress. There are 35 species simultaneously found in our three surveys, including 33 diatoms, together with Pediastrum simplex var. clathratum (Chlorophyceae) and Neoceratium fusus (Dinophyceae). The diatoms with the highest number of species were also observed in the studies of the Buragauranga estuary (Ahmed et al., Reference Ahmed, Hoque, Ohlson, Akanda and Moula2010), the Tagus estuary (Gameiro & Brotas, Reference Gameiro and Brotas2010), the Pearl River estuary (Qiu et al., Reference Qiu, Huang, Zhang and Lin2010), the Mahanadi estuary (Naik et al., Reference Naik, Acharya and Mohapatra2009) and the Karstic Zrmanja estuary (Buric et al., Reference Buric, Cetinić, Viličić, Mihalić, Carić and Olujić2007), with different phytoplankton compositions and relative proportions. Dominant species for the Changjiang estuary in 1999 and 2000 were different from the previous report in 1988 (Gu et al., Reference Gu, Yuan, Sheng and Zhou1995a, Reference Gu, Yuan, Yang and Huab). Pseudo-nitzschia pungens, Neocalyptrella robusta, Chaetoceros lorenzianus and Pseudosolenia calcar-avis were dominant species in 1988, but less observed in 1999 and 2000. Eucampia zoodiacus was dominant during 1988, but was absent during this study. It is concluded that the phytoplankton community changed during the intervening ten years, reflecting the variation of aquatic environmental factors. The dominance of Skeletonema costatum was similar to the results in 1996 and 1997 (Xu et al., Reference Xu, Bai, Yuan, Jiang and Gu1999), but the other dominant species, Oscillatoria and Cosmarium, decreased significantly in this study. A higher diversity index and evenness index appeared in the dry period because of the simple dominant species composition in the flood period. Moreover, during the flood period, Skeletonema costatum showed an overwhelming dominance and was crucial to the population structure. Skeletonema costatum was also the dominant species in other estuaries. Thompson et al. (Reference Thompson, Bonham and Swadling2008) investigated diatom abundance in the microtidal, salt wedge Huon estuary in Tasmania. Diatoms dominated the spring bloom, when Skeletonema costatum had the highest net growth rates, and fucoxanthin-specific gross growth rates were similar to 0.9 d (−1). Seasonal changes in the diatoms was examined in the neritic zone of the Urdaibai estuary (northern Spain). Cell maxima in late summer were produced by the diatoms Chaetoceros salsugineum and Skeletonema costatum (Trigueros & Orive, Reference Trigueros and Orive2001).
Among all the ecotypes, the freshwater ecotype Aulacoseira granulata was one of the most abundant species during the flood period in 1999. The species covered the 122°20′E at sampling station SX14, with the observation of 9.08 × 10³ and 4.10 × 10³ ind. dm−3 in the surface and bottom layers, respectively. As one of the dominant phytoplankton in the dry period, the centric diatom Paralia sulcata is a typical species of brackish and marine waters, and at the sampling stations a and E1001 showed a relatively wide distribution. Paralia sulcata also was one of the most common and dominant at all stations in both water column and surface sediment in the Akkeshi-ko estuary, eastern part of Hokkaido, Japan (Kasim et al., Reference Kasim and Mukai2006). Inshore low salinity species was in the east of the 122°10′E, found during all the periods with low quantity. Although there were few tropical coastal low-salinity species, but it indicated the influence of the warm current on the Changjiang estuary. A small quantity of the coastal cold water species Thalassiosira nordenskioeldii (0.6 × 10³ind. dm−3) was restricted to the SX12 station during the dry period in 2000. The inshore widespread species Skeletonema costatum had a dominance of over 90% in the two layers during the flood period. The off-sea high salinity species Neocalyptrella robusta extended as far as the SX03 station, suggesting its adaptability to the low-salinity waters. In 1999, the run-off of the Changjiang River had a considerable effect on the population structure during the flood period. And during the dry period in 1999, the population in the near-shore region was mainly composed of estuary and inshore species, while the offshore region was mainly high-salinity species. The inshore population is found at the mouth of the Changjiang River. High turbidity due to suspended sediment in the bottom layer contributes to the difference between this area and its surroundings, as well as the difference in the phytoplankton composition. During the dry period in 2000, phytoplankton of the surface layer was divided into estuary inshore and offshore populations.
Vertically, during the flood period in 1999, phytoplankton abundance was higher in the surface of the estuary and inshore than in the bottom layer, but lower in the surface of the offshore region. Overall, the abundance difference between the two layers amounted to 1–3 times, with a maximum of 5 times. As one of the dominant species, Paralia sulcata made a slight contribution to the concentrated area in the surface layer of the near-shore, but showed a significant influence on the small concentrated area around station SX12. Moreover, it was the major contributor for the two concentrated regions in the surface layers in the same areas (Figure 3A). In the bottom layer, Paralia sulcata appeared a plaque distribution. It is clear that the concentrated area of phytoplankton in the estuary (Figure 3B) results from the dominant species Skeletonema costatum. Higher phytoplankton abundance was observed in the two layers during the flood period in 1999, compared with that during the dry period. The maximum abundance for the surface layer in the flood period was nearly 40 times greater than the minimum. In general, the surface layers possess higher abundance than the bottom layers, with the exceptions of stations SX11 and SX12. This may be due to the salinity stratification in the estuary in the flood period, with lower salinity in the surface. During this period in 1999, the concentration in the surface layer (Figure 3C) was mainly formed by Skeletonema costatum, which also determined the quantity distribution in the bottom layer (Figure 3D). For the dry period in 2000, the surface layers had higher abundance than the bottom layers. However, for the dry period in 1999, the abundance was similar in the two layers, but the quantity in the surface layer at all sampling station was lower, with SX11 as the only exception. Thus, phytoplankton abundance was usually higher in the flood period for the two layers, and the surface layer was higher than the bottom layer for all the periods.
As the primary producer, the distribution and change of phytoplankton affects higher forms of life through the food web. Phytoplankton distribution and change have a close correlation with environmental factors and indicate variations in the estuary water environments. Sunlight is the main photosynthesis driver of phytoplankton, and phytoplankton growth and distribution are affected by the sunlight period and intensity. Gameiro & Brotas (Reference Gameiro and Brotas2010) considered that light availability was one of the major factors shaping phytoplankton variability patterns in the Tagus estuary. Domingues et al. (2011) concluded that phytoplankton growth in the freshwater tidal reaches of the Guadiana estuary was light-limited throughout the year; although primary production was not photoinhibited at least up to 615 mmol photons m−2 s−1. Furthermore, diatoms showed the most prominent responses to light enrichment throughout the year, High saturating irradiances, high light-saturated rates of primary production and low photosynthetic efficiencies suggest that the photoplankton community was not acclimated to the low-light conditions. For Changjiang estuary, light limitation caused by suspended particles in the water reduces the photosynthesis activity, resulting in a change of the phytoplankton primary productivity and community structure. And besides light condition, temperature, nutrients and zooplankton prey also take effect as controlling factors (Quinlan et al., Reference Quinlan, Jett and Phlips2009; Choudhury & Pal, Reference Choudhury and Pal2011; Shen et al., Reference Shen, Li, Huang, Zhang and Tan2011; Altman et al., Reference Altman and Paerl2012). Linear regression analysis suggests a positive correlation between phytoplankton abundance and sediment concentration for the bottom layer in August 1999. The assumption was described by y = 9.649 + 235.046χ, (r = 0.8550, P < 0.05). The abundance for the bottom layer of the dry period in 2000 correlated negatively with the sediment concentration: y = 24.674 − 20.291χ, (r = −0.7155, P < 0.05). The salinity maintains the osmotic relation between the protoplast and water, and phytoplankton show various responses to different salinities. The linear regression analysis for the phytoplankton abundance and salinity data expressed a negative correlation. The regression equations for the surface and bottom layers during the dry period in 1999 were y = 75.614 − 0.651χ, (r = −0.7387, P < 0.05) and y = 24.08 − 0.489χ, (r = -0.6292, P < 0.05). These estimates were significantly affected by the freshwater run-off, and the decrease in the abundance from the low-salinity estuary to the high-salinity inshore and offshore was also observed. The study of the Jucar River estuary by González del Río et al. (Reference González del Río, Romero, Falco, Rodilla, Saez, Sierra, Sánchez-Arcilla and Mösso2007) reported that along the salinity gradient, as the influence of fresh water and nutrient loads decreases, a decrease in the population density of eukaryotic phytoplankton is observed. Typical freshwater phytoplankton groups clearly decrease in density and percentage as salinity increases. The density of diatoms is highest in the salt-wedge area due to nutrient accumulation. Considerable attention has been paid to nutrients in recent years. A positive correlation of phytoplankton with NO2−N and NH4−N was recorded for the Mahanadi estuary (Naik et al., Reference Naik, Acharya and Mohapatra2009), indicating that the phytoplankton population was controlled by these nutrients. Diatoms were dependent on NO2−N and NH4−N, and dinoflagellates were dependent on NO2−N and SiO4. Buric et al. (Reference Buric, Cetinić, Viličić, Mihalić, Carić and Olujić2007) pointed out that nutrients strongly limited phytoplankton growth in summer when the Karstic Zrmanja river discharge was at a minimum. Choudhury et al. (Reference Choudhury and Pal2011) stated that nutrients like DIN-DIP and DIN-DSi influenced periodical phytoplankton assemblages within the Bhagirathi–Hooghly estuary. In this study, linear regression analysis for phytoplankton abundance, total inorganic nitrogen and phosphate content showed a positive correlation between abundance and the total inorganic nitrogen in the surface and bottom layers during the dry period in 1999, which can be expressed as y = 3.932 + 8.652χ (r = 0.6049, P < 0.05); y = 3.786 + 8.783χ (r = 0.6565, P < 0.05). The same correlation was established for abundance and phosphate content in the surface layer: y = 1.034 + 574.434χ (r = 0.5403, P < 0.05). No significant negative correlations were observed during the other periods in the two layers. Thus, the correlations of phytoplankton abundance and nutrients are probably influenced by some additional factors. This conclusion was also supported by Costa et al. (Reference Costa, Huszar and Ovalle2009); in Paraíba do Sul River estuary, remarkable shifts in composition and biomass occurred from the low to high flushing reasons, due much more to the river discharge than to nutrient availability. The overall results showed no nitrogen, phosphorus, or silica limitations to phytoplankton growth.
ACKNOWLEDGEMENTS
We would like to thank Professor Acheng Liu for data collection assistance.
FINANCIAL SUPPORT
This research was supported by the National Natural Science Foundation of China (No.20777021, No.40231017), Ministry of Education, Key Research Project of Science and Technology (No. 210253), and the Natural Science Foundation of Fujian Province of China (No.2010J01043, D0610012).


