


The management of patients with eisenmenger syndrome depends on thorough understanding of the complex patterns of flow in the aorta and the pulmonary artery, as well as defining the relationship between capacitance of the pulmonary and systemic circulations. This is compounded in patients with pulmonary atresia.Reference D’Alto, Merola and Dimopoulos 1 CMR 4D Flow has been newly introduced as a powerful tool to characterise the pattern of flow and haemodynamics,Reference Reiter-Urgkbkksrm, Olschewski and Rienmueller 2 which can be useful for both decision making preoperatively and during the follow-up. In this study, we describe the use and limitation of CMR 4D Flow mapping in a patient with pulmonary atresia, duct-dependent pulmonary circulation, and severe pulmonary hypertension to illustrate the potential of this powerful technique in complex CHD.
Patient and methods
A 5-year-old girl with a body weight of 13 kg and oxygen saturation of 75% on room air was severely symptomatic (NYHA Class III). The patient was on conventional heart failure medication and sildenafil for pulmonary hypertension. She underwent an exploratory sternotomy in another centre 2 years ago.
Echocardiography and angiography showed pulmonary atresia, ventricular septal defect, and duct-dependent pulmonary circulation with pulmonary hypertension (Fig 1).
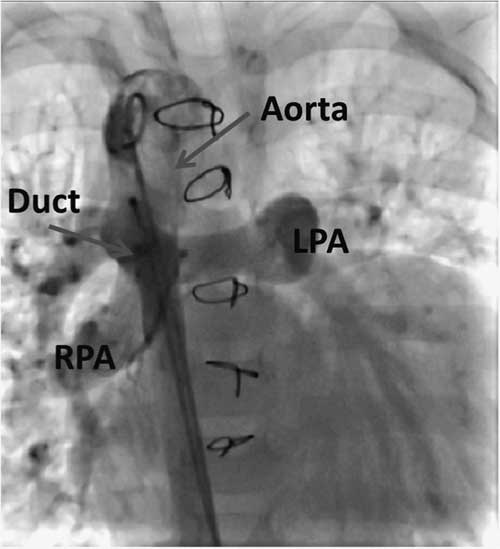
Figure 1 Aortic angiography showing a large duct supplying both pulmonary arteries in the anterior–posterior view. LPA=left pulmonary artery; RPA=right pulmonary artery.
Cardiac catheterisation showed aortic pressure of 80/50 mmHg, mean 64 mmHg, and 70/27 mmHg, mean 59 mmHg, in the main pulmonary artery – measured through the duct. Oxygen saturation in both the aorta and the pulmonary arteries was 90%, and this increased to 98% with 100% O2 inhalation, suggesting a degree of reversibility of pulmonary hypertension.
CMR 4D Flow was performed to assess the pattern of aortic and pulmonary flow using a 1.5-T MRI scanner (Siemens Magnetom Aera; Siemens Medical Systems, Erlangen, Germany) and a Siemens Special Sequence Package for 4D Flow acquisition and post-processing;Reference Dyverfeldt, Bissell and Barker 3 the detailed protocol is described in Appendix 1.
Surgical management included the division of the very large duct followed by insertion of a 2.3-cm, cryopreserved homograft conduit from the right ventricle to the transected pulmonary artery. The ventricular septal defect was closed by a Dacron patch followed by making a cruciate fenestration in the patch with each limb measuring 4 mm.
The patient had a smooth postoperative course, and she was extubated on day 5 postoperatively. Her oxygen saturation was 90%. Echocardiography showed good left and right systolic function; flow across the fenestrated patch was bidirectional, and there was laminar flow across the homograft. CMR 4D Flow was again performed 1 month after surgery. After 2 months, she had severe chest infection, and her oxygen saturation dropped to 70%. Therefore, she was re-admitted to the hospital for medical management. Unfortunately, after 3 weeks, she passed away.
CMR 4D Flow analysis
Quantitative analysis
Forward, backward, and net flow as well as flow rate and velocity over the cardiac cycle were measured at seven anatomical levels (Fig 2). This was conducted at four phases: peak systole, representing the maximal flow velocity of the aortic valve, late systole at aortic valve closure, early diastole at the first half of the diastolic time, and late diastole at the second half of the diastolic time.
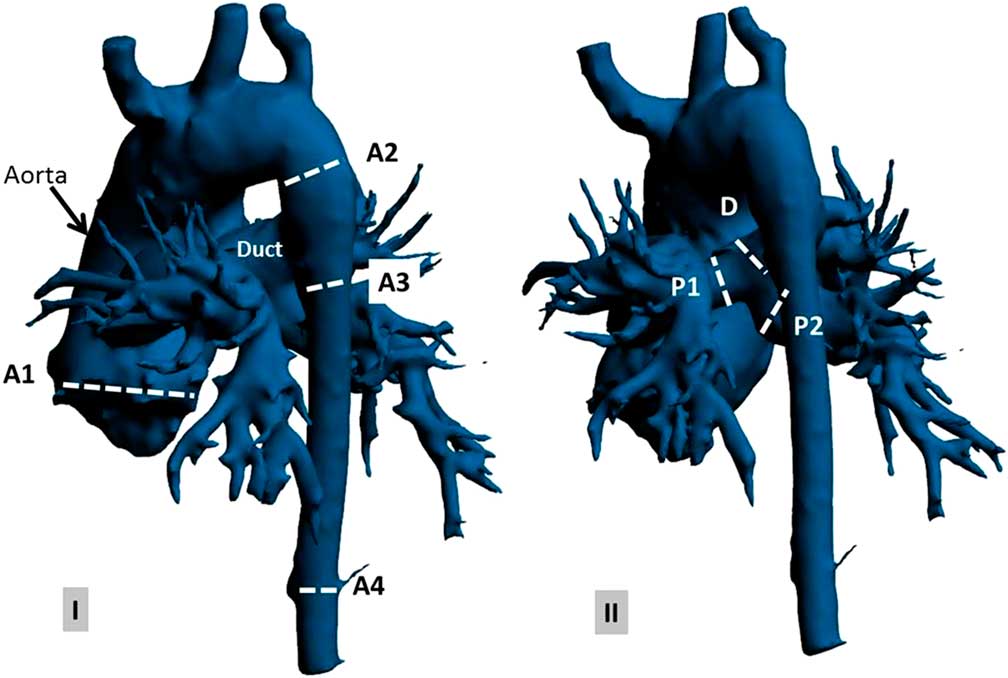
Figure 2 Preoperative anatomy of the aorta, duct, and pulmonary artery (using Materialise Mimics, Leuven, Belgium) on ( a ) anterior–posterior view and ( b ) posterior–anterior view at selected anatomical planes: (A1) aortic valve, (A2) descending aorta proximal to the duct, (A3) descending aorta distal to the duct, (A4) descending aorta at the diaphragm level, (P1) left pulmonary artery, (P2) right pulmonary artery, and (D) duct.
Qualitative analysis
Colour-coded streamlines and vector velocity were used to visualise flow pattern and vortex development through the aorta, duct, and pulmonary arteries. A vortex was defined as a regional circular flow pattern deviating by >90° from the physiological flow direction along the vessel lumen.Reference Kheradvar and Pedrizzetti 4 The relative period of the vortex existence – the vortex duration expressed as percentage of the cardiac cycle – was measured.
Results
Data on preoperative and postoperative flow analysis are summarised in Table 1.
-
A. Preoperative flow analysis
-
1. The ascending aorta was dilated (30 mm, Z score=3) with a right-handed helix. A clear vortex formation started during late systole and persisted throughout diastole (Figs 3 and 4, Supplementary video 1); the vortex existence was observed during 60% of the cardiac cycle. The resulting maximum forward-flow rate during systole was 297 ml/second with a peak velocity of 1.0 m/second (Fig 5). Interestingly, there was backward flow of 1.5 ml during diastole compared with a forward flow of 44 ml during systole (Fig 6).
-
2. Descending aorta proximal to the duct: laminar flow with no vortex development through the whole cardiac cycle was observed. The highest flow velocity was observed on the inner curvature of the descending aorta just proximal to the duct with a peak velocity of 1.8 m/second; the maximum forward-flow rate during systole was 89 ml/second, and the forward flow was 34 ml (Figs 3 and 4, Supplementary video 1).
-
3. Duct and pulmonary arteries: the maximum forward-flow rate in the duct during systole was 130 ml/second, and the forward flow was 26 ml. The flow pattern through the right and left arteries showed systolic notches characteristic of severe pulmonary hypertensionReference Kitabatake, Inoue and Asao 5 (Fig 5).
-
4. Descending aorta distal to the duct: the maximum forward-flow rate during systole (42 ml/second) and the forward flow (6 ml) were markedly decreased compared with that in the ascending aorta, arch, and duct (Fig 5). During diastole, reversal flow, which is continued to the duct, was observed (Figs 3 and 6, Supplementary video 1). The backward flow was 2 ml; the regurgitation fraction was 16%.
-
B. Postoperative flow analysis
-
1. Ascending aorta: the right-handed helical flow and vortex that were noted preoperatively started earlier, during peak systole, and stayed throughout diastole (Figs 7 and 8, Supplementary video 2). Vortex existence was observed in over 78% of the cardiac cycle. The maximum forward-flow rate during systole (70 ml/second) and the forward flow (8 ml) were significantly lower compared with values preoperatively. Backward flow during diastole (0.5 ml) remained postoperatively because of the dilatation of the descending aorta still causing abnormal vortex (Fig 8).
-
2. Descending aorta: the maximum forward-flow rate during systole was 25 ml/second, and the forward flow was 4 ml. During diastole, no reversal flow was observed (Figs 7 and 8, Supplementary video 2).
-
3. Pulmonary arteries: the maximum forward-flow rate in the main pulmonary arteries during systole was 66 ml/second, and the forward flow was 6 ml. The flow pattern through the right and left arteries showed a normal flow pattern. The flow velocity through the right pulmonary artery (1.2 m/second) was slightly higher compared with the flow velocity through the left pulmonary artery (0.8 m/second) (Fig 9).
-

Figure 3 Colour-coded streamlines showing preoperative flow pattern in the ascending aorta, duct, pulmonary arteries, and descending aorta during ( a ) peak systole, ( b ) late systole, ( c ) early diastole, and ( d ) late diastole phases.

Figure 4 Colour-coded vector velocity showing preoperative flow mapping in the ascending aorta during ( a ) peak systole, ( b ) late systole, ( c ) early diastole, and ( d ) late diastole phases. A right-handed helical flow with a clockwise rotation of the vortex formed in the dilated ascending aorta starts in the late systole phase and persists throughout diastole.
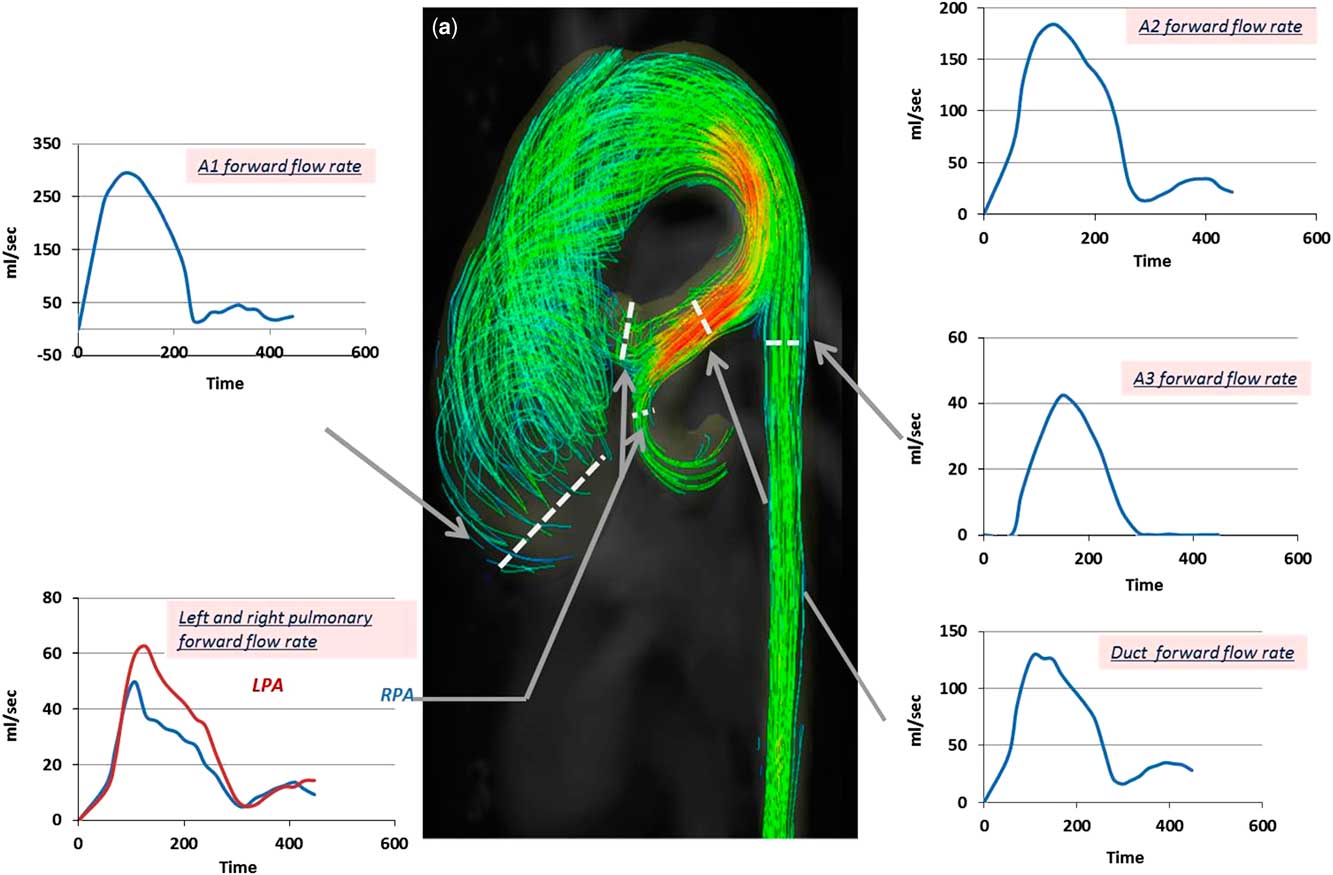
Figure 5 Colour-coded streamlines showing preoperative flow pattern during the peak systole phase. Time flow curves (over a cardiac cycle of 470 ms) showing forward-flow rate in the ascending aorta (A1), descending aorta proximal to the duct (A2), descending aorta distal to the duct (A3), duct, and both pulmonary arteries. LPA=left pulmonary artery; RPA=right pulmonary artery.

Figure 6 Colour-coded streamlines showing preoperative flow pattern during late diastole. Time flow curves (over a cardiac cycle of 470 ms) showing backward-flow rate at the aortic valve (A1), descending aorta distal to duct (A3), and descending aorta at the diaphragm level (A4).
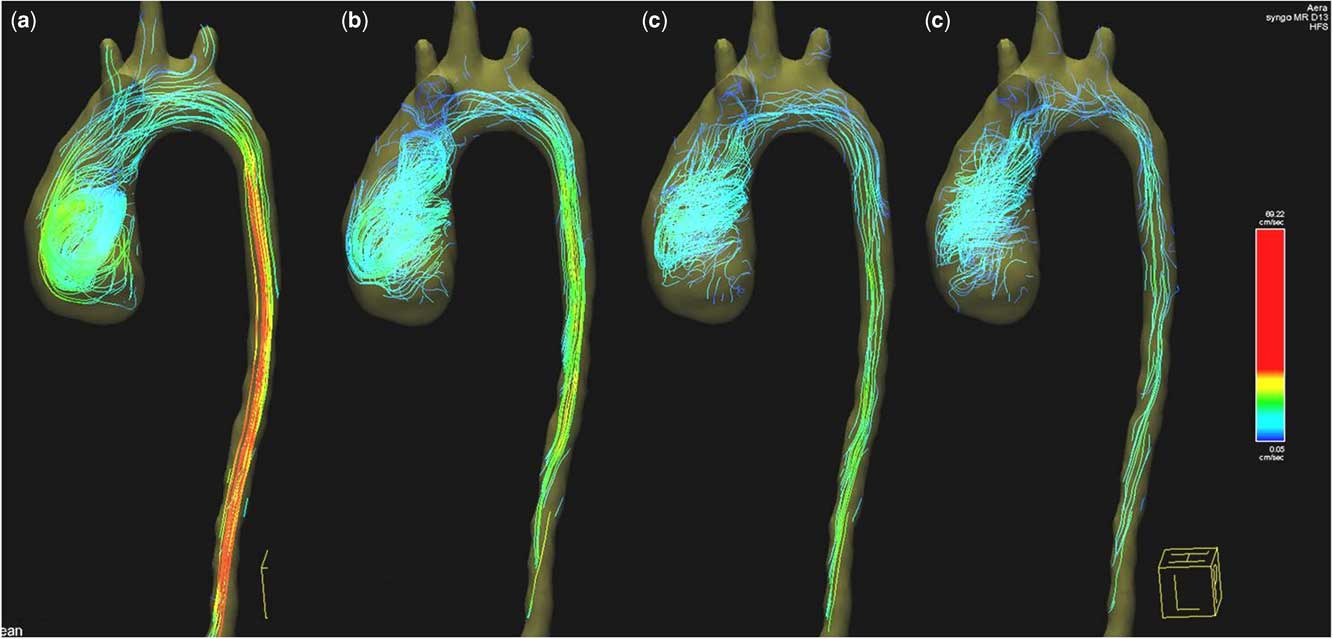
Figure 7 Colour-coded streamlines showing postoperative flow pattern in the ascending and descending aorta during ( a ) peak systole, ( b ) late systole, ( c ) early diastole, and ( d ) late diastole phases.
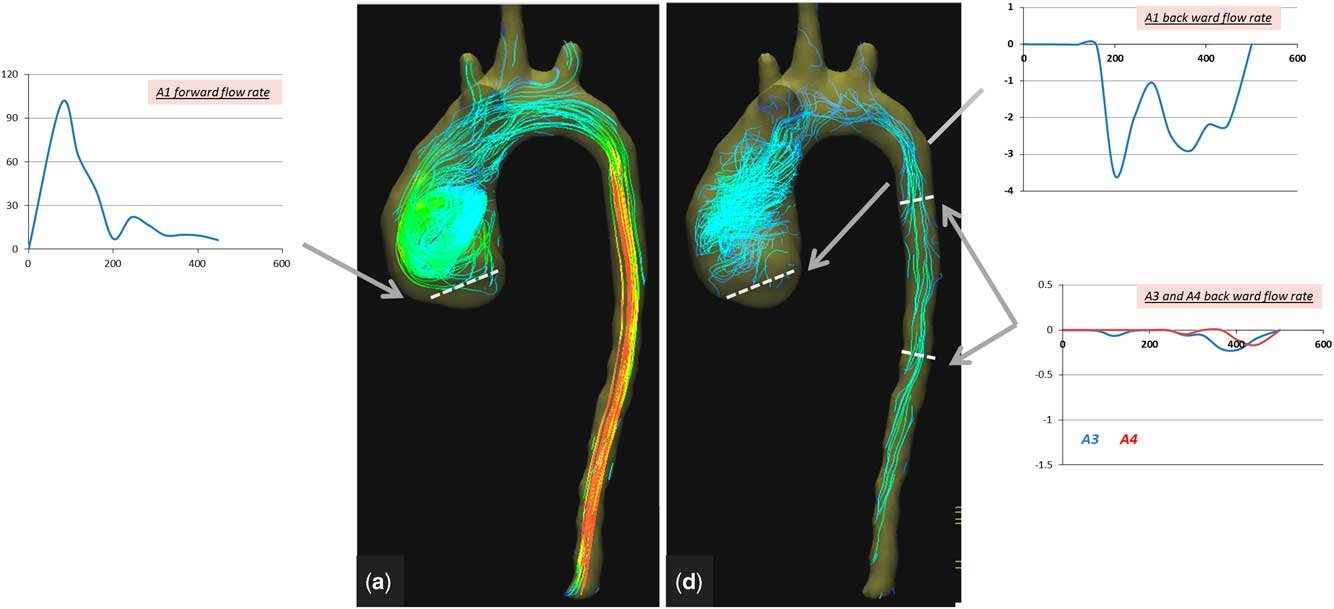
Figure 8 Colour-coded streamlines showing postoperative flow pattern during ( a ) peak systole and ( d ) late diastole phases. Time flow curves (over a cardiac cycle of 470 ms) showing forward- and backward-flow rate at the aortic valve (A1) and backward-flow rate of the descending aorta (A3 and A4).
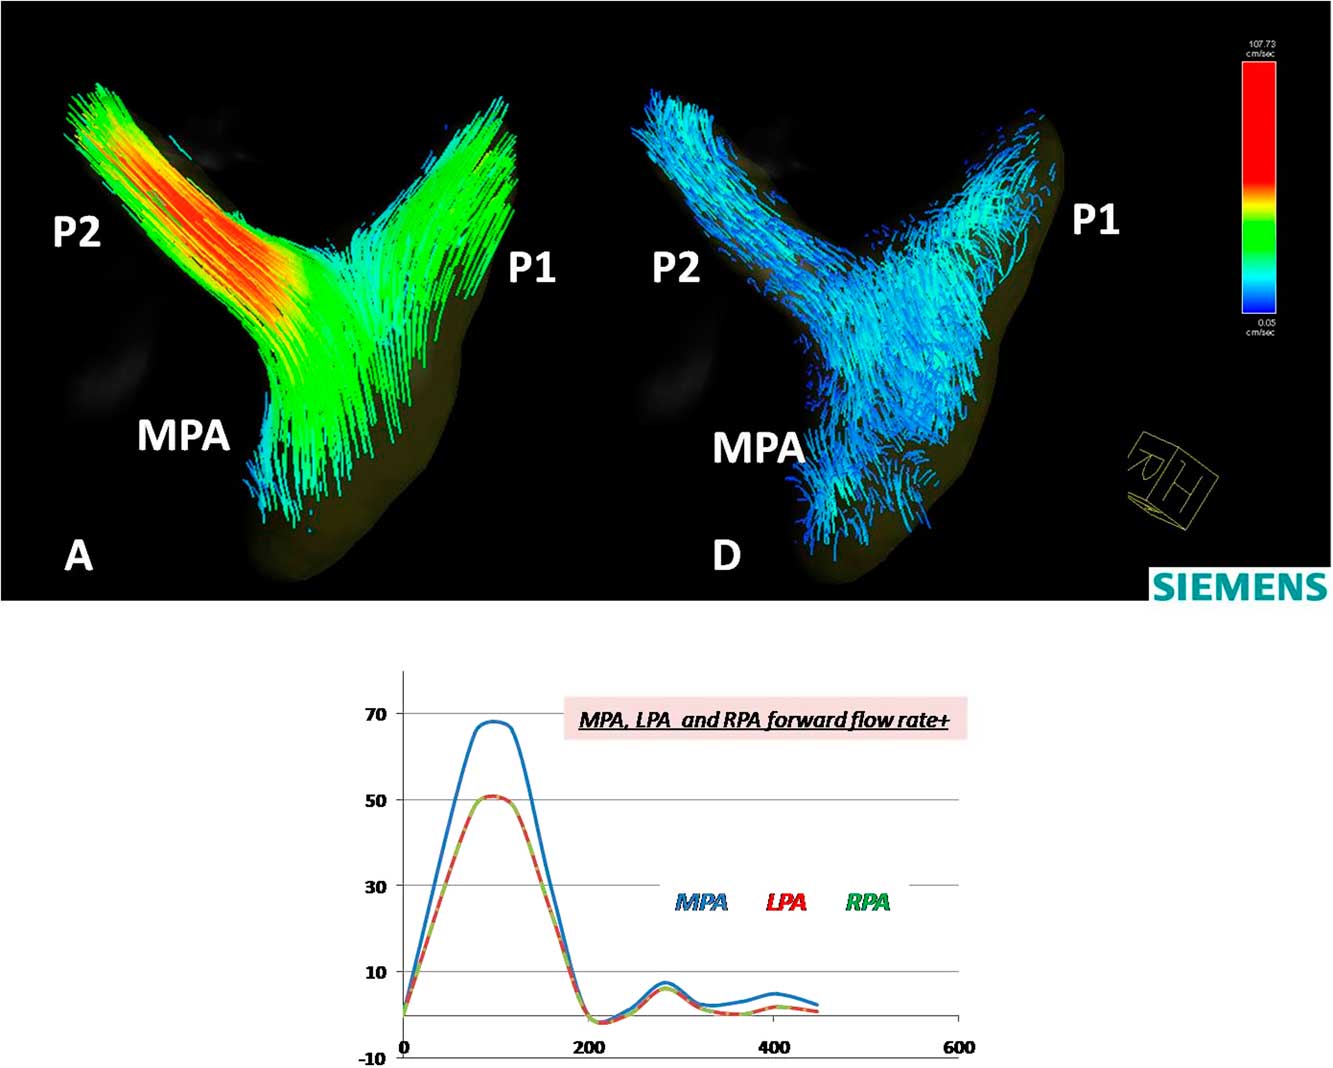
Figure 9 Colour-coded streamlines showing postoperative flow pattern in the left and right pulmonary arteries during ( a ) peak systole and ( d ) late diastole phases. Time flow curves (over a cardiac cycle of 470 ms) showing forward-flow rate in the main pulmonary artery (MPA), the left pulmonary artery (P1), and the right pulmonary artery (P2).
Table 1 Quantitative analysis of preoperative and postoperative flow at anatomical planes.

A1=aorta valve; A2=descending aorta proximal to duct; A3=descending aorta distal to duct; A4=descending aorta at diaphragm level; D=duct; MPA=main pulmonary artery
Discussion
This study illustrates the capacity of CMR 4D Flow mapping to yield unique additional information in patients with complex CHD. This information can include the pattern, direction, and speed of flow in different segments of the aorta and pulmonary artery as well as the interaction between flow and structure of these segments.
In the patient described in this study, dilation of the ascending aorta resulted in changes in the pattern of flow, intensity, and timing of the vortex. Following the repair and because of separation of both circulations, the forward-flow rate and maximum velocity in the ascending aorta were reduced significantly. In addition, a prolonged vortex existence was observed, which is probably related to the existing dilation of the ascending aorta and the loss of momentum. This vortex could lead to energy loss due to the transformation of energy into vortex inertia.Reference Kheradvar and Pedrizzetti 4 These changes can have important implications to the reservoir function of the aortaReference Davies, Parker and Francis 6 and possibly to coronary flow.Reference Broyd, Davies and Escaned 7 , Reference Schultz, Hughes and Davies 8 Interestingly, the backward flow, which was measured as 3% of the total cardiac output preoperatively, changed to 6% of total cardiac output postoperatively, indicating that this was mainly due to changes in direction and timing of the vortex, as well as the quantity of blood going through the aortic valve (43 ml). The considerable drop in peak flow rate observed postoperatively (Fig 8, Table 1) reflects the separation of the two circulations, which results in marked relief of systolic ventricular overload.
The marked difference of the flow profile in different segments of the aorta preoperatively indicates the fact that the blood passing through the ascending aorta and arch is divided between the duct and the descending aorta in a specific manner. This could give a rough indication of the true pulmonary flow and indirectly the pulmonary vascular resistance. In addition, the backward flow in the descending aorta during diastole is a possible measure of the capacitance of the pulmonary and systemic circulation.
The abnormal flow pattern in the right and left pulmonary arteries (systolic notches) that partially normalised postoperatively indicates a degree of reversibility of the pulmonary vascular resistance.
The additional information could be of great value for management of the patient both preoperatively and postoperatively. The patient described here had an excellent early postoperative course; however, the later outcome illustrates the complexity of the disease, which in this case showed progressive raise in pulmonary vascular resistance, was unresponsive to modern treatment of pulmonary hypertension, including endothelin, antagonis, prostanoids (remodulin), and phosphodiesterase type 5 inhibitor (Sildenafil), and the fact that this child was corrected very late at the age of 5 years.
The limitations of this study include its complexity and time-consuming nature; however, the ongoing development of the software should – at least in part – solve this problem to make this an extremely powerful technique that can be used more commonly; however, the accuracy and relationship to computational fluid dynamics have to be studied further.Reference Torii, Parker and Yacoub 9
Conclusion
CMR 4D Flow is a very helpful tool to investigate patterns of flow in complex CHD. Observing flow propagation and quantifying its distribution can be utilised to identify severity of disease and the multiple impact of obstruction on different areas of the cardiac system. Including CMR 4D Flow in clinical practice will leverage advanced image-based tools towards anatomy and patient-specific comprehensive clinical assessment.
Acknowledgements
The authors acknowledge their collaborators at Siemens Healthcare GmbH, Erlangen, Germany, Siemens Healthineers, Northwestern University, Chicago, Illinois, United States of America, and Siemens Healthcare S.A.E., Cairo, Egypt, for providing the CMR 4D Flow sequence and software, as well as their technical support and positive interaction. The authors also acknowledge Amr El-Sawy from the Aswan Heart Centre team for the technical help.
Financial Support
This research received no specific grant from any funding agency or from commercial or not-for-profit sectors.
Conflicts of Interest
None.
Ethical Standards
This study was approved by the local Ethics Committee, and the child was enrolled to the study after obtaining parental consent.
Supplementary materials
For supplementary material referred to in this article, please visit http://dx.doi.org/10.1017/S1047951116001682
Appendix 1
The images of CMR 4D Flow were acquired on a 1.5-T MRI scanner using Siemens AddIn/special sequence package. A 60-mm slab was placed in the aorta, from the aorta valve to the abdominal aorta at the diaphragm level, including the duct and both pulmonary arteries. Velocity was encoded in three orthogonal directions, and the images were acquired during free breathing by an imaging sequence with retrospective electrocardiogram gating (10% acceptance window, 18 reconstructed cardiac phases).
Imaging parameters were as follows: repetition time/echo time 23/2.6 ms, field of view 370–400 mm, flip angel 10°, voxel size 1.9×1.9×2 mm, two signal averages, and a 237-Hz sampling bandwidth.


