INTRODUCTION
A growing body of empirical research has examined the prevalence of low scores among normative samples of healthy examinees (Binder, Iverson, & Brooks, Reference Binder, Iverson and Brooks2009; Brooks, Holdnack, & Iverson, Reference Brooks, Holdnack and Iverson2011; Brooks, Iverson, & Holdnack, Reference Brooks, Iverson, Holdnack, Holdnack, Drozdick, Weiss and Iverson2013; Brooks, Iverson, Lanting, Horton, & Reynolds, Reference Brooks, Iverson, Lanting, Horton and Reynolds2012; Brooks, Iverson, & White, Reference Brooks, Iverson and White2009; Brooks, Sherman, & Iverson, Reference Brooks, Sherman and Iverson2010; Holdnack et al., Reference Holdnack, Tulsky, Brooks, Slotkin, Gershon, Heinemann and Iverson2017; Ivins et al., Reference Ivins, Lange, Cole, Kane, Schwab and Iverson2015; Karr, Garcia-Barrera, Holdnack, & Iverson, Reference Karr, Garcia-Barrera, Holdnack and Iverson2017, Reference Karr, Garcia-Barrera, Holdnack and Iverson2018; Mistridis et al., Reference Mistridis, Egli, Iverson, Berres, Willmes, Welsh-Bohmer and Monsch2015). The normal frequency of low scores has been quantified as an advanced psychometric resource referred to as multivariate base rates. Research on multivariate base rates has consistently demonstrated five principles: (a) low scores occur commonly among healthy individuals, (b) the number of low scores observed increases with the number of tests administered and scores interpreted, (c) the number of low scores observed is contingent on the cutoff used to define a low score (i.e., ≤16th percentile vs. ≤2nd percentile), and, lastly, individuals with (d) lower intellectual functioning and (e) fewer years of education tend to present with a greater number of low scores (Brooks et al., Reference Brooks, Iverson, Holdnack, Holdnack, Drozdick, Weiss and Iverson2013). Although many studies have focused on the frequency of low scores, no published study, to our knowledge, has examined the other side of the bell curve, exploring the normal multivariate frequency of high scores on a neuropsychological test battery. An understanding of how often participants within a normative sample obtain one of more high scores would inform two aspects of clinical practice: the assessment of cognitive strengths and the assessment of deficits in patients with high premorbid functioning.
Few psychometric resources exist to properly quantify a cognitive strength. Some methods for calculating relative cognitive strengths have been widely used in the assessment of intellectual functions (Davis, Reference Davis1959), but this method is not automated for all neuropsychological test batteries. Previous researchers have also discussed the detection of cognitive strengths through a close evaluation of test scatter, but there is no universal method for defining strengths in clinical assessment practice (Oakes, Lovejoy, Tartar, & Holdnack, Reference Oakes, Lovejoy, Tartar, Holdnack, Holdnack, Drozdick, Weiss and Iverson2013). Many clinicians simply interpret single high test scores as indicative of an underlying cognitive strength.
In addition to the assessment of cognitive strengths, researchers have also examined cognitive decline in participants with high premorbid functioning (Chodosh, Reuben, Albert, & Seeman, Reference Chodosh, Reuben, Albert and Seeman2002; Deary, Starr, & MacLennan, Reference Deary, Starr and MacLennan1998). There has been substantial emphasis on cognitive reserve in neuropsychological research, detailing the protective effects of intelligence, education, and occupational attainment against dementia risk (Scarmeas & Stern, Reference Scarmeas and Stern2004). Despite the possible protective effects of cognitive reserve, high baseline ability may obscure reductions in cognitive functioning because reduced performances may be average scores as opposed to frankly low scores in an assessment context. Clinicians often emphasize low scores in assessment practice, but high-functioning patients may present with average or even above average scores that indicate a decline from their previous level of cognitive functioning. Data on how many scores are expected to be high average or superior among healthy individuals with high intelligence or educational attainment can help clinicians understand when a high-functioning patient has more average scores than expected.
The current study used the normative data from the Delis-Kaplan Executive Function System (D-KEFS) (Delis, Kaplan, & Kramer, Reference Delis, Kaplan and Kramer2001), which is the most commonly administered test battery of executive function in clinical practice (Rabin, Paolillo, & Barr, Reference Rabin, Paolillo and Barr2016). Previous research has provided multivariate base rates of low scores for the D-KEFS (Cook et al., Reference Cook, Karr, Brooks, Garcia-Barrera, Holdnack and Iverson2018; Crawford, Garthwaite, Sutherland, & Borland, Reference Crawford, Garthwaite, Sutherland and Borland2011; Karr et al., Reference Karr, Garcia-Barrera, Holdnack and Iverson2017, Reference Karr, Garcia-Barrera, Holdnack and Iverson2018). This study aimed to determine if the principles of low score multivariate base rates applied to high scores as well, hypothesizing that (a) high scores will occur commonly among the D-KEFS normative sample, (b) the frequency of high scores will increase with the numbers of tests administered and scores interpreted, (c) the frequency of high scores will be related to the cutoff used to define a high score (i.e., ≥75th, ≥84th, ≥91st, ≥95th, and ≥98th percentiles), and, lastly, the frequency of high scores will be greater among individuals with (d) higher intellectual functioning and (e) more years of education.
METHOD
Participants
A total of 1050 participants (47.8% men) aged 16–89 years completed the D-KEFS as part of the standardization procedure, which recruited participants across the United States in close alignment with 2000 United States census data in terms of age, race/ethnicity, education, and geographic representation (Delis et al., Reference Delis, Kaplan and Kramer2001). The following age groups were represented with their corresponding sample sizes: 16–19 (n = 175), 20–29 (n = 175), 30–39 (n = 150), 40–49 (n = 100), 50–59 (n = 100), 60–69 (n = 125), 70–79 (n = 125), and 80–89 (n = 100). The sample was predominantly White (79.2%), but included representation from a range of racial/ethnic groups (i.e., 10.6% African American, 9.1% Hispanic, and 2.1% representative of other racial and ethnic backgrounds). Education was coded as the highest level of parental education for participants 16–19 years old and highest level of personal education for participants 20–89 years old. Education ranged from fewer than 8 years to college educated: ≤8 years (5.7%), 9–11 years (12.2%), 12 years (34.3%), 13–15 years (26.7%), and 16 or more years (21.1%). Participants were screened for self-reported medical and psychiatric conditions and removed if the condition could negatively impact cognitive performance. The data were received as age-referenced scaled scores (M = 10, SD = 3). A subsample of participants (n = 823) completed the Wechsler Abbreviated Scale of Intelligence (WASI) (The Psychological Corporation, 1999), with WASI scores received as age-referenced standard scores (M = 100, SD = 15). The data were received anonymized from Pearson, and an institutional Human Research Ethics Board approved the secondary analyses conducted herein.
Measures
The D-KEFS includes the nine following tests with their Total Achievement scores (i.e., scores most indicative of executive function) listed in parentheses: Trail Making Test (Number-Letter Switching: Time-to-Completion), Verbal Fluency Test (Letter Fluency: Total Correct; Category Fluency: Total Correct; Category Switching: Total Correct Responses; Category Switching: Total Switching Accuracy), Design Fluency Test (Total Correct Composite Scaled Score), Color-Word Interference Test (Inhibition: Time-to-Completion; Inhibition/Switching: Time-to-Completion), Sorting Test (Free Sorting: Confirmed Correct Sorts; Free Sorting: Description Score; Sort Recognition: Description Score), Twenty Questions Test (Total Weighted Achievement Score), Word Context Test (Total Consecutively Correct), Tower Test (Total Achievement Score; Move Accuracy Ratio), and Proverb Test (Total Achievement Score: Free Inquiry). A more detailed explanation of the D-KEFS tests is available in the Technical Manual (Delis et al., Reference Delis, Kaplan and Kramer2001) and in previously published test reviews (Baron, Reference Baron2004; Homack, Lee, & Riccio, Reference Homack, Lee and Riccio2005; Shunk, Davis, & Dean, Reference Shunk, Davis and Dean2006; Swanson, Reference Swanson2005).
Statistical Analyses
Because previous D-KEFS multivariate base rate calculations did not identify age-related differences in the prevalence of low scores when comparing younger and older age spans (Crawford et al., Reference Crawford, Garthwaite, Sutherland and Borland2011; Karr et al., Reference Karr, Garcia-Barrera, Holdnack and Iverson2017, Reference Karr, Garcia-Barrera, Holdnack and Iverson2018), the high score base rates were calculated for the full sample (i.e., ages 16–89 years) without stratification by age. The lack of differences in high score base rates between age groups was verified empirically through a series of non-parametric comparisons, identifying no significant differences in high score base rates based on age after controlling for multiple comparisons. As noted earlier, all scores were received as age-referenced scaled scores, which likely explains the lack of difference in base rates based on age. The multivariate base rates were calculated based on the frequency of high Total Achievement scores for the full battery and two brief batteries. The two brief batteries consisted of three tests (i.e., Trail Making Test, Verbal Fluency Test, and Color-Word Interference Test) and four tests (i.e., Trail Making Test, Verbal Fluency Test, Color-Word Interference Test, and Tower Test), selected based on the frequency of their administration in clinical practice (Rabin et al., Reference Rabin, Paolillo and Barr2016). The full test battery included 16 Total Achievement scores, the four-test battery included 9 Total Achievement scores, and the three-test battery included 7 Total Achievement scores. All participants completed D-KEFS tests in the context of the standardization of the full D-KEFS battery, and the same participants are represented in the base rate calculations for the full and brief batteries. Variability in sample sizes for the base rates across batteries is attributable to missing data because only cases with complete data were included in base rate calculations. The participants represented in the brief battery base rates were not administered fewer tests, rather fewer scores are being interpreted in the base rate calculation. Estimated based on the two-subtest WASI (i.e., Vocabulary, Matrix Reasoning), intelligence level was used to stratify the multivariate base rates based on the following categories: ≤89, 90–99, 100–109, and ≥110. The cutoffs used to define high scores were equivalent to the cutoffs used to define low scores in previous studies (Karr et al., Reference Karr, Garcia-Barrera, Holdnack and Iverson2017, Reference Karr, Garcia-Barrera, Holdnack and Iverson2018), albeit on the opposite side of the bell curve: ≥75th, ≥84th, ≥91st, ≥95th, and ≥98th percentiles.
RESULTS
The frequencies of high D-KEFS Total Achievement scores, based on ≥75th, ≥84th, ≥91st, ≥95th, and ≥98th percentile cutoffs, for the three-test, four-test, and full batteries are provided in Tables 1–3, respectively, with stratifications by estimated level of intelligence and years of education. High scores occurred quite commonly among the D-KEFS normative sample. When interpreting scores from the full test battery, 87.8% obtained one or more high scores at or above the 84th percentile (see Table 3). As expected, the prevalence of high scores decreased with the use of higher cutoffs for defining a high score. When interpreting scores from the four-test D-KEFS battery, 72.9% obtained one or more scores at or above the 84th percentile, 53.7% obtained one or more scores at or above the 91st percentile, 34.3% obtained one or more scores at or above the 95th percentile, and 18.1% obtained one or more scores at or above the 98th percentile (see Table 2).
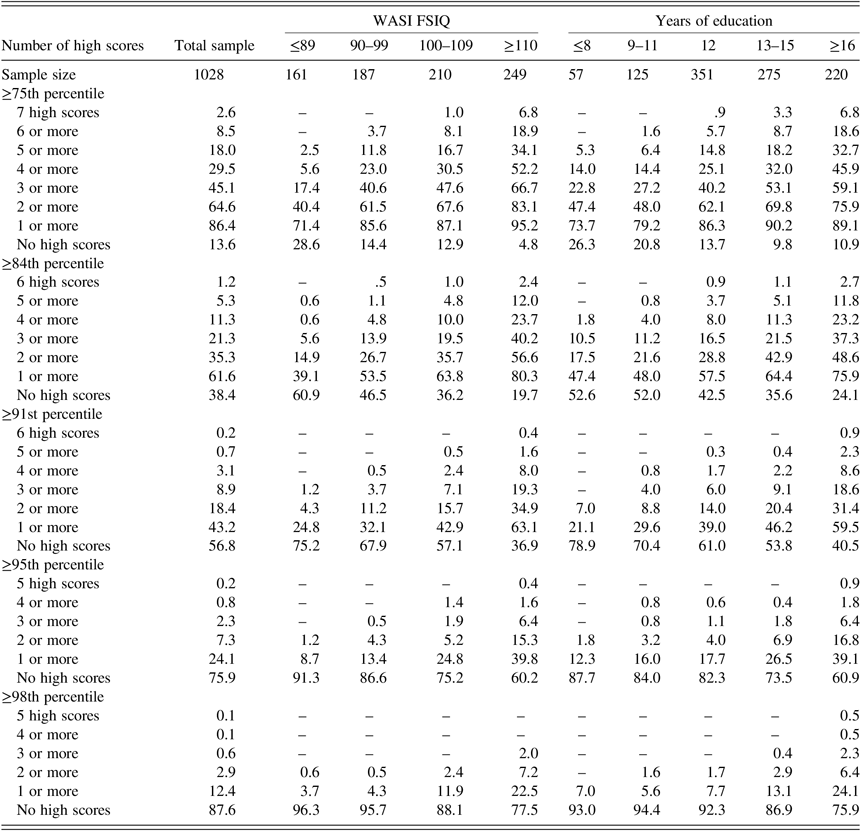
Table 1. Base rates of high age-referenced D-KEFS Total Achievement scores in 16–89 year-olds for the three-test battery – 7 scores: Trail Making Test (1 score), Verbal Fluency Test (4 scores), and Color-Word Interference Test (2 scores)

WASI FSIQ = Wechsler Abbreviated Scale of Intelligence Full Scale Intelligence Quotient.
Note. All values represent cumulative percentages except for the rows labeled “No high scores,” which provide the percentage of the normative sample with no scores falling above the high score cutoffs. Standardization data from the Delis-Kaplan Executive Function System (D-KEFS). Source: © 2001 NCS Pearson, Inc. used with permission. All rights reserved.
Table 2. Base rates of high age-referenced D-KEFS Total Achievement scores in 16–89 year-olds for the four-test battery – 9 scores: TMT (1 score), VF (4 scores), CWIT (2 scores), and TWT (2 scores)

TMT = Trail Making Test; VF = Verbal Fluency Test; CWIT = Color-Word Interference Test; TWT = Tower Test.
Note. All values represent cumulative percentages except for the rows labeled “No high scores,” which provide the percentage of the normative sample with no scores falling above the high score cutoffs. Only participants without missing data were included in the base rates calculation. Source: Standardization data from the Delis-Kaplan Executive Function System (D-KEFS), © 2001 NCS Pearson, Inc. used with permission. All rights reserved.
Table 3. Base rates of high age-referenced D-KEFS Total Achievement scores for full nine-test battery in 16–89 year-olds – 16 scores: TMT (1 score), VF (4 scores), DF (1 score), CWIT (2 scores), ST (3 scores), 20Q (1 score), WC (1 score), TWT (2 scores), and PT (1 score)
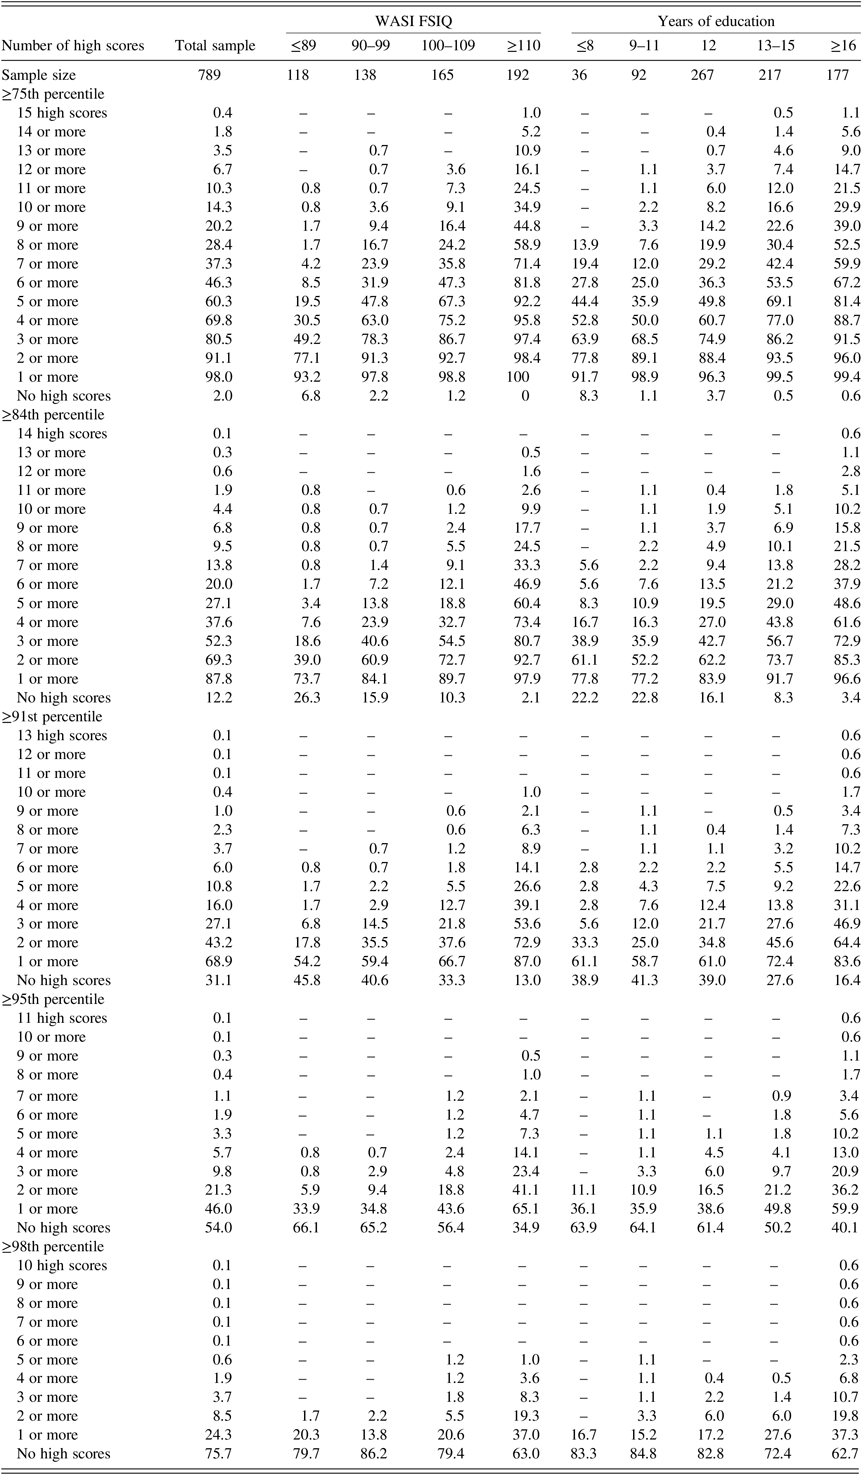
TMT = Trail Making Test; VF = Verbal Fluency Test; DF = Design Fluency Test; CWIT = Color-Word Interference Test; ST = Sorting Test; 20Q = Twenty Questions Test; WC = Word Context Test; TWT = Tower Test; PT = Proverb Test.
Note. All values represent cumulative percentages except for the rows labeled “No high scores,” which provide the percentage of the normative sample with no scores falling above the high score cutoffs. Only participants without missing data were included in the base rates calculation. Source: Standardization data from the Delis-Kaplan Executive Function System (D-KEFS), © 2001 NCS Pearson, Inc. used with permission. All rights reserved.
As anticipated, the base rates of high scores were lower for the brief batteries than for the total battery. For the three-test, four-test, and full batteries, 24.1%, 34.3%, and 46.0% of the sample obtained at least one score at or above the 95th percentile, respectively (see Tables 1–3). Even when using the highest cutoff to define a high score (i.e., ≥98th percentile), 12.4% of the sample obtained at least one or more high scores on the three-test battery, 18.1% obtained at least one or more high scores on the four-test battery, and 24.3% obtained at least one or more high scores on the full battery (see Tables 1–3). As made clear by this example, scores that are often considered very superior based on a univariate “bell curve” interpretation occur quite commonly among healthy adults completing the D-KEFS, even when interpreting scores from just four tests (i.e., nearly 1 in 5 people; 18.1%).
Stratifications by intelligence and education had their expected relationships with the prevalence of high scores. The estimated level of intelligence from the two-test WASI was related to the base rates of high scores on the D-KEFS, where the number of high scores increased with higher WASI FSIQ. Among healthy individuals with high intellectual functioning (i.e., WASI ≥ 110), only about a third of the sample (i.e., 32.1%) obtained no scores at or above the 91st percentile when interpreting 7 scores from the three-test battery (see Table 1). When interpreting all Total Achievement scores from the full D-KEFS battery, all participants with this level of intellectual functioning obtained at least 1 score at or above the 75th percentile. This relationship for the three-test D-KEFS battery (i.e., 7 scores) among the total sample is displayed in Figure 1.

Fig. 1. The data included in this figure were based on interpretation of the three-test D-KEFS battery (seven Total Achievement scores) for the sub-sample of participants aged 16–89 years old administered the WASI FSIQ. Standardization data from the Delis-Kaplan Executive Function System (D-KEFS). Source: © 2001 NCS Pearson, Inc. used with permission. All rights reserved. WASI FSIQ = Wechsler Abbreviated Scale of Intelligence Full Scale Intelligence Quotient.
Years of education followed a similar positive relationship with the frequency of high scores, where a greater number of educational years were associated with a greater number of high scores. For the three-test battery, this relationship is displayed in Figure 2. Using the 84th percentile as the cutoff for a high score, when participants with 16 or more years of education were administered the three-test battery, about three quarters (i.e., 75.9%) obtained 1 or more high scores, about half (i.e., 48.6%) obtained 2 or more high scores, about a third (i.e., 37.3%) obtained 3 or more high scores, and about a quarter (i.e., 23.2%) obtained 4 or more high scores (see Table 1).

Fig. 2. The data included in this figure were based on interpretation of the three-test D-KEFS battery (seven Total Achievement scores) for the sub-sample of participants aged 16–89 years old. Standardization data from the Delis-Kaplan Executive Function System (D-KEFS). Source: © 2001 NCS Pearson, Inc. used with permission. All rights reserved.
DISCUSSION
There is a fairly large literature on the multivariate base rates of low scores in children (Brooks et al., Reference Brooks, Sherman and Iverson2010; Cook et al., Reference Cook, Karr, Brooks, Garcia-Barrera, Holdnack and Iverson2018), adults (Holdnack et al., Reference Holdnack, Tulsky, Brooks, Slotkin, Gershon, Heinemann and Iverson2017), and older adults (Brooks et al., Reference Brooks, Iverson and White2009b; Palmer, Boone, Lesser, & Wohl, Reference Palmer, Boone, Lesser and Wohl1998), and on comprehensive test batteries (Brooks et al., Reference Brooks, Holdnack and Iverson2011; Crawford, Garthwaite, & Gault, Reference Crawford, Garthwaite and Gault2007; Schretlen, Testas, Winicki, Pearlson, & Gordon, Reference Schretlen, Testas, Winicki, Pearlson and Gordon2008) and domain specific batteries, such as memory (Brooks, Iverson, Feldman, & Holdnack, Reference Brooks, Iverson, Feldman and Holdnack2009; Brooks, Iverson, Holdnack, & Feldman, Reference Brooks, Iverson, Holdnack and Feldman2008) or executive function (Karr et al., Reference Karr, Garcia-Barrera, Holdnack and Iverson2017, Reference Karr, Garcia-Barrera, Holdnack and Iverson2018). Very little is known, however, about the probability of healthy people obtaining high scores when a battery of neuropsychological tests is administered. This study explored whether the principles of multivariate base rates (Brooks et al., Reference Brooks, Iverson, Holdnack, Holdnack, Drozdick, Weiss and Iverson2013) apply to high scores in a similar way that they apply to low scores. All principles of low score base rates were applicable to high score base rates using the D-KEFS: high scores occurred commonly within the normative sample, the frequency of high scores increased with the numbers of tests administered and scores interpreted, the frequency of high scores was related to the cutoff used to define a high score (i.e., ≥75th, ≥84th, ≥91st, ≥95th, ≥98th percentile), and, lastly, the frequency of high scores was greater among individuals with higher intellectual functioning and more years of education.
It is possible to use the base rates of high scores to identify a pattern of executive function test performance that is above average. For example, as seen in Table 1, when considering 7 scores derived from three tests, obtaining 5 or more scores at or above the 75th percentile [scaled score (SS) ≥12] occurs in only 18.0% of the standardization sample. Obtaining 4 or more scores at or above the 84th percentile (SS ≥ 13) occurs in only 11.3%, and obtaining 2 or more scores at or above the 91st percentile (SS ≥ 14) occurs in 18.4%. All of those patterns of performances would be considered above average for adults in the standardization sample. Having a single high score on tests of executive function is common, but having multiple high test scores reflects a pattern of performance that is more likely to represent a strength in executive function.
Previous research has applied multivariate base rates of low scores to the diagnosis of mild cognitive impairment to reduce the risk for misdiagnosis based on over-interpreting a single low score (Brooks et al., Reference Brooks, Iverson, Feldman and Holdnack2009b; Brooks et al., Reference Brooks, Iverson, Holdnack and Feldman2008; Brooks, Iverson, & White, Reference Brooks, Iverson and White2007; Mistridis et al., Reference Mistridis, Egli, Iverson, Berres, Willmes, Welsh-Bohmer and Monsch2015). In a similar manner, the high score base rates could be applied to assist with the detection of reduced cognitive functioning among high-functioning patients. For example, consider a 68-year-old man with a successful career as a manager and Master’s degree level of education, who presents to a clinic with concerns of cognitive decline, reporting issues with disorganization and memory (and brain imaging revealed mild small vessel ischemic disease). As part of the evaluation, a neuropsychologist administers three common D-KEFS tests: the Trail Making, Verbal Fluency, and Color-Word Interference Tests, providing seven Total Achievement scores for interpretation. If this patient obtained all scores between the 16th (SS = 7) and 63rd (SS = 11) percentiles, with only one score at the 16th percentile, the neuropsychologist might conclude that this represents intact executive function ability. After all, having one or more low D-KEFS scores (16th percentile) out of 7 occurs in 45.9% of people with university degrees (Karr et al., Reference Karr, Garcia-Barrera, Holdnack and Iverson2017). However, as seen in Table 1, 89.1% of healthy adults with 16 or more years education would have obtained one or more scores at or above the 75th percentile and this patient obtained no scores above this threshold. Therefore, it is not the presence of low scores that reflects a possible cognitive deficit; it is the absence of high scores. His performance is consistent with just 10.9% of the normative sample.
As a second example, imagine a high-functioning, university educated business woman is being evaluated because her multiple sclerosis has worsened. Her estimated longstanding intelligence is in the high average to superior classification range. On the three-test D-KEFS battery, she obtains the following scaled scores: 7, 8, 9, 10, 10, 11, and 11. According to the base rates of low scores, presented elsewhere (Karr et al., Reference Karr, Garcia-Barrera, Holdnack and Iverson2017), having 2 or more scores at or below the 25th percentile occurs in 27.8% of those with above average intelligence and having one or more low scores at or below the 16th percentile occurs in 38.6% of high-functioning people. As such, the clinician might be inclined to interpret that pattern of performance as broadly normal. However, as seen in Table 1, only 4.8% of people with high average or superior intellectual functioning obtain no scores at or above the 75th percentile when considering those 7 scores. Again, the absence of a high score might reflect an acquired deficit in her case.
As with high-functioning individuals with many years of education, these high score base rates may have clinical utility with individuals of lower intellectual ability or educational attainment, where declines in functioning can be equally as difficult to identify. As a case example, consider a 45-year-old man presenting for an outpatient neuropsychological assessment after a workplace accident resulting in a penetrative traumatic brain injury to his ventral medial prefrontal cortex. He described himself as a low-average student throughout his life, and he left high school after 9th grade. He wants to return to work, but his employer is concerned about an increase in inappropriate comments and a short temper by the patient, both of which are new since the brain injury. His two-subtest WASI FSIQ is 88. He also completed the four-test D-KEFS battery and attained the following nine scores: 6, 7, 8, 8, 9, 9, 9, 10, and 11. His 2 scores at or below the 16th percentile (SS = 7) were attained on the Inhibition and Inhibition/Switching conditions of the Color-Word Interference Test.
Based on low score base rates published elsewhere (Karr et al., Reference Karr, Garcia-Barrera, Holdnack and Iverson2018), 90.2% of individuals with an FSIQ at or below 89 would attain 4 or more scores at or below the 25th percentile and 92.0% of these individuals would attain 2 or more scores at or below the 16th percentile. Based on the education stratification, 75.0% of individuals with 9–11 years of education would attain 4 or more scores at or below the 25th percentile and 81.5% would attain 2 or more scores at or below the 16th percentile. Based on an interpretation of low scores alone, this individual appears to fall in alignment with his expected level of premorbid functioning. However, he presents with no high scores, although 86.0% of individuals with a similar WASI FSIQ and 91.7% of individuals with a similar level of education obtain at least one high score on this four-test D-KEFS battery. Although his performances are not indicative of an acquired cognitive impairment based on his profile of low scores, his lack of a single high score may correspond to a decline in cognitive functioning, possibly associated with the injury.
Each of these examples makes a case conceptualization based on the frequency of high scores, but it is important to emphasize that base rates are best used in combination with relevant case information to inform clinical judgment. A patient presenting with a specific condition may have an expected executive function deficit that occurs in isolation of other low scores within a battery. In the context of a patient with high pre-morbid functioning, this may be an average score in isolation, with this individual attaining an expected number of high scores based on normative data. Researchers using the D-KEFS have found reductions in executive function attributable to specific neurological conditions, including acquired conditions, such as traumatic brain injury (Heled, Hoofien, Margalit, Natovich, & Agranov, Reference Heled, Hoofien, Margalit, Natovich and Agranov2012; Strong, Tiesma, & Donders, Reference Strong, Tiesma and Donders2011), and neurodegenerative conditions, such as frontotemporal dementia (Huey et al., Reference Huey, Goveia, Paviol, Pardini, Krueger, Zamboni, Tierney, Wassermann and Grafman2009) and Parkinson’s disease (McKinlay, Grace, Dalrymple-Alford, & Roger, Reference McKinlay, Grace, Dalrymple-Alford and Roger2010). In clinical practice, an interpretation of a specific profile of scores may be more useful than using multivariate base rates in isolation. Multivariate base rates are best used in combination with knowledge of the presenting condition, individual case history, and any available clinical information to assist with formulation (e.g., neuroimaging).
All three of these examples above considered education in the case conceptualization. It is important to note that age stratifications are related to the age of the examinee. The base rates were calculated using the full sample, ages 16–89 years; however, education was coded as parental education for participants 16–19 years old, and although education was coded as personal education for participants 20–29 years old, some of these participants may have fewer years of education due to age and progress through schooling (i.e., in active pursuit of a higher education, but yet to achieve a degree) as opposed to limited opportunity or intention to pursue higher education. The correlations between education and high scores did not meaningfully change with the exclusion of 16–19 or 16–29 year olds from the sample, but it is important for the clinician to consider (a) parental education as opposed to personal education for an examinee between the ages of 16 and 19 years, and (b) a 20–29 year-old in active pursuit of higher education may not be comparable to a middle-aged or older adult with 12 or 13–15 years of education. The WASI stratifications may have greater utility for young adults who are actively pursuing a college or university degree.
This study has several limitations. First, the standardization sample was used to calculate both the norm-referenced scores and the multivariate base rates. If an independent sample of participants was administered the D-KEFS and their scores were standardized using the published D-KEFS norms, base rates of high scores for this sample might differ from the standardization sample, especially if this sample was drawn from a different population (e.g., all college-educated adults). A replication of the base rates with a new group of participants would be informative to determine the comparability of the frequencies of high scores to the standardization sample.
Another limitation pertains to the derivation of base rates for different permutations of the D-KEFS battery. There were no separate samples administered briefer or longer batteries of D-KEFS tests, rather the base rates for briefer batteries were calculated based on scores from a subset of tests that the participants were administered. Participants exposed to more tests could have greater familiarity with testing or reduced test anxiety, strengthening performance, or alternatively, some of these participants could experience increased fatigue or inattention due to lengthier test administration.
The study is also limited by intelligence stratifications based on the first edition of the WASI, which was the available edition at the time the D-KEFS was standardized. The base rates cannot be considered precisely accurate if alternatives are used to estimate intellectual (or premorbid intellectual) functioning. Instead, the clinician should consider the general principles set out in our tables, not the actual base rates. It is also important to note that the intelligence-stratified base rates are based on the currently obtained WASI FSIQ, not estimated premorbid intelligence. The clinician needs to determine whether to interpret performances based on current or estimated premorbid intelligence. For example, if a person with a known neurological condition obtained a WASI FSIQ of 109, it would be reasonable for the clinician to assume that the person’s premorbid FSIQ was at least 110 and use the base rate tables for those with high average intelligence.
Additional limitations pertain to the D-KEFS standardization sample, including the age of the dataset, small sample sizes for some education stratifications, and lack of co-norming with other commonly administered test batteries. The D-KEFS standardization sample was stratified to align with the 2000 United States census based on regional distribution and multiple demographic characteristics, including sex, education, and race/ethnicity. Considering the test remains in popular use roughly two decades later, the sample has likely become less consistent with the population over time, which limits the utility of the base rate tables in the assessment of individuals from groups underrepresented in the normative data (e.g., individuals from racial and ethnic minority backgrounds). Education stratifications were based on proportional representation in the United States population, which resulted in some groups having very small sample sizes (e.g., for the three-test battery, only 57 participants had 8 or fewer years of education). These small sample sizes reduce the generalizability of these normative groups in clinical practice. The normative sample also lacks co-normative data with other commonly administered test batteries (e.g., Wechsler Adult Intelligence Scale, Fourth Edition; Wechsler Memory Scale, Fourth Edition). When administered in conjunction with tests of other domains, the normal frequency of high scores would likely be greater due to an increased number of tests administered and interpreted; however, without co-normative data, multivariate base rates of high scores for a more comprehensive battery cannot be derived. A final limitation is that base rates are provided for only three permutations of the D-KEFS battery, and neuropsychologists in clinical practice may use a more flexible approach, where fewer, more, or a different combination of D-KEFS tests are administered.
Despite these limitations, these findings provide the first multivariate base rates calculated for high scores in neuropsychological assessment, complementing the abundant research examining the normal occurrence of low scores among healthy adults. These findings support the principles of multivariate base rates as applied to the other side of the bell curve, and future research can evaluate if these principles hold for other test batteries commonly administered in clinical practice. Although it has yet to be empirically evaluated, the normal prevalence of high scores on the D-KEFS may be similar to other batteries. Multivariate base rate research has consistently demonstrated that obtaining one or more low scores is fairly common across diverse test batteries. The observed base rates vary modestly across batteries, and principles of low score base rates have been established as opposed to specific rules-of-thumb for expected frequencies of low scores. After future studies replicate the current findings on high scores base rates with different test batteries, an omnibus study aggregating base rates across all test batteries evaluated would be of great clinical utility for neuropsychologists seeking to understand the normal frequency of both low and high scores on a test battery. The preparation of additional multivariate base rates and methods for using these high score base rates in conjunction with low score base rates will improve the interpretation of cognitive strengths and weaknesses in clinical practice. Further, high score base rates may improve the detection of mild cognitive impairment or the early stages of dementia among individuals with high premorbid ability, and future research should evaluate their sensitivity at detecting cognitive decline in high-functioning patients.
ACKNOWLEDGEMENTS
Data used for the analyses reported within this manuscript were provided by Pearson, Inc. (2001). Standardization data from the Delis-Kaplan Executive Function System (D-KEFS). Copyright© 2001 NCS Pearson, Inc. used with permission. All rights reserved. San Antonio: Pearson, Inc.
Mauricio A. Garcia-Barrera notes that this work is related, in part, to his grant entitled Characteristics and Correlates of Intraindividual Variability in Executive Control Processes (Natural Sciences and Engineering Research Council of Canada; 418676-2012). Grant L. Iverson notes that this work is related, in part, to the TBI Endpoints Development (TED) Initiative and a grant entitled Development and Validation of a Cognition Endpoint for Traumatic Brain Injury Clinical Trials (subaward from W81XWH-14-2-0176).
Mauricio A. Garcia-Barrera has served in the past as a consultant for Pearson. James A. Holdnack has been previously employed by Pearson, the company that owns and distributes the D-KEFS. Grant L. Iverson has received research support from test publishing companies in the past, including PAR, Inc., ImPACT Applications, Inc., and CNS Vital Signs. He acknowledges current unrestricted philanthropic support from ImPACT Applications, Inc. He receives royalties for one neuropsychological test (Wisconsin Card Sorting Test-64 Card Version).
CONFLICTS OF INTEREST
The authors have nothing to disclose.