


Introduction
Most ruminal bacterial species are known to be able to utilize ammonia for the synthesis of nitrogenous compounds (Jin et al., Reference Jin, Zhao, Zheng, Beckers and Wang2018). Likewise, ammonia is also essential for the growth of fibrous carbohydrate-degrading bacteria. Cellulose and hemicellulose fermentation is increased when the growth of these microorganisms is stimulated, which results in the production of short-chain fatty acids, used as an energy source by ruminants (Lu et al., Reference Lu, Shen and Shen2019).
Ruminants fed with poor-quality pasture, when nutritionally supplemented with nitrogen, show an accelerated growth of fibrolytic bacteria, improving fibre degradation (Figueiras et al., Reference Figueiras, Detmann, Paulino, Valente, Valadares Filho and Lazzarini2010). Therefore, herbage digestibility is also enhanced, which translates into increased energy uptake.
Tropical forages present low quality due to low protein and high fibre content. The limited nitrogen content impairs the use of fibre carbohydrates by ruminal microorganisms and, consequently, animal performance is reduced (Paulino et al., Reference Paulino, Valadares Filho, Detmann, Valadares, Fonseca, Véras and Oliveira2008). In the specific case of the xerophilous forage buffel grass, cuttings or grazing is followed by fast growth, finishing its regrowth cycle (Santana Neto et al., Reference Santana Neto, Oliveira, Oliveira, Santos, Costa, Saraiva and Pinho2019). This fast growth results in a low lignin synthesis; therefore, neutral detergent fibre is low in lignin and fibre digestibility can be high even though the protein content is low (Pinho et al., Reference Pinho, Santos, Bezerra, Oliveira, Carvalho, Campos, Pereira and Correa2013).
Several studies have been performed to identify the ruminal ammonia concentration necessary to optimize the fermentation of fibrous carbohydrates since the study of Satter and Slyter (Reference Satter and Slyter1974). Despite all the information available, there is not a consensus on an ideal concentration (Leng, Reference Leng1990; Detmann et al., Reference Detmann, Paulino, Mantovani, Valadares Filho, Sampaio, Souza, Lazzarini and Detmann2009; Sampaio et al., Reference Sampaio, Detmann, Lazzarini, Souza, Paulino and Valadares Filho2009; Khattab et al., Reference Khattab, Salem, Abdel-Wahed and Kewan2013; Batista et al., Reference Batista, Detmann, Titgemeyer, Valadares Filho, Valadares, Prates, Rennó and Paulino2016). Discrepancies between suggested values may be related to divergent factors between studies, e.g. ruminant species, environmental conditions and diet variations in terms of sources of fibrous carbohydrates and other nutrients (Hobson and Stewart, Reference Hobson and Stewart1997; Kamra, Reference Kamra2005; Shi et al., Reference Shi, Meng, Zhou, Wang, Diao and Yao2008). Thus, studies about ruminal microorganisms from a given ruminant species may not present the same results when repeated with other ruminant species.
Salah et al. (Reference Salah, Sauvant and Archimède2014) reported that the digestible crude protein requirements are higher in lambs (3.36 g/kg LW0.75) when compared to cattle (2.81 g/kg LW0.75) and goats (2.38 g/kg LW0.75). Thus, goats are supposedly more susceptible to the excess of nitrogen in the diets and are affected by ruminal and metabolic alkalosis. The excretion of excessive ammonia is metabolically expensive, because a lot of energy (12 kcal/g de nitrogen) is used to maintain the ideal body nitrogen content (Santos et al., Reference Santos, Pereira, Silva, Pedreira, Carvalho, Ribeiro, Almeida, Pereira and Moreira2014). Furthermore, the excessive protein supplementation increases animal feeding costs and soil contamination due to urinary and faecal nitrogen elimination (Pacheco and Waghorn, Reference Pacheco and Waghorn2008).
Determining the ideal concentration of ammonia to optimize buffel grass digestion is of great importance, especially for dairy goat farming in semi-arid regions, where this grass has been widely used. However, there is no information on the putative effects of different concentrations of non-protein nitrogen (NPN) on the caprine rumen microbiome and on buffel grass fibre digestibility. Defining which bacterial populations are inhibited or stimulated by different ammonia contents would allow us to better understand the fermentation of fibre carbohydrates in the rumen and it will be possible to manipulate correctly the rumen microorganisms in order to increase fibre digestion and microbial synthesis, resulting in better animal performance.
Therefore, the present study investigated fermentation parameters, the ruminal bacterial communities, nutrient intake, nutrient digestibility and nitrogen balance of goats fed buffel grass-based diets supplemented with different concentrations of ruminal ammonia originated from NPN.
Material and methods
All procedures performed in studies involving animals were in accordance with the ethical standards of the institution or practice at which the studies were conducted (Ethics Committee at the Federal University of Paraíba – UFPB, in Brazil, protocol no. 0209/14).
Local considerations for carrying out the experiment
The experiment was carried out from July to October 2016 in the Small Ruminant Research Center (UPPR) at the Animal Science Section of the Center for Agrarian Sciences, Federal University of Paraíba, in the municipality of Areia, PB, Brazil.
Animals and experimental design
The experiment involved five castrated rumen-cannulated mixed-breed adult goats, with an average weight of 45 ± 2.3 kg and prophylactically treated against endo- and ectoparasites. Goats were housed individually in cement-floored pens (2 m2/stall) equipped with individual food and water troughs. Feed, water and mineral salt were provided ad libitum.
Ruminal parameters were assessed according to a 5 × 5 Latin square experimental design, consisting of five periods, five treatments and five animals. Each period (19 days) was divided into adaptation to the diet (14 days) and data collection (5 days).
Food management and experimental diets
Different levels of NPN in the goat diets were tested. The animals were fed a low-protein, deferred buffel grass diet that was supplemented with five protein levels (Table 1). Control treatment consisted exclusively of roughage, whereas the other treatments included ruminal infusion of a nitrogen supplement to increase dietary CP by 1.94, 3.89, 5.83 and 7.77%. The ruminal infusion resulted in five levels of ruminal ammonia nitrogen (N-NH3; 3.43, 9.95, 17.2, 23.0 and 33.7 mg/dl N-NH3). The supplement comprised urea, ammonium sulphate and casein at the ratio of 75.00:8.33:16.67. Ammonium sulphate was used to provide sulphur (S), whereas casein was included as a source of branched-chain fatty acids; both ingredients were used to ensure favourable conditions for ruminal fermentation (Table 1).
Table 1. Chemical composition of forage and supplement components based on dry matter (DM)
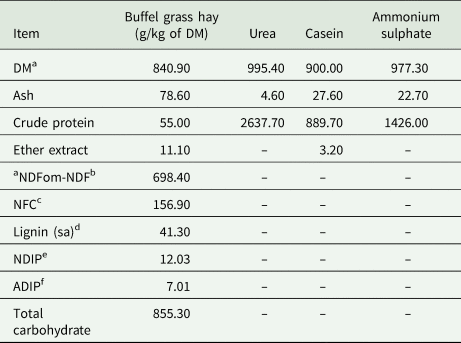
a Based on natural matter.
b Neutral detergent fibre assayed a heat-stable amylase and expressed exclusive of residual ash.
c Non-fibrous carbohydrate.
d Lignin determined by solubilization of cellulose with sulphuric acid.
e Neutral detergent indigestible protein.
f Acid detergent indigestible protein.
Buffel grass was harvested from a pasture that had not been grazed for 90 days. The grass was harvested at 10 cm above soil level using a backpack mower. The material was then baled, transported to and stored in a shed where the experiment took place.
Ground hay was supplied twice daily, at 08:00 h and 16:00 h, in two equal portions. Orts were weighed daily, and the supplied amount was adjusted according to the intake of the previous day so as to allow 10% orts. The supplement was fractioned and administered directly into the rumen of the animals at the time the roughage was supplied. The amount of supplement infused daily was calculated considering the roughage intake of the previous day.
Intake and digestibility of nutrients
Nutrient intake was estimated using the difference between the averages of total nutrient in the offered diet and in the remaining food. Samples of hay, supplement and leftovers were taken to perform the chemical analysis.
The digestibility trial was carried out by total faeces collection. Between days 11 and 13 of each period, faeces were collected twice per day in bags fitted to the animals, weighed and kept at −15°C. Samples of diet, leftovers and faeces of each animal in each period were pooled and homogenized. One composite sample per animal was pre-dried in a forced circulation drying oven at 60°C for 72 h to be used in chemical analyses: dry matter (DM), crude protein (CP), ether extract (EE) and neutral detergent fibre (NDF). Digestibility was calculated using the equations described by Berchielli et al. (Reference Berchielli, Pires and Oliveirapires2006).
Analysis of purine derivatives
Spot urine samples were collected at 4 h after the first feed delivery during spontaneous urination, using collection bags (adapted 65 mm colostomy bags) attached to the animals. The urine sample from each animal was filtered and 10 ml aliquots were taken, immediately diluted in 40 ml of 0.036 N sulfuric acid (Valadares et al., Reference Valadares, Broderick, Valadares Filho and Clayton1999) and frozen for later analysis.
Urinary levels of allantoin, xanthine and hypoxanthine were determined according to Chen and Gomes (Reference Chen and Gomes1992). Uric acid and urea concentrations in the urine were measured using commercial kits (Bioclin®, Bio 380 and Bio 800, Belo Horizonte, Brazil).
To determine the total purine derivatives, the allantoin, uric acid, xanthine and hypoxanthine contents were summed. The amount of absorbed microbial purines (mmol/day) was estimated from the excretion of total purine derivatives (mmol/day), using the equations proposed by Chen and Gomes (Reference Chen and Gomes1992).
Analysis of chemical composition
Diet samples were pre-dried, ground and homogenized for chemical analyses, which were performed in duplicate following the Association of Official Analytical Chemists (AOAC 2012), for DM (method 934.01), CP (method 954.01), EE (method 920.39), ash (method 942.05) and lignin (method 973.18). The methodology described by Van Soest et al. (Reference Van Soest, Robertson and Lewis1991) was used to determine NDF and acid detergent fibre (ADF) contents, using an ANKOM fibre analyser (ANKOM200 – ANKOM Technology Corporation, Fairport, New York, USA). NDF and ADF contents were corrected for ash and protein, with their residues incinerated in a muffle furnace at 600°C for 4 h. Protein was corrected using neutral (NDIP) and acid (ADIP) detergent insoluble protein. The NDIP and ADIP were determined according to Mertens (Reference Mertens2002).
Total (TC) and non-fibrous carbohydrates (NFC) were calculated using the following equations proposed by Sniffen et al. (Reference Sniffen, O'Connor, Van Soest, Fox and Russel1992):

Ruminal fluid collection for analysis of fatty acids, pH and ammonia nitrogen
Ruminal fluid samples were collected via ruminal cannula on the 15th day of each experimental period at 04:00 h, 08:00 h, 12:00 h, 16:00 h, 20:00 h and 24:00 h. The pH, amoniacal nitrogen (N-NH3) and volatile fatty acid (VFA) concentrations were determined in the rumen fluid.
Rumen fluid samples were harvested 4 h after the morning feed for VFA analysis and microbial DNA extraction. The samples were filtered through gauze and placed in 1.5 ml microcentrifuge tubes. Each variable was analysed in duplicate.
Rumen fluid pH was measured in microtubes immediately after collection using a digital pH potentiometer (Schott®Handylab, Mainz, Germany). For the subsequent analysis of N-NH3, rumen fluid samples were centrifuged in microtubes at 12 000 rpm for 10 min and the supernatant was transferred to a new microtube and frozen. Ammoniacal nitrogen concentrations were determined by a colorimetric method (Chaney and Marbach, Reference Chaney and Marbach1962).
To determine VFAs, a 2.0 ml sample of growth medium was placed in microtubes and centrifuged at 5200 g for 10 min. The supernatant was then frozen for VFA analysis, performed by means of high-performance liquid chromatography (Shimadzu model SPD-10a VP, Dallas, Texas, USA) coupled to an ultraviolet detector at the wavelength of 210 nm. VFA concentrations were analysed using a 30 cm × 4.5 mm diameter commercial column (HPX-87H, Biorad, Hercules, CA, USA) under the following conditions: 0.8 ml/min column flow, 74 kgf pressure, 0.05 MM sulphuric acid as mobile water phase and 20 μl injection volume.
The test results for each time (04:00 h, 08:00 h, 12:00 h, 16:00 h, 20:00 h and 24:00 h) were used to calculate the average ruminal pH, N-NH3 and VFA of the treatments.
Analysis of the bacterial community of ruminal fluid by sequencing 16s rRNA marker genes (metataxonomics) using high-throughput sequencing
Bacterial community analyses by 16S ribosomal RNA sequencing were carried out for three treatments (3.43, 17.2 and 13.27% CP) to characterize the lowest, intermediate and highest levels of nitrogen supplement inclusion. DNA was extracted from the rumen fluid samples using a commercial kit (Power Soil DNA Isolation kit, MoBio, Carlsbad, CA, USA), following the manufacturer's instructions. The V3–V4 region of the 16S rRNA gene was amplified by PCR (95°C for 3 min, followed by 25 cycles at 95°C for 30 s, 55°C for 30 s and 72°C for 30 s and a final extension at 72°C for 5 min), using the 16S Amplicon PCR Forward Primer = 5′ TCGTCGGCAGCGTCAGATGTGTATAAGAGACAGCCTACGGGNGGCWGCAG 3′ and the 16S Amplicon PCR Reverse Primer = 5′ GTCTCGTGGGCTCGGAGATGTGTATAAGAGACAGGACTACHVGGGTATCTAAC 3′. Reactions were carried out in triplicate, in a final volume of 25 μl containing 12.5 μl 2 × KAPA HiFi HotStart Ready Mix, 5 μl of each primer and 2.5 ng of DNA template. The purified PCR products were quantified by fluorometry using Qubit 3.0 (Life Technologies, Mississauga, Toronto, Canada).
The library was prepared using the kit Nextera XT sample Prep (Illumina, San Diego, CA, USA). Subsequently, DNA fragments were purified using the Agencourt AMPure XP reagent (Beckman, Brea, CA, USA). After purification, the library was analysed in a capillary electrophoresis system (Fragment Analyzer, Agilent Technologies, Santa Clara, USA). Paired-end sequencing was performed on MiSeq (Illumina) using a 2 × 250 bp V2 kit (Illumina) according to the manufacturer's instructions.
Sequencing data analysis
Raw, demultiplexed and paired sequences were processed using QIIME 2 v.19.7 (Bolyen et al., Reference Bolyen, Rideout, Dillon, Bokulich, Abnet, Al-Ghalith, Knights, Koester, Kosciolek, Kreps, Langille, Lee, Ley, Liu, Loftfield, Lozupone, Maher, Marotz, Martin, McDonald, McIver, Melnik, Metcalf, Morgan, Morton, Naimey, Navas-Molina, Nothias, Orchanian, Pearson, Peoples, Petras, Preuss, Pruesse, Rasmussen, Rivers, Robeson, Rosenthal, Segata, Shaffer, Shiffer, Sinha, Song, Spear, Swafford, Thompson, Torres, Trinh, Tripathi, Turnbaugh, Ul-Hasan, van der Hooft, Vargas, Vázquez-Baeza, Vogtmann, von Hippel, Walters, Wan, Wang, Warren, Weber, Williamson, Willis, Xu, Zaneveld, Zhang, Zhu, Knight, Caporaso and Bai2019). Paired-end reads (200–500 bp) with a minimum Phred score of 20 were joined and dereplicated using VSEARCH (Rognes et al., Reference Rognes, Flouri, Nichols, Quince and Mahé2016). Chimeric sequences were removed using UCHIME (Edgar et al., Reference Edgar, Haas, Clemente, Quince and Knight2011). Clusterization was performed by the de novo approach with 99% similarity between the centroid groups for Operational Taxonomic Units (OTUs) classification. The number of sequences per sample was normalized at 14 900 reads for α and β ecological diversity analyses. Taxonomic classifications were performed using a Naïve Bayes classifier on the SILVA v. 132 trained database with 99% for the V3–V4 region (Quast et al., Reference Quast, Pruesse, Yilmaz, Gerken, Schweer, Yarza, Peplies and Glöckner2013).
The phylogenetic tree was constructed in FastTree2 (Price et al., Reference Price, Dehal and Arkin2010) by means of Multiple Alignment using Fast Fourier Transform (MAFFT) (Katoh et al., Reference Katoh, Misawa, Kuma and Miyata2002). Visualizations of taxonomical composition (relative abundance and α diversity) were performed using the Phyloseq v.1.8.2 package (McMurdie and Holmes, Reference McMurdie and Holmes2013) in R software v.3.5.7.
The α diversity was assessed using the ecological indices Chao1 and Shannon, which estimate richness and evenness, respectively. For β diversity analysis, the distance matrix across the samples was constructed using the unweighted qualitative metric Unifrac (Lozupone and Knight, Reference Lozupone and Knight2005) and visualized by principal coordinate analysis.
Differential bacterial abundance across the treatments was assessed by Linear Discriminant Analysis Effect Size (LEfSe) according to Segata et al. (Reference Segata, Izard, Waldron, Miropolsky, Garret and Huttenhower2011).
Statistical analyses
Ruminal parameters, nutrient intake, nutrient digestibility and nitrogen balance data were subjected to variance (ANOVA) and regression analyses, using the GLM and REG procedures of the Statistical Analysis System software (SAS, 2002), and a probability level of 5%. A Latin square experimental design (5 × 5) was used, consisting of five periods, five treatments and five animals, and the following statistical model:

where Yijk is the dependent variable, μ is the overall mean, Ti is the effect of treatment i (i = 1, 2, 3, 4 or 5), Pj is the effect of period j (j = 1, 2, 3, 4 or 5), Ak is the effect of animal k (k = 1, 2, 3, 4 or 5), and ɛijk is the experimental error.
The α diversity indices were evaluated by the paired Kruskal–Wallis test, whereas dissimilarity between treatments was investigated by the permutational multivariate method (PERMANOVA) using QIIME 2 v.19.7 (Bolyen et al., Reference Bolyen, Rideout, Dillon, Bokulich, Abnet, Al-Ghalith, Knights, Koester, Kosciolek, Kreps, Langille, Lee, Ley, Liu, Loftfield, Lozupone, Maher, Marotz, Martin, McDonald, McIver, Melnik, Metcalf, Morgan, Morton, Naimey, Navas-Molina, Nothias, Orchanian, Pearson, Peoples, Petras, Preuss, Pruesse, Rasmussen, Rivers, Robeson, Rosenthal, Segata, Shaffer, Shiffer, Sinha, Song, Spear, Swafford, Thompson, Torres, Trinh, Tripathi, Turnbaugh, Ul-Hasan, van der Hooft, Vargas, Vázquez-Baeza, Vogtmann, von Hippel, Walters, Wan, Wang, Warren, Weber, Williamson, Willis, Xu, Zaneveld, Zhang, Zhu, Knight, Caporaso and Bai2019).
Results
Dry matter intake (g/day and g/100 g live weight), digestibility of DM and NDF, faecal nitrogen and microbial protein were not affected by nitrogen infusion, with mean values of 862 g/day, 1.83 g/100 g live weight, 0.74, 0.78, 1.91 and 87.6 g/day, respectively (Table 2). There was a quadratic effect of N-NH3 levels on NDF (P = 0.035) intake; maximum NDF intake estimated by the model was 681 g/day NDF, which corresponded to the 13.7 mg/dl N-NH3 level. There was a linear increase in CP intake (P < 0.001) and EE intake (P = 0.004), as well as CP digestibility (P = 0.010) and EE digestibility (P = 0.038).
Table 2. Mean values of ruminal ammoniacal nitrogen (N-NH3), pH, volatile fatty acids (VFA) ruminal fluid, intake, digestibility and nitrogen balance of goats with infusion of N-NH3 in the rumen

1 Levels of infused ruminal ammoniacal nitrogen; 2L: linear; Q: quadratic; 3Standard error of the mean; 4Live weight; 5Crude protein; 6Ether extract; 7Neutral detergent fibre; 8Dry Matter; 9Nitrogen balance; 10Microbial protein; aŶ = 45.5 + 2.02x (R 2 = 0.87); bŶ = 11.4 + 0.15x (R 2 = 0.71); cŶ = 613 + 8.67x−0.31 × 2 (R 2 = 0.96); dŶ = 73.2 + 0.55x (R 2 = 0.84); eŶ = 65.5 + 0.57x (R 2 = 0.84); fŶ = 5.60 + 2.44x (R 2 = 0.91); gŶ = 0.002 + 0.001x (R 2 = 0.66) and hŶ = 2.80 + 2.44x (R 2 = 0.91); iŶ = 0.285 + 0.881x (R 2 = 0.99).
There was a linear increase in nitrogen intake (P < 0.001), urinary nitrogen excretion (P = 0.029) and nitrogen balance (P < 0.001) as a function of N-NH3 levels (Table 2).
Rumen fluid pH was not affected by N-NH3, and the overall mean was 6.43 (P = 0.872), as presented in Table 2.
Rumen ammoniacal nitrogen (N-NH3) increased linearly (P = 0.011) in response to N-NH3 infusion (Table 2). Ruminal acetate (P = 0.785), propionate (P = 0.895), butyrate (P = 0.827) and total VFA (P = 0.828) were not affected by infusion; mean values were 21.6, 3.85, 3.23 and 28.7 mmol/l, respectively (Table 2).
A total of 39 336 different OTUs were identified after clusterization, with joined sequences ranging from 222 to 491 bp (mean = 448.94 bp). There was no difference between treatments (P > 0.050) regarding the α diversity indices Chao1 and Shannon (Figs 1(a) and (b)). There was a high similarity in the microbial composition between the three N-NH3 (Fig. 2) and no significant differences (P > 0.050) were observed in β diversity between treatments.

Fig. 1. Chao1 (a) and Shannon (b) diversity indices for the ruminal bacterial communities of goats fed diets supplemented with three levels of ruminal ammoniacal nitrogen (N-NH3; 3.43, 17.2 and 33.7 mg/dl N-NH3).

Fig. 2. Principal coordinate analysis (PCoA) plot based on the Unifrac unweighted distance matrix generated from rarefied taxon abundances and depicting β diversity patterns of the ruminal bacterial communities of goats fed diets supplemented with different levels of ruminal ammoniacal nitrogen – N-NH3 (PC1 = 3.43 mg/dl N-NH3; PC2 = 17.2 mg/dl N-NH3; and PC3 = 33.7 mg/dl N-NH3).
The detailed composition of the bacterial communities is shown in Fig. 3. Firmicutes, Bacteroidetes, Patescibacteria, Proteobacteria, Spirochaetes and Fibrobacteres were the most abundant phyla in all treatments. At the family level (Fig. 3(b)), Ruminococcacea abundance increased progressively (27.0, 31.4 and 33.8%) with increasing ammoniacal nitrogen (3.43, 17.2 and 33.7 mg/dl N-NH3, respectively). By contrast, a lower abundance (28.9%) of Lachnospiraceae was observed in animals on 33.7 mg/dl N-NH3 compared with those animals on 3.43 mg/dl N-NH3 (31.5%) and 17.2 mg/dl N-NH3 (32.0%).
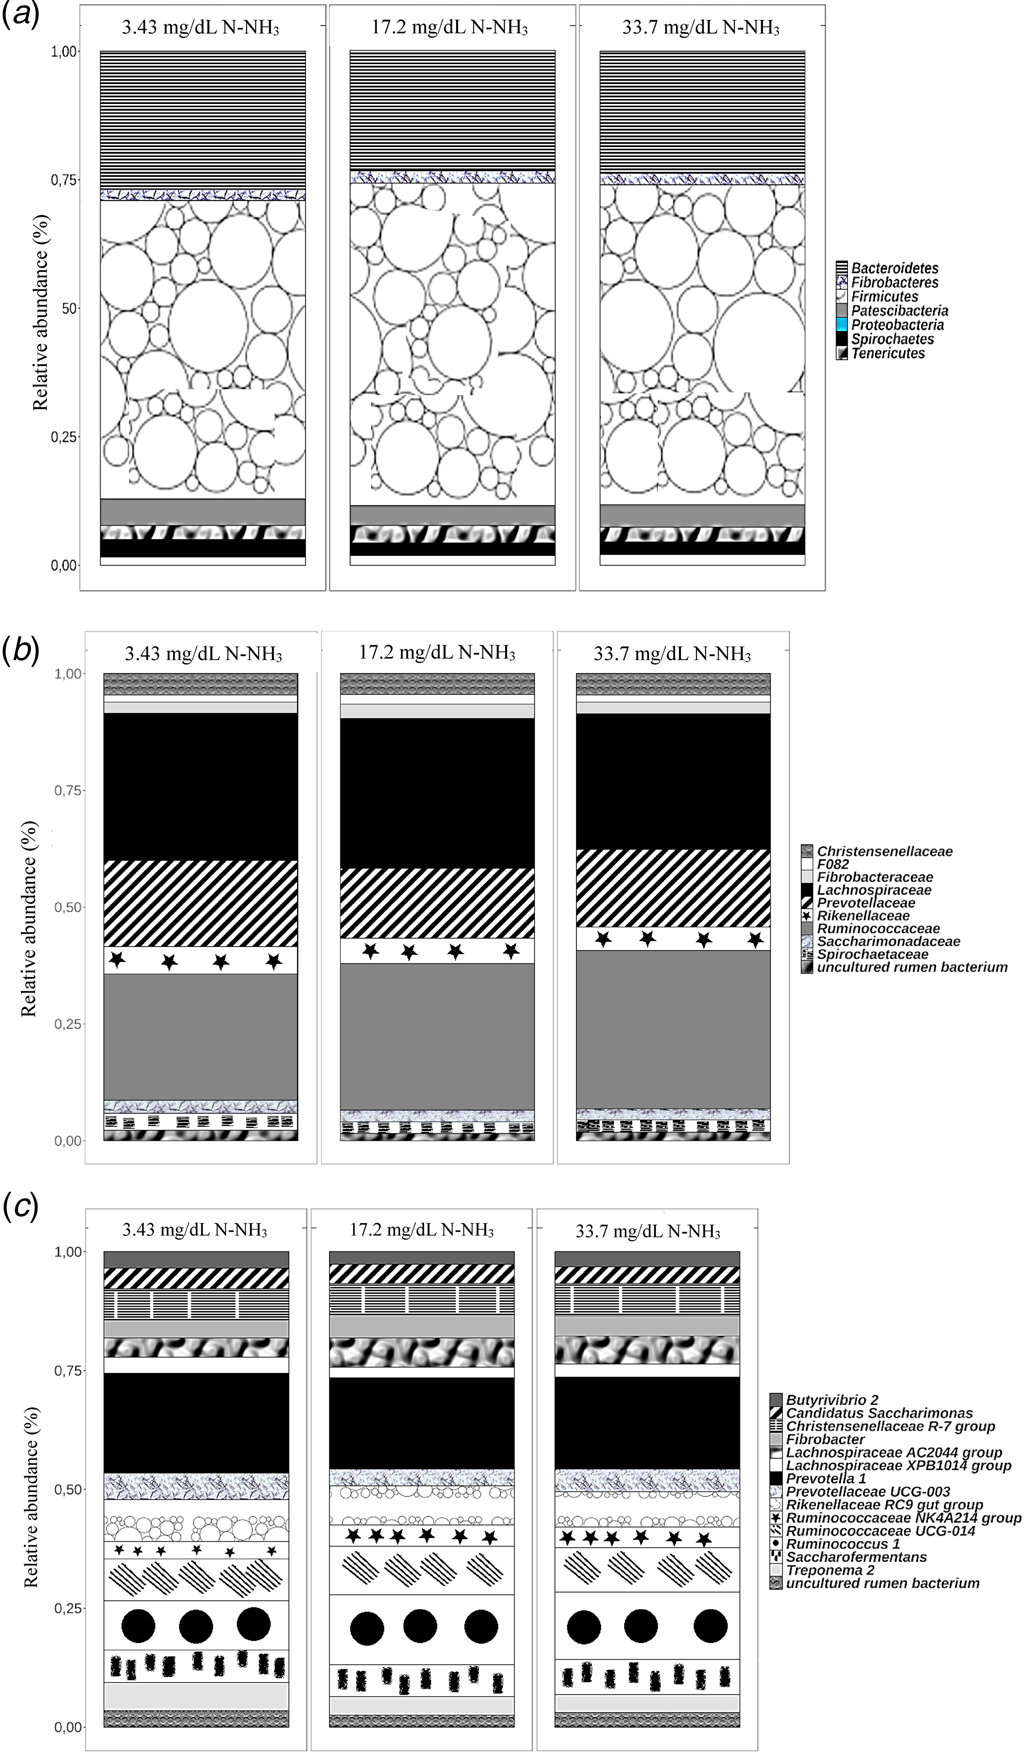
Fig. 3. Relative abundances at the phylum (a), family (b) and genus (c) taxonomic levels of bacterial populations in the rumen of goats fed diets supplemented with three levels of ruminal ammoniacal nitrogen (N-NH3; 3.43, 17.2, and 33.7 mg/dl N-NH3).
It is noteworthy that the bacterial composition of the rumen of goats with 17.2 and 33.7 mg/dl N-NH3 was quite similar. Minor OTU shifts at the genus level can be observed in the rumen of goats with 3.43 mg/dl N-NH3 compared with the other two treatments. A higher abundance of Ruminococcaceae (Ruminococcus 1, Ruminococcaceae UCG-014 and Ruminococcaceae NK4A214 group) was observed in the rumen of goats infused with higher concentrations of N-NH3 (17.2 and 33.7 mg/dl N-NH3). On the other hand, animals from these groups presented lower ruminal abundance of Prevotelacea and Treponema (Fig. 3(c)).
Discussion
The increase in the ammoniacal nitrogen (N-NH3) provided by NPN infusion corroborates a previous in vitro study which showed a linear increase of N-NH3 in a medium containing buffel grass and different concentrations of nitrogen ammonia (Santana Neto et al., Reference Santana Neto, Oliveira, Oliveira, Santos, Costa, Saraiva and Pinho2019). Interestingly, no changes in other ruminal parameters were observed in our study (pH, acetate, propionate, butyrate and total VFA). VFA production and NDF digestibility even in non-supplemented animals (Table 2) suggest that the microorganisms in the caprine rumen are able to grow and maintain fermentation and metabolic processes when fed buffel grass only. This is corroborated by the fact that in vitro fibre degradation of buffel grass and ruminal microorganism growth were shown to occur even in the absence of NPN supplementation, when N-NH3 concentration was only 1.63 mg/dl (Santana Neto et al., Reference Santana Neto, Oliveira, Oliveira, Santos, Costa, Saraiva and Pinho2019). Stefański et al. (Reference Stefański, Ahvenjärvi, Vanhatalo and Huhtanen2020) also observed that when ruminal ammonia content is low, ruminal bacteria are more efficient in the use of extracellular nitrogen, and that the fermentation and synthesis processes are maintained.
On the other hand, the results presented herein conflict with the concept that minimum ruminal ammonia nitrogen is necessary for microbial growth (Sampaio et al., Reference Sampaio, Detmann, Lazzarini, Souza, Paulino and Valadares Filho2009; Khattab et al., Reference Khattab, Salem, Abdel-Wahed and Kewan2013; Batista et al., Reference Batista, Detmann, Titgemeyer, Valadares Filho, Valadares, Prates, Rennó and Paulino2016), since the levels provided by buffel grass alone are lower than reported previously. According to Satter and Slyter (Reference Satter and Slyter1974), the low N-NH3 concentration in forages with <7% CP limits microbial growth. Sampaio et al. (Reference Sampaio, Detmann, Lazzarini, Souza, Paulino and Valadares Filho2009) reported that the minimum CP content (%DM) for rumen microorganisms to exhibit minimal fibre-degradation ability is 7%, which corresponds to a minimum ammoniacal nitrogen concentration of 6.24 mg/dl in the rumen. This minimum CP content is based on previous studies that determined minimal concentrations of ruminal N-NH3 for fibre degradation to occur, e.g. 4–5 mg/dl (Satter and Slyter, Reference Satter and Slyter1974) and 10 mg/dl (Van Soest, Reference Van Soest1994).
Other studies have focused on the definition of the optimal ruminal N-NH3 concentration for NDF intake and fermentation. Leng (Reference Leng1990) observed maximum intake and ruminal degradation of NDF with 10–20 mg/dl of N-NH3. Detmann et al. (Reference Detmann, Paulino, Mantovani, Valadares Filho, Sampaio, Souza, Lazzarini and Detmann2009) indicated 8–15 mg/dl as optimum ruminal N-NH3 for fibre intake and degradation. Pires et al. (Reference Pires, Santana Neto, Oliveira, Oliveira, Santos and Santos2016) reported a 20% increase in the NDF degradation rate at 15 mg/dl N-NH3 in the rumen fluid, compared to the treatment without N-NH3. Santana et al. (Reference Santana Neto, Oliveira, Oliveira, Santos, Costa, Saraiva and Pinho2019) also observed that an N-NH3 concentration of 17.76 mg/dl maximized NDF degradation from buffel grass by goat rumen microorganisms.
In the present study, the lowest N-NH3 in the rumen was 3.24 mg/dl, corresponding to the diet buffel grass only (5.5% CP) or 3.43 mg/dl N-NH3 (Table 2), which is lower than the minimum values recommended by other authors for fibre degradation (Table 2). On the other hand, 9.95 mg/dl N-NH3 (9.4%CP) and 23.0 mg/dl N-NH3 (11.3%CP) provided ammoniacal nitrogen concentrations between 9.09 and 20.47 mg/dl (Table 2) in the rumen; maximum fibre degradation is supposed to occur within this range, according to the above-mentioned authors. Interestingly, these different N-NH3 levels did not lead to significant shifts in the ruminal microbial populations (Figs 1–3).
The phyla found in the rumen fluid (Fig. 3(a)) comprised bacterial organisms capable of degrading fibrous carbohydrates (Gradel and Dehority, Reference Gradel and Dehority1972; Dehority, Reference Dehority1973; Dušková and Marounek, Reference Dušková and Marounek2001; Oliveira et al., Reference Oliveira, Zanini and Santos2007). Firmicutes and Bacteroidetes were the most abundant phyla in the goat rumen regardless of the diets (Fig. 3(a)), corroborating previous studies that report these as the dominating phyla in the microbiota of all herbivorous animals (Wang et al., Reference Wang, Xu, Kong, Yang, Wu, Mishra and Li2016; O'Donnell et al., Reference O'Donnell, Harris, Ross and O'Toole2017).
Ruminococcus, Prevotella and Butyrivibrio are among the important carbohydrate-degrading bacteria in the rumen (O'Donnell et al., Reference O'Donnell, Harris, Ross and O'Toole2017). In the present study, these genera were abundantly found in the rumen of goats fed diets supplemented with different concentrations of N-NH3. The microbial composition analysis corroborates previous reports indicating Ruminococcus as one of the most abundant microbial genera in the goat rumen (Ferreira et al., Reference Ferreira, Hervas, Belenguer, Celaya, Rodrigues, Garcia, Frutos and Osoro2017). As expected for herbivorous species, Prevotella was also highly abundant (Fig. 3(b)).
Compared to those of sheep and cattle, the rumen microbial population of goats is more specialized in fermenting fibrous carbohydrates (Ferreira et al., Reference Ferreira, Hervas, Belenguer, Celaya, Rodrigues, Garcia, Frutos and Osoro2017). This is supported by the high abundance of Ruminococcaceae in the rumen of animals under all NPN supplementation levels reported herein (Fig. 3(b)). Unlike the present study, the phylum Lachnospiraceae was not detected in goats, only in sheep and cattle (Ferreira et al., Reference Ferreira, Hervas, Belenguer, Celaya, Rodrigues, Garcia, Frutos and Osoro2017). This is possibly due to differences in the composition of fibrous carbohydrates present in the diet used to feed the animals in these studies. Different from other grasses, buffel grass has a low lignin content (4.13%) (Table 1) because of its rapid growth and flowering after the rainy period. Indeed, several studies have shown that lignin is not synthesized in large amounts during its regrowth (Moreira et al., Reference Moreira, Lira, Santos, Araujo and Silva2007; Perazzo et al., Reference Perazzo, Homem Neto, Ribeiro, Santos, Carvalho, Oliveira, Bezerra, Campos and Freitas Junior2017; Pereira et al., Reference Pereira, Oliveira, Santos, Carvalho, Araújo, Sousa and Cartaxo2018).
Lignin is a phenolic compound of the plant cell wall that is toxic to various fibrolytic bacteria, such as the family Lachnospiraceae (Paciullo, Reference Paciullo2002; Santana and Cavali, Reference Santana and Cavali2006; Lage, Reference Lage2009; Ferreira et al., Reference Ferreira, Hervas, Belenguer, Celaya, Rodrigues, Garcia, Frutos and Osoro2017). Therefore, the low lignin contents of the diet could have favoured Lachnospiraceae growth in the animals of the current study. Lignin also negatively affects the digestion of the feed protein and can thereby inhibit the proliferation of ammonia-producing bacteria (Flythe and Kagan, Reference Flythe and Kagan2010). In the present study, even the control diet presented high nutrient digestibility (Table 2), probably because of the low lignin contents of buffel grass hay.
Prevotella are known to be ammonia-producing bacteria (Cherdthong and Wanapat, Reference Cherdthong and Wanapat2010), and the high abundance of Prevotella in all treatments (Fig. 3(b)) might be related to a high proteolytic activity through deamination of the protein from buffel grass, which served as a nitrogen source for the growth of other microorganisms.
The higher abundance (P < 0.050) of Lachnobacterium in the rumen of goats indicates that the highest ammoniacal nitrogen (33.7 mg/dl N-NH3) did not compromise the ruminal microbiome as these organisms are involved in both hemicellulolytic and cellulolytic metabolisms in herbivores (Witzig et al., Reference Witzig, Boguhn, Kleinsteuber, Fetzer and Rodehutscord2010). There is a high diversity of acetate-producing bacteria in the rumen, including the fibrous carbohydrate-fermenting Lachnospiraceae species (Gagen et al., Reference Gagen, Padmanabha, Denman and McSweeney2015).
According to Cherdthong and Wanapat (Reference Cherdthong and Wanapat2010), at high N-NH3 concentrations, ruminal microorganisms utilize the dehydrogenase glutamate pathway to incorporate nitrogen for microbial growth. However, at low concentrations of N-NH3 in the rumen, nitrogen is incorporated in two steps and both require ATP: glutamine synthetase and glutamate synthase (Cherdthong and Wanapat, Reference Cherdthong and Wanapat2010). Thus, rumen bacteria do not cease to incorporate nitrogen when it is present in small amounts in the rumen; rather, there is a shift in metabolism to a pathway that requires more energy. Since energy availability was similar between NPN supplementation levels tested in the present study (Table 1), ruminal N-NH3 concentration did not interfere with microbial growth and, consequently, with the profile of the ruminal bacterial community. The lack of a significant effect of NPN supplementation on VFA concentration and pH (Table 2) and the high nutrient digestibility even in low ruminal ammonia concentrations are not only indicative of a lack of significant changes in microbial growth, but also that energy availability in the rumen remained the same.
It is important to point out that the crude protein intake of animals submitted to 3.43 and 9.95 mg/dl N-NH3 levels (Table 2) was lower than the crude protein requirement (66 g/day) for goats with an average body weight of 45 kg preconized by NRC (2007). However, the animals had a positive nitrogen balance showing that levels between 3.43 and 9.95 mg/dl N-NH3 were enough to maintain both the microbial growth and ruminal substrate degradation (Table 2). According to Michalski et al. (Reference Michalski, Kowalczyk, Voigt, Hammon, Czauderna and Metges2012), goats are more efficient than cattle in recycling nitrogen.
The positive nitrogen balance (Table 2) shows the importance of recycling urea in order to maintain minimum ruminal nitrogen to meet the demands of rumen microorganisms. The positive nitrogen balance in all N-NH3 contents indicates nitrogen retention by the animals independent of supplementation levels.
According to Zeoula et al. (Reference Zeoula, Fereli, Prado, Geron, Caldas Neto, Prado and Maeda2006), nitrogen balance is obtained by difference between ingested and excreted nitrogen. This value can be positive, negative or null. Knowing these values, it is possible to determine the protein metabolism, and if there was gain or loss of protein (Ladeira et al., Reference Ladeira, Rodriguez, Borges, Gonçalves, Saliba and Miranda2002). Therefore, it is suggested that the protein maintenance requirements of goats were fulfilled in the current study, because nitrogen balance was positive in all ruminal N-NH3 levels (Table 2). Nitrogen retention is only possible when available protein is higher than that required for maintenance. It is noteworthy that ruminal N-NH3 was lower in the present study than those observed for cattle by Detmann et al. (Reference Detmann, Paulino, Mantovani, Valadares Filho, Sampaio, Souza, Lazzarini and Detmann2009).
On the other hand, excessive ruminal N-NH3 levels result in free blood nitrogen and increase the metabolic activity of the liver as a means to recycle urea in order to maintain homeostasis. As a result, an energy deficit may occur (Noro and Wittwer, Reference Noro and Wittwer2012) and animal performance can be compromised (Detmann et al., Reference Detmann, Paulino, Valadares Filho and Lana2007). Hence, ruminal ammoniacal nitrogen presented a positive effect up to 14.5 mg/dl N-NH3, since nutrient intake reduced in higher levels. Based on these results, buffel grass use by goats is optimized at 14.5 mg/dl N-NH3. Detmann et al. (Reference Detmann, Paulino, Mantovani, Valadares Filho, Sampaio, Souza, Lazzarini and Detmann2009) reported similar results in beef cattle fed Brachiaria brizantha (15 mg/dl N-NH3).
Therefore, the optimum level for goats fed buffel grass is 14.5 mg/dl N-NH3, whereas 3.43 mg/dl N-NH3 is enough to maintain microbial activity and fibre degradation.
Based on the observed results, it can be assumed that carbohydrate-fermenting ruminal microorganisms are able to grow in ammoniacal nitrogen concentrations lower than 5.00 mg/dl, without affecting microbial populations in the goat rumen. On the other hand, it is important to point out the role of the energetic source that provides the carbon skeleton for protein microbial synthesis. In the current study, the low lignin content of buffel grass and the consequent high NDF digestibility could explain the observed results. Furthermore, it is necessary to increase ruminal ammoniacal nitrogen up to 14.5 mg/dl to optimize DM and NDF intake. This concentration is close to that recommended for cattle (Leng, Reference Leng1990; Detmann et al., Reference Detmann, Paulino, Mantovani, Valadares Filho, Sampaio, Souza, Lazzarini and Detmann2009; Pires et al., Reference Pires, Santana Neto, Oliveira, Oliveira, Santos and Santos2016) and can be supplied by NPN sources.
Further research on the use of forages with low lignin contents (e.g. buffel grass), as well the use of true protein sources in goat feeding is warranted, in order to better elucidate the nitrogen utilization process of fibrous-carbohydrate-fermenting bacteria in the goat rumen. Moreover, the high stability of the caprine ruminal microbiota under different ruminal nitrogen concentrations must be further investigated.
Conclusion
The minimum ammoniacal nitrogen to maintain microbial activity in the goat rumen is 3.43 mg/dl and the recommended level to optimize the microbial community and buffel grass utilization is 14.5 mg/dl of ruminal ammoniacal nitrogen in goats.
Financial support
The study was funded by the National Council for Scientific and Technological Development (CNPq); Coordination for the Improvement of Higher Education Personnel (CAPES), for the fellowship grant; and the Integrated Animal Science Program in partnership with the Federal University of Paraíba – Brazil (UFPB).
Conflict of interest
None.
Ethical standards
All procedures performed in studies involving animals were in accordance with the ethical standards of the institution or practice at which the studies were conducted (Ethics Committee at the Federal University of Paraíba – UFPB, in Brazil, approval no. 0209/14).


