1. INTRODUCTION
There is considerable interest in the high-current electron beam sources widely applied in high power microwave (HPM) generation (Barker et al., Reference Barker, Booske, Luhmann and Nusinovich2005; Benford et al., Reference Benford, Swegle and Schamiloglu2007; Booske, Reference Booske2008; He et al., Reference He, Cao, Zhang, Wang and Ling2011), pulsed power technology (Peng et al., Reference Peng, Liu, Song and Su2011; Wu et al., Reference Wu, Wang, Qiu, Han, Li, Lei, Cong, Qiu, Yang and Lv2011; Zhang et al., Reference Zhang, Liu, Wang, Fan, Zhang and Feng2011), plasma physics (Kasperczuk et al., Reference Kasperczuk, Pisarczyk, Chodukowski, Kalinowska, Gus'kov, Demchenko, Klir, Kravarik, Kubes, Rezac, Ullschmied, Krousky, Pfeifer, Rohlena, Skala and Pisarczyk2012; Sakagami et al., Reference Sakagami, Sunahara, Johzaki and Nagatomo2012; Zhou et al., Reference Zhou, Cai, Zhang and He2012), and material processing (Lin et al., Reference Lin, Li, Liu, Liu, Du, Wang, Chen, Zhang, Liu, Liu, Wang, Ma, Lu, Dong, Wang, Sheng, Wei and Zhang2012; Deutsch & Didelez, Reference Deutsch and Didelez2011; Li et al., Reference Li, Liu, Cheng, Chang, Wan and Wen2009a, Reference Li, Liu, Cheng, Xu, Ge and Wen2009b, Reference Li, Liu, Wan, Zhang, Wen and Liu2009d). Recently, the topics involved in the pulsed power technology, and nanosecond discharge is widely discussed both experimentally and theoretically (Ulrich, Reference Ulrich2012; Gilburd et al., Reference Gilburd, Efimov, Gefen, Gurovich, Bazalitski, Antonov and Krasik2012; Liu et al., Reference Liu, Zhang, Fan, Hong and Feng2012; Kovalchuk et al., Reference Kovalchuk, Zherlitsyn and Pedin2010; Chang et al., Reference Chang, Liu, Fang, Tang, Huang, Chen, Zhang, Liang, Zhu and Li2010). Our work is focused on the application of carbon fibers in pulsed electron beam sources, pulsed power accelerator and material surface modification (Li et al., Reference Li, Liu, Cheng, Xu, Ge and Wen2009b, Reference Li, Liu, Cheng, Xu, Wan, Chang and Wen2009c, Reference Li, Liu, Xu, Chen, Chang, Wan and Wen2009f). Particularly, the virtual cathode oscillator (vircator) is a typical HPM radiation source, due to its high power capability, simple construction, and frequency tenability (Alyokhin et al., Reference Alyokhin, Dubinov, Shamro, Shibalko, Stepanov and Vatrunin1994; Biswas, Reference Biswas2009; Filatov et al., Reference Filatov, Hramov, Bliokh, Koronovskii and Felsteiner2009). However, the major problem of the development of vircator is the several percent efficiency of bean-to-wave conversion (Jiang & Kristiansen, Reference Jiang and Kristiansen2001). In our previous work, it was found that the CsI coating of cathode surface can lengthen the pulse width of microwave radiation from a triode vircator, by lowering the diode closure under the addition of heavy ions (Li et al., Reference Li, Liu, Wen and Liu2009e). Also, the oscillation mode hopping in the vircator microwave pulse appeared with two frequencies, respectively, dominated by the oscillation of the virtual cathode in space and time and the reflexing of electrons between the cathode and the virtual cathode (Li et al., Reference Li, Liu, Cheng, Xu, Ge and Wen2009b). Additionally, the rising rate of beam current increased as the pulse shot preceded, which is accompanied by the decrease in microwave power, and the changes in the rising rate of beam current are closely related to the aging process of anode surface. In a word, the cathode and anode directly affect the operation of vircator (Li et al., Reference Li, Cheng, Zhang, Ji, Chang, Xu, Liu, Wen, Li and Wan2011).
Generally, many microprotrusions with a typical size of several tens of microns exit on the cathode surface, allowing a large electric field enhancement (Li et al., Reference Li, Liu and Wen2007; Shiffler et al., Reference Shiffler, Haworth, Cartwright, Umstattd, Ruebush, Heidger, Lacour, Golby, Sullivan, Duselis and Luginsland2008). Thus, the delay time for explosive emission and the threshold electric field are the key parameters of explosive emission cathodes. The plasma on the cathode surface expands toward the anode as plasma jets (Krasov et al., Reference Krasov, Krinberg, Paperny, Korobkin, Romanov, Rupasov and Shikanov2007; Roy et al., Reference Roy, Patel, Menon, Sharma, Chakravarthy and Patil2011, Reference Roy, Menon, Mitra, Kumar, Sharma, Nagesh, Mittal and Chakravarthy2009), and simultaneously develops across the cathode surface, consequently increasing the emitting area. It has been found experimentally that the cathode plasma exists as local plasma spots and can not cover the entire cathode surface (Saveliev et al., Reference Saveliev, Sibbett and Parkes2003; Krasik et al., Reference Krasik, Dunaevsky and Felsteiner2001a, Reference Krasik, Dunaevsky, Krokhmal, Felsteiner, Gunin, Pegel and Korovin2001b). The radial evolution process of cathode plasma involves the uniformity of cathode emission and the generation of electron beam. It has been suggested that the axial expansion of plasma spots is determined by the dynamics equilibrium between plasma saturation electron current and space-charge limited current (Krasik et al., Reference Krasik, Dunaevsky and Felsteiner2001a, Reference Krasik, Yarmolich, Gleizer, Vekselman, Hadas, Gurovich and Felsteiner2009). However, what mechanism of the radial expansion of cathode plasma is far from fully understood, necessitating the experimental and theoretical identifications. Therefore, the emitting area of explosive emission cathode will be discussed in this paper based on the current-voltage characteristics of diode. The beam current injected into the virtual cathode region unavoidably changes in the operation of vircator, which will disturb the microwave pulse (Kumar et al., Reference Kumar, Puri and Biswas2004; Davis et al., Reference Davis, Bartsch, Kwan, Sherwood and Stringfield1987; Kadish et al., Reference Kadish, Faehl and Snell1986). Therefore, the effect of cathode emitting area on the microwave pulse of vircator should be considered.
2. EXPERIMENTAL SETUP
The microwave experiments were conducted on a triode vircator powered by about 350 ns, about 400 kV pulsed generator using inductive energy accumulators. A schematic of the diode region is shown in Figure 1. The chamber of the triode represents a cylinder with a diameter of 35 cm and a length of 40 cm. The tested cathodes were based on carbon fiber. This cathode consisted of discrete needles. Further, the emitting surface of each cathode was planar, namely, the needles along the cathode have the same length. Here, carbon fiber tufts are 5 mm high, with a 1.5 mm diameter, and spaced by 9 mm. Each fiber tuft is composed of thousands of carbon fibers with 2.5 µm radius. A Fe-Ni-Cr alloy grid of 21 cm in diameter and transparency of 95% was used as an anode. The diode gap d ac was varied in the range of 10–70 mm. The vacuum vessel operated at (5–7) × 10−4 torr and was evacuated by a turbo pump with a pump rate of about 400 l/s. The diode voltage was monitored by a resistive divider and the beam current was registered with a Rogowski coil.

Fig. 1. (Color online) Experimental conFiguration of the S-band triode vircator under the action of about 350 ns, about 400 kV accelerating pulse. The diode gap can be adjusted by moving the shaft upon which the cathode is mounted.
Microwave signal from the vircator was monitored by a receiving horn in the main radiation lobe. The horn was positioned at the distance of 12 m from the radiation window. The main radiation lobe in the radiation region appeared at the axial direction because of TE11 mode operation. The microwave power generated from the vircator is approximately described by P out = 4πL 2P m/(D ES eff) (Li et al., Reference Li, Liu, Wen and Liu2009e). Here P m is the microwave power in the main radiation lobe, S eff is the effective area of receiving horns, and D E is the direction coefficient, D E = 2/∫−π/2π/2 (P θ/P m) sin θdθ, where P θ is the microwave power at direction angle θ with respect to the axial direction or main lobe. Two radiation receiving horns, having the same effective receiving area S eff = 65 cm2, were placed along a circle with the radius R = 12 m and the center being the radiation window. In the measurements, one of the receivers (reference receiver) remained at rest at the axis of the triode, while the second one was moved at ±15°, ±30°, ±45°, ±60°, ±75°, and ±90° with respect to the axial direction. Thus the output power can be calibrated by the above far-field region measurement because of L > 2D 2/λ, where the horn diameter D = 23 cm and the microwave length is λ = 1.13 cm. The microwave signal was transmitted through a coaxial attenuator, a crystal detector, and a coaxial cable to a Tek 3052B oscilloscope (sampling rate of 5 Gs/s). The microwave frequency was measured by a Tek 7254B oscilloscope (sampling rate of 20 Gs/s).
3. EXPERIMENTAL RESULTS AND ANALYSIS
3.1. Plasma Expansion into Vacuum
Figure 2 presents the typical waveforms of diode voltage φac and beam current I b at d ac = 19 mm. The maximum microwave power appears at d ac = 19 mm, because the optimization of microwave irradiation of vircator is closely related to the diode gap (Li et al., Reference Li, Liu, Cheng, Xu, Ge and Wen2009b). Thus, the experiments are focused on the case of d ac = 19 mm. In this case, the diode voltage φac = 400 kV and beam current I b = 9 kA can be obtained. For the cathode radius R c = 35 mm, the max beam current density is about 230 A/cm2.

Fig. 2. (Color online) Typical waveforms of the diode voltage φac, beam current I b.
Considering the central emission and edge effect of planar cathode, the perveance is given as  $P_T = \displaystyle{1 \over 8}\lpar 14.66 \times 10^{ - 6} \rpar \displaystyle{2{\rm \pi} r_c \over d_{ac} {\rm \alpha} ^2 } + 2.33 \times 10^{ - 6} \displaystyle{{{\rm \pi} r_c^2 } \over {\lpar d_{ac} - v_p t\rpar ^2 }} \lpar \hbox{A/V}^{3/2}\rpar $ (Li et al., Reference Li, Liu, Wan, Zhang, Wen and Liu2009d), where α = ln (d ac/v pt) − 0.4[ln (d ac/v pt)]2 + 0.0917[ln (d ac/v pt)]3, v p is the plasma expansion velocity or diode closure rate, d ac = 19 mm is the initial anode-cathode gap, and the effective diode separation, set equal to d ac = v pt. Here R = R 0 + v pt is the effective cathode radius, where R 0 corresponds to the initial emission area S 0 = πR 02. Namely, electron emission is initiated from the local surface, but not from the whole cathode surface. Thus the plasma expansion velocity can be determined by comparing the above theoretical model with the experimental data.
Figure 3 shows the diode impedance and perveance, compared with the theoretical prediction. When the value of P T is close to the experimental result, the plasma expansion velocity can be estimated to be 1.2 cm/μs. At t < 30 ns with respect to the beginning of the accelerating pulse, the diode perveance increased to 2 × 10⁻⁵ A/V3/2, and the impedance decreased to 70 Ω. Initially at the accelerating pulse, the increase of diode perveance is related to the startup of explosive emission cathode. The surface plasma produced by explosive emission extends across the cathode surface. This will lead to the rapid increase of the cathode emitting area, thus being the major factor of changes of diode perveance. At 30 ns < t < 100 ns, the diode perveance increased lightly from 2 × 10⁻⁵ A/V3/2 to 4 × 10⁻⁵ A/V3/2, and the diode impedance decreased from 70 Ω to 40 Ω. In this stage, the change of diode gap is the main contributor of the increase of diode perveance. At 100 ns < t < 250 ns, the diode perveance remained around 4 × 10⁻⁵ A/V3/2 and the diode perveance is about 40 Ω. It shows the diode is stable in this period. At t > 250 ns, the diode perveance grew again, and the diode impedance also stated to decrease. Further, at the end of the accelerating pulse, the experimental result of diode perveance exceeded the theoretical prediction. This shows the ion flows also participate in the process of beam current extraction. Thus, at the end of the accelerating pulse, the beam current is developed into the space-charge limited bipolar flow (Li et al., Reference Li, Liu, Cheng, Xu, Wan, Chang and Wen2009c).

Fig. 3. (Color online) Temporary behavior of diode impedance and perveance, compared with the theoretical prediction.
3.2. Delay Time of Explosive Emission
The explosive electron emission of microprotrusions on the cathode surface occurs within several nanoseconds, therefore, it can be deemed as an adiabatic process. Under this condition, the relation between the delay time of explosive emission τd and the current density of emitting centers j can be expressed as ∫0τdj 2dt = h = constant (Mesyats, Reference Mesyats2005). To estimate the current density of emitters, according to the “3/2” law, the current density can be shown as  $j = AE_m^2 /\sqrt {{\rm \varphi} _{ac}}$ (Miller, Reference Miller1982), where φac is the diode voltage, E m is the electric field of cathode surface and A = 2.33 × 10⁻⁶ A/V3/2.
According to the surface microstructure of carbon-fiber cathode, the carbon fiber is about 5 µm diameter cylinder, and the height is 5 mm on the cathode surface. The enhancement factor of electric field for cylinder emitters is β = h/r + 2 (Mesyats, Reference Mesyats2005). For carbon fiber, r = 2.5 µm and h = 5 mm, the enhancement factor for carbon fibers is β = 2000. The microscopic electric field of cathode surface is E m = βE av, where E av = φac/d ac is the average electric field in the diode gap (Parker et al., Reference Parker, Anderson and Duncan1974). At φac = 400 kV and d ac = 19 mm, the average electric field is E av = 2.1 × 10⁵ V/cm, and the microscopic electric field is E m = 4.2 × 10⁸ V/cm. Thus, the current density of carbon fiber emitters is j = 6.5 × 10⁸ A/cm2.
Initially, in the operation of explosive emission cathode, the emitting area of cathode S can be deemed to be constant. The time integration of I b2, where I b = jS is the beam current, may be stable in the initial period of the accelerating pulse. Figure 4 shows the time integration of I b2 for carbon fiber and stainless steel cathodes, ∫0τdI b2dt. Obviously, in the case of carbon fiber cathode, the value of ∫0τdI b2dt remains unchanged in the time interval, 1 − 2 ns with respect to the beginning of the accelerating pulse. Thus, the delay time of explosive electron emission of carbon fiber cathode is about 2 ns. This also indicates that the explosive electron emission of carbon fiber cathode occurs within several nanoseconds after the application of the accelerating pulse and cathode flare or plasma forms. At the current density of carbon fiber emitters j = 6.5 × 10⁸ A/cm2 and the delay time τ d ~ 2 ns, h ~ 1.0 × 10⁹ A2cm−4s can be obtained. In the case of stainless steel cathode, one can see that the delay time of explosive emission is about 4.5 ns.
Fig. 4. Time integration of I b2 for carbon fiber and stainless steel cathodes after the application of the accelerating pulse at d ac = 19 mm.
3.3. Threshold Electric Field
According to the delay time of explosive electron emission of carbon fiber cathode, the threshold electric field for electron emission can be estimated. Figure 5 gives the average electric field within the diode gap from the beginning of the accelerating pulse. Here, the results of carbon fiber and stainless steel cathodes are presented. In the case of carbon fiber cathode, it can be observed that within the delay time of explosive electron emission, t < 2.5 ns, the average electric field remained around 25 kV/cm, and then rapidly increased. Thus, the average electric field for explosive electron emission of carbon fiber cathode is about 25 kV/cm. This estimation method for delay time and threshold electric field can be applied in other material cathodes. Figure 5 also shows the result of stainless steel cathode. One can see that the threshold electric field and delay time for stainless steel cathode are, respectively, 40 kV/cm and 4.5 ns. This indicates the carbon fiber cathode can work faster than the stainless steel cathode.

Fig. 5. (Color online) Comparison of the evolution processes of average electric fields for carbon fiber and stainless steel cathodes at d ac = 19 mm.
3.4. The Emitting Areas at Different Beam Current Densities
Figure 6 presents the comparison of cathode emitting area at different current densities or diode gaps using carbon fiber cathode. At j b ≈ 180 A/cm2 (d ac = 30 mm), compared with the case of j b ≈ 230 A/cm2 (d ac = 20 mm), the emitting area exhibited a decrease, from about 25 cm2 to 20 cm2. This is mainly due to the possibility of a smaller amount of emitting centers under the relatively low electric field. Interestingly, the emitting area showed a drop process after its maximum value. At j b ≈ 230 A/cm2, the emitting area for carbon fiber cathode decreased significantly by 32% within about 100 ns. Most notably, the emitting area can recover up to the maximum value. However, at a shorter gap (d ac = 10 mm, j b ≈ 310 A/cm2), in the case using the carbon fiber cathode, the emitting area rapidly reached its maximum value, which was accompanied by a decrease process until t = 50 ns. Next, a recovering process with multi peaks occurred, and then the emitting area developed into a relatively stable stage. As a whole, in each case for carbon fiber cathode, the evolution of the emitting area is characterized by two subsequent processes.

Fig. 6. (Color online) Evolution process of the emitting areas of carbon fiber cathode at different diode gaps (10 mm, 20 mm, and 30 mm).
Here the changing process of cathode emitting area at different stages is analyzed. At t < t 1, or before the emitting area reaches its maximum value at first, the explosive emission cathode is still in setup status. On the cathode surface, the microexplosion initiates the generation of plasma, and the increase of emitting area is attributed to the expansion of cathode plasma. Most importantly, at t 1 < t < t 2, at d ac = 10 mm the emitting area decreased at first and increased latter, however, at d ac = 30 mm the emitting area can keep increasing. Generally, the cathode plasma spots after surface microexplosion merge into one plasma layer covering a large proportion of the cathode surface. That is, once the emitting area reach its maximum value, the emitting area will remain unchanged, which is inconsistent with the results in Figure 6. It can be inferred that the decrease of emitting area after its maximum value is closely related to the disappearance of initial emitting centers on the cathode surface. The cathode surface microprotrusions explode for a short time, and then disappear due to the cooling of emitting centers. Prior to the microexplosion, the current density is at the level of 108 A/cm2, and such a high current density can lead to the rapid heating and explosion of microbulks on the cathode surface, which is accompanied by the thermal electron emission. As the microexplosion develops, the emitting regions extend, heat releases and loses due to the sputtering of plasma and heated cathode material vapor. These processes can lower the temperature and current density of cathode spot regions, and reduce the Joule heating efficiency, thus quicken the cooling of cathode spots. Subsequently, as the erosion and emission regions develop, the current density decreases, the heat release reduce, and the surface temperature drops, and finally the emitting centers disappeared. The disappearance of initial emitting centers or plasma spots is an inherent and spontaneous process. This process shows a self-quenching behavior of plasma spots, which is responsible for the decrease of emitting area of carbon fiber cathode. At t 1 < t < t 2, the recovery of emitting area can be attributed to the formation of new plasma spots. In Figure 6, at d ac = 30 mm, the emitting area keep increasing at t 1 < t < t 2, and this is because the formation of new plasma spots inhibits the decrease of emitting area due to the self-quenching of initial plasma spots. In fact, at t 1 < t < t 2 the changes of cathode emitting area shows the disappearance of some cathode spot units and the appearance of some units. At t > t 2 the changes of emitting area are possibly the reduplication of the stage t 1 < t < t 2.
Beam electrons, in fact, are emitted from the surface of the cathode plasma produced by applying a strong electric field. The perveance of a diode with an explosive cathode is determined to a considerable extent by the axial expansion velocity of the cathode plasma extending across the anode-cathode gap. Indeed, this velocity demonstrates the axial behavior of the luminous boundary of cathode plasma. Since the cathode surface plasma is the dominant electron source, the time-variation ratio of effective emitting radius represents indirectly the radial velocity of cathode plasma expansion, namely, dR/dt = N 1/2V r, where R is the effective cathode emitting radius, N is the number of plasma spots, and V r is the radial expansion velocity of individual plasma spots. To further understand the evolution process of emitting area, the temporal behavior of dR/dt at j b ≈ 230 A/cm2 is presented in Figure 7. In Figure 7, the value of dR/dt had a large initial value, which is related to the cathode turn-on. Subsequently, the amplitude of dR/dt gradually tended to be stable as the pulse proceeded.

Fig. 7. (Color online) Time-variation ratio of effective emitting radius as the accelerating pulse proceeds at d ac = 19 mm, j b ≈ 230 A/cm2. The inset is the process within 100 ns.
3.5. Screening Effect
Assuming a semispherical plasma emitting electrons on the cathode surface, the force difference produced by electric field between the cathode and anode equals to the momentum of electron beam in unit time on the anode, namely  $\displaystyle{1 \over {8{\rm \pi} }}\left(\int\limits_{S_a} E_a^2 dS - \int\limits_{S_K} E_K^2 dS \right)= \displaystyle{{mc} \over e}i\lpar {{\rm \gamma}^2 - 1} \rpar ^{1/2}$ where E a and E k is, respectively, the electric field on the anode and cathode, c is light velocity, γ = 1 + eφac/(mc 2) is relativistic factor, i is the current of cathode plasma spots (Mesyats, Reference Mesyats2000). This equation is integrated across the electrode surfaces, where S a is the anode surface area, and S k is the cathode surface area. Assuming the bulk charges reduce the electric field to be zero on a radius r s area of cathode surface, and the anode electric field is E a = φac/d ac, we can obtain the screening radius of cathode plasma, r s = [8m ecd ac2i(γ2 − 1)1/2/eφac2]1/2. In the non-relativistic case, r s ≈ 500φac−3/4i 1/2d ac (cm) where φac, i, d ac, respectively, is in V, A, and cm (Mesyats, Reference Mesyats2000).
The radius of carbon fibers as the microprotrusions of cathode surface is 5 µm and the maximum current density of emitting centers 6.5 × 10⁸A/cm2. Assuming the carbon fiber is deemed as the initial explosive emission centers, the current for individual emitting center is 128 A. At d ac = 19 mm and I b = 9 kA, about 70 initial emitting centers appeared on the cathode surface. At φac = 400 kV, i = 128 A and d ac = 19 mm, the screening radius of cathode spots is about 0.67 cm. In fact, the interval between the carbon fiber tufts is 0.9 cm, and there are 72 fiber tufts on the cathode surface, showing almost all of the fiber tufts participate in the explosive emission process. Figure 7 presents the variation ratio of cathode effective emitting radius. At t > 100 ns, the variation ratio of effective radius is in the range of <10 cm/μs. For 70 initial emitting centers on the cathode surface, the radial expansion velocity of individual plasma spots is V r < 1.2 cm/μs, according to dR/dt = N 1/2V r where N = 70. Thus, the radial expansion velocity of emitting center basically equals to the axial expansion velocity. It suggests the spherical expansion of cathode plasma spots. Additionally, at different diode gaps, the number of emitting centers and screening radius are calculated, as shown in Figure 8. One can see from Figure 8 that as the diode gap increases, the number of emitting centers decreases, and the screening radius grows.

Fig. 8. Emitting center number, screening radius and diode voltage versus diode gap.
In Figure 6, at d ac = 10 mm, at t 1 < t < t 2 the cathode emitting area remarkably decreases. However, at d ac = 30 mm, at t 1 < t < t 2 the cathode emitting area throughout increases. For smaller diode gaps, the cathode emitting centers with a larger number appeared on the cathode surface (see Fig. 8), and the interval between them is relatively shorter due to the limitation of cathode geometrical area. Thus, the screening effect is remarkable. This restrains the generation of new explosive emitting centers, and the self-quenching of emitting centers occurred, these two factors leads to the large decrease of cathode emitting area. As the number of emitting centers decreases, the interval between emitting centers increases and the screening effect will weaken, even can be neglected, thus the increase of emitting area renews. In the case of larger diode gaps (Fig. 6), there are fewer initial emitting centers, and the interval between them is larger. Under the condition of scattered emitting centers, the screening effect can be neglected, and the cathode plasma spots develop independently. Even if the self-quenching of emitting centers exists, the new explosive emission centers continually form and the increase of cathode emitting area can be kept. As the number of emitting centers increases, the screening effect can inhibit the generation of new explosive emission centers, thus the cathode emitting area decreases at t > t 2. As a whole, three factors, namely, the generation and self-quenching of emitting centers and the screening effect, lead to the repeated increase and decrease of cathode emitting area.
3.6. Lifetime of Cathode Plasma Spots
Since the emitting centers determines the cathode emitting area and the extraction of electron beams, the lifetime of emitting centers should be considered. The lifetime of emitting centers τc can be expressed as  ${\rm \tau}_c = \displaystyle{i^2 \over 64{\rm \pi}^2 a^2 \bar h}$, where i is the current of emitting centers, a = λ/ρc is a coefficient, ρ is the density, c is the specific heat, λ is the heat conduction coefficient (Mesyats, Reference Mesyats2000). The density of carbon fiber ρ is 1.76 g/cm3, the specific heat of carbon fiber c is (0.72–0.79) J/(gK), the heat conduction coefficient λ is (30–75) W/(mK), and the maximum value of a is 0.63 cm2/s, and h ~ 1.0 × 10⁹ A2cm−4s. The average current density of emitting centers is 6.5 × 10⁸ A/cm2, and thus the current of each emitting centers is about i ~ 128 A. According to the above equation, the average lifetime of emitting centers is about τ c ~ 60 ns.
The lifetime of emitting centers is limited to be several tens of nanoseconds. The delay time of the generation of new emitting centers is several nanoseconds. Thus, the generation of emitting centers can overcome obviously the self-quenching of emitting centers. This leads to the increase of cathode emitting area. As the emitting area increases, the distance between emitting centers decreases and the screening effect of space charges strengthens. The quenching of emitting centers due to the screening effect quickens and accordingly the cathode emitting area decreases.
3.7. Cathode plasma density
When the cathode plasma stably develops within the diode gap, the plasma saturation current j s = 0.25n0e veth equals to the space-charge limited current j sc = (4ɛ0/9)(2em e)1/2 φac3/2(d ac − v pt)−2 (Krasik et al., Reference Krasik, Dunaevsky and Felsteiner2001a). Based on the above relation, the average cathode plasma density can be estimated. It has been found by experimental measurements that, the average motion velocity of carbon ions is (1.0–1.5) × 106 cm/s (Davis & Miller, Reference Davis and Miller1969). At the thermal velocity  $\bar v_{eth} = 6.8 \times 10^5 \sqrt {T_e } \,\hbox{cm/s}$ (Yarmolich et al., Reference Yarmolich, Vekselman, Gurovich, Gleizer, Felsteiner and Krasik2008) and the cathode plasma temperature for explosive electron emission T e < 10 eV, (Mesyats & Proskurovsky, Reference Mesyats and Proskurovsky1989) the thermal velocity of ions veth ~106 cm/s can be estimated, at the same level to the axial expansion velocity of cathode plasma. In Figure 9, curve A and curve B shows the evolution process of current density using carbon fiber cathode after the application of accelerating pulse at different background pressures. In Figure 9, one can see from curve B that at 80 ns < t < 200 ns with respect to the beginning of accelerating pulse, the current density is in the range of 200–230 A/cm2. Further, it can be found from curve C that the current density of stainless steel cathode is around 150 A/cm2 at 80 ns < t < 200 ns. According to the plasma saturation current density j s = 0.25n0e veth, the average plasma densities for carbon fiber and stainless steel cathodes are, respectively, about 5 × 1015 cm−3 and 1.5 × 1015 cm−3. At Debye radius r D ~ 700(T e/n)1/2 cm (Yarmolich et al., Reference Yarmolich, Vekselman, Gurovich, Gleizer, Felsteiner and Krasik2008) and plasma temperature <10 eV, the Debye radius of plasma for carbon fiber cathode r D < 3 × 10⁻⁵ cm can be obtained, about 10 times smaller than the radius carbon fiber.

Fig. 9. (Color online) Curve A is the current density of carbon fiber cathode at d ac = 19 mm and background pressure of 7 × 10⁻⁴ torr, curve B is the current density of carbon fiber cathode at d ac = 19 mm and background pressure of 5 × 10⁻⁴ torr, and curve C is the current density of stainless steel cathode at d ac = 19 mm and background pressure of 5 × 10⁻⁴ torr.
However, at lower background pressures, for the curve B of Figure 9, the current density is stable in the operation of virtual cathode oscillator. The stability of injected current density in the virtual cathode region is a main factor determining the stability of microwave pulse of vircator (Alyokhin et al., Reference Alyokhin, Dubinov, Shamro, Shibalko, Stepanov and Vatrunin1994). Therefore, any changes in the beam current density may directly affect the operation of vircator.
3.8. Effects of Emitting Area on the Microwave Pulse
The emitting area of explosive emission cathodes has a temporary behavior, due to the radial development of explosive emitting centers or surface plasma spots. Figure 10 presents the cathode emitting area and microwave pulse of vircator at different background pressures. Further, the emitting area on the cathode surface can be calculated as  $S\lpar t\rpar = \displaystyle{I_b r_c^2 \lpar d_{ac} - V_p t\rpar ^2 \over 2.33 \times 10^{ - 6} {\rm \varphi} _{ac}^{3/2} \lpar r_c + V_p t\rpar ^2 }$. The initial emitting area, namely, at t = 0 ns with the respect to the beginning of the accelerating pulse, was in the range of 5–7 cm2. In Figure 10a, at the period of microwave irradiation, namely, 20 ns < t < 220 ns, there are two peaks in the emitting area and microwave pulse. In Figure 10b, the emitting area increase to 27 cm2, but it decreased to 20 cm2 in about 10 ns interval. In this case, the microwave emission appeared relatively later compared with the result of Figure 10a. This may be due to the decrease of the emitting area. In Figure 10b, one peak appeared in the emitting area and the microwave pulse, at 50 ns < t < 180 ns. Further, a longer microwave pulse appeared in the case of low background pressure. In both cases, the microwave peak power remained around 300 MW. In a word, at the period of microwave irradiation, the temporary behavior of the emitting area is similar to the microwave pulse of vircator. Additionally, the background pressure can affect significantly the pulse width of microwave radiation from vircator, or the lifetime of virtual cathode.

Fig. 10. (Color online) Waveforms of cathode emitting area and microwave pulse at different background pressures: (a) 5 × 10⁻⁴ torr, (b) 7 × 10⁻⁴ torr.
From Figures 9 and 10, one can see that the trend of the changes of current density is also similar to the microwave pulse, regardless of the background pressures. Under the low background pressures, there exist relatively stable current density and plasma density in the operation of vircator. This may be due to the week disturbance of background gases, namely, less background gases form plasma. Thus, a longer microwave pulse appeared under the low background pressures. In other words, the stability of current density depends on the changes of emitting area of explosive emission cathode. Therefore, in the operation of vircator, the emitting area of explosive emission cathode remains unchanged or little changed, and a long pulse microwave irradiation forms. However, even if the emitting area lightly changed, the disturbance could be introduced in the microwave pulse.
3.9. Lifetime of Virtual Cathode
The microwave generation process of Vircator depends on the lifetime of virtual cathode. The lifetime of virtual cathode is expressed as  ${\rm \tau}_{vc} = \displaystyle{{\rm \alpha} \over {1.5p}}\lpar {1 - I_{\lim } /I_{inj} }\rpar$ (Malyshev & Rybas, Reference Malyshev and Rybas1964), where p is the pressure of vacuum cavity, I inj is the injection current of virtual cathode, I lim is the limiting current of drift region, and α is a coefficient determined by the gas composition. For the solid electron beams, the space-charge limiting current of drift region can be described as
  $I_{\lim } = \displaystyle{17.1\lpar {\rm \gamma}_0 ^{2/3} - 1\rpar ^{3/2} \over 1 + 2\ln \lpar {R/r_b } \rpar} \hbox{\lpar kA\rpar }$, (Benford et al., Reference Benford, Swegle and Schamiloglu2007), where R is the radius of drift tube, r b is the radius of injected electron beam, γ0 is relativistic factor. At R = 18 cm, r b = 2.6 cm, and γ0 = 1 + eφac/m ec 2 = 1.782, the space-charge limited current in the drift region can be calculated to be I lim = 1.13 kA. In the region of virtual cathode, the injection current is I inj ~ I bη, where η = 95% is the transmissivity of anode grid. When the virtual cathode forms, the beam current is I b ~ 4 kA, and thus the injection current in the virtual cathode region is I inj ~ 3.8 kA. It suggests that the injection current exceeds the space-charge limiting current in the virtual cathode region, providing the requisite conditions for the microwave generation of vircator. Aτ α = 2 × 10⁻¹⁰ Torr × s and the background pressure p = (5–7) × 10−4 Torr, the 200–280 ns microwave irradiation can be obtained, agreeing well with the experimental observations. Additionally, from both experimental observations (Fig. 10) and theoretical prediction, one can see that the pulse width of microwave irradiation is inversely proportional to the background pressures.
3.10. Interaction of Current Cell
The explosive emission of cold cathode generates the discrete plasma spots, and cathode plasma is the actual source of pulsed electron beams. This determines the structure of current cell, forming the beamlets of pulsed electron beams. It is very hard to obtain the uniform electron beam, due to the discrete distribution of emitting centers on the cathode surface. These beamlets interact and affect the generation of uniform pulsed electron beams.
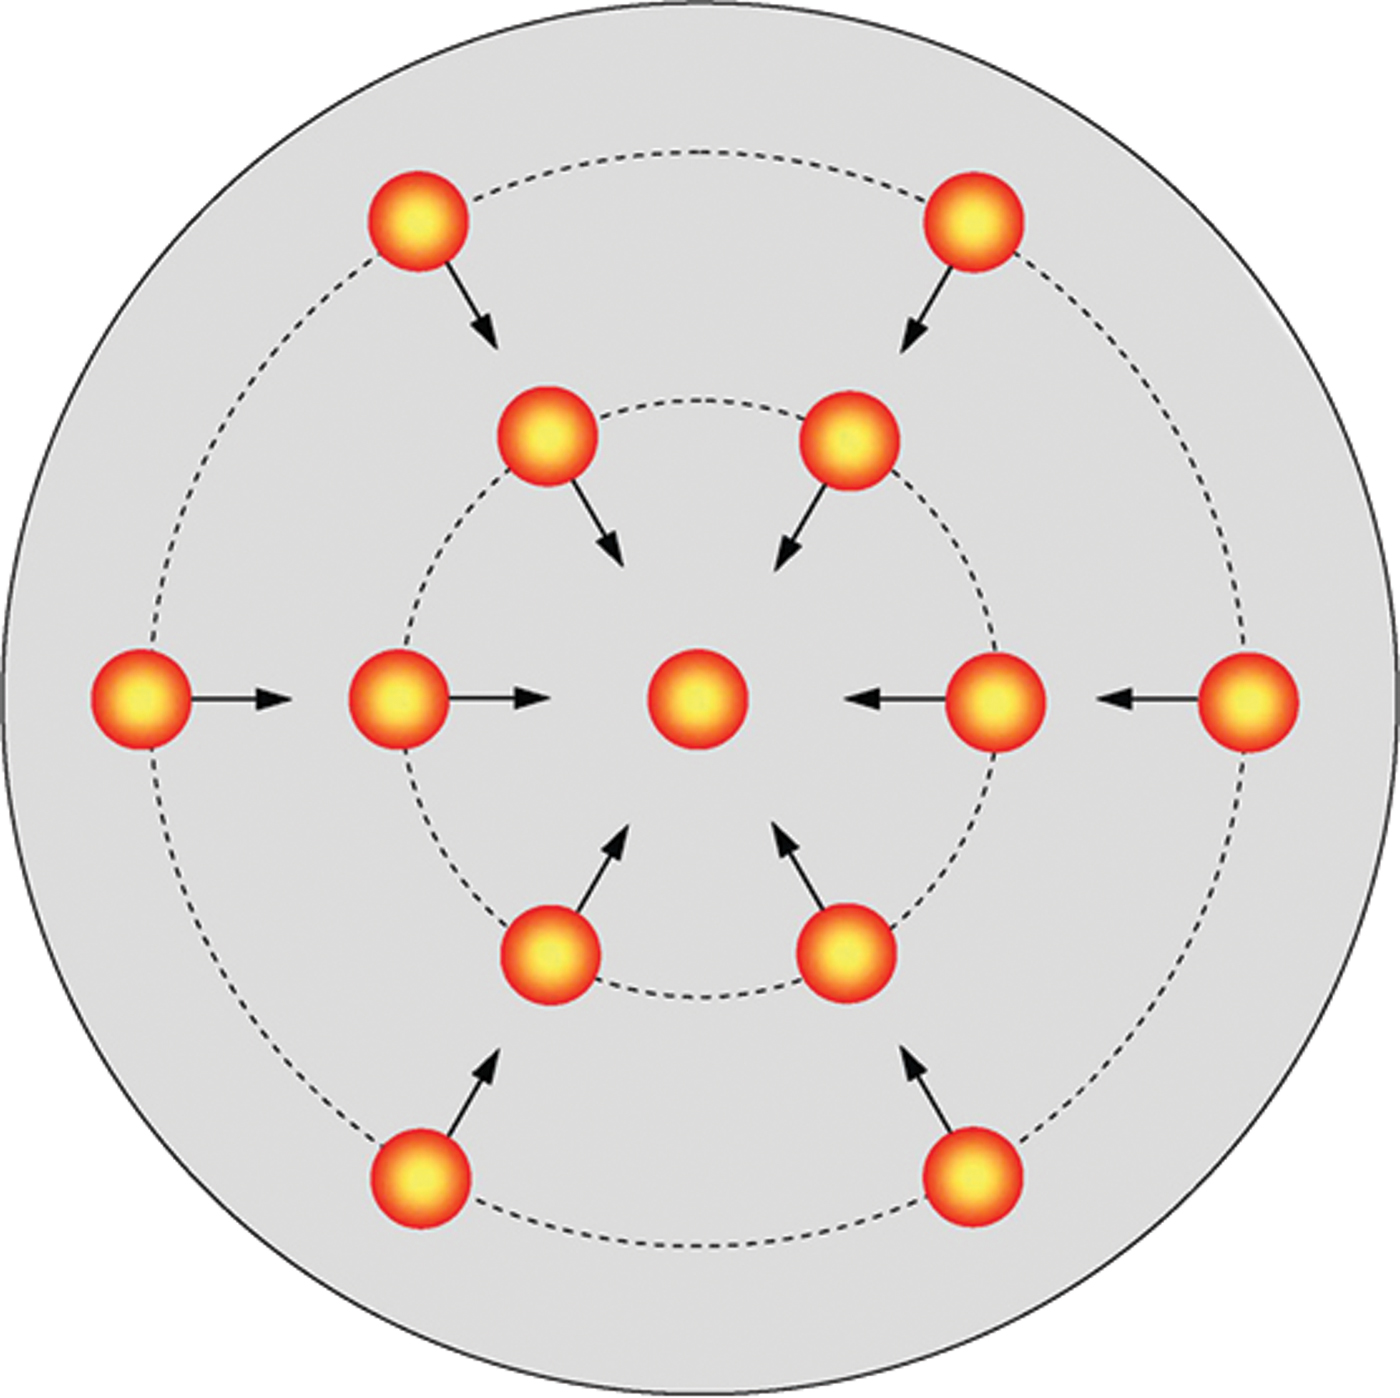
It can be supposed that the beamlets emitted from the cathode surface is deemed as current cells, and each current cell is subjected to the action of Lorentz force induced by these current cells. The direction of these Lorentz forces is mutually attracted towards the center, as shown in Figure 11. The jet equation, under the radial equilibrium, can be described as
 $$\displaystyle{dP \over dr} + j_z \cdot B_{\rm \varphi} = 0$$
where P is the pressure of plasma jets, j z is the axial current density, B φ is the self-magnetic field of beamlets in tangential direction, j zB φ is the Lorentz force.

Fig. 11. (Color online) The interaction of current cells located at the discrete plasma spots.
The cathode jets are symmetrical, the magnetic field and currents can be described Ampere law. Thus we can obtain
 $$B_{\rm \varphi} = \displaystyle{{{\rm \mu} _0 } \over r}\int_0^r {\,j_z } r^{\prime} dr^{\prime}$$
and then,
 $$dP + {\rm \mu} _0 \displaystyle{{\,j_z \over r}}\int_0^r {\,j_z } r^{\prime} dr^{\prime} = 0$$
namely,
 $$dP = - {\rm \mu}_0 \left(j_z \int_0^r \,j_z r^{\prime} dr^{\prime} /r \right)dr$$
The above equation can be integrated from the edge of jets to the internal, and the surrounding pressure of jets is P 0, and then
 $$P\lpar r\rpar - P_0 = - {\rm \mu} _0 \int_{r_0 }^r {\displaystyle{\,j_z \over r^{\prime\prime}}} \left(\int_0^{r^\prime} {\,j_z } r^{\prime} dr^{\prime} \right)dr^{\prime\prime}$$
namely,
 $$\Delta P\lpar r\rpar = {\rm \mu} _0 \int_{r_0 }^r {\displaystyle{\,j_z \over r^{\prime\prime}}} \left(\int_0^{r^\prime} {\,j_z } r^{\prime} dr^{\prime} \right)dr^{\prime\prime}$$
where ΔP(r) = P(r) – P 0 shows the pressure increase of self-magnetic field at r. The above equation is the relation between the one-dimensional jet magnetic pressure and beam density. Here it is supposed that the current density of cathode jets is constant, namely,
 $$\,j_z = \displaystyle{i \over {{\rm \pi} r_0^2 }} = \hbox{const}$$
The equation can be simplified as
 $$\Delta P\lpar r\rpar = \displaystyle{{\rm \mu}_0 \over 4{\rm \pi} }\displaystyle{i^2 \over {\rm \pi} r_o^2 }\left({1 - \displaystyle{r^2 \over r_0^2 }} \right)$$
One can see that the self-magnetic pressure is proportional to the square of jet current, and is inversely proportional to the square of jet radius. At i = 128 A and r 0 = 1 mm, the additional pressure at the jet centers can be calculated to be ΔP(0) = 521.7 Pa ≈ 4 mmHg. This value is relatively lower compared to the internal pressure of cathode plasma jets (1010 Pa). It follows that for the cathode plasma jets with larger sizes; the additional self-magnetic pressure can be neglected and does not affect the property of cathode plasma jets. When the cathode plasma jets have a small size, the additional pressure will become very high. For 0.1 µm cathode plasma jets, the additional pressure can reach 1010 Pa, and thus its effects on the jets cannot be neglected.
4. CONCLUSIONS
Explosive emission cathode plays an important role in the operation of vircator, because it directly affects the extraction of high-current electron beams, emission uniformity, emitting area, plasma formation. Currently, carbon fiber cathode is still the prior candidate for HPM sources, especially vircators. The property of explosive emission of carbon fiber cathode should be considered in the operation of vircator. In this paper, using carbon fiber cathode in the reflex triode vircator, it was found that the axial expansion velocity is 1.2 cm/μs, the delay time of explosive emission is 2 ns, and the threshold electric field is about 25 kV/cm. By the two cathodes, carbon fiber and stainless steel cathodes, the carbon fiber cathode can work faster, and this will provide a new prospect for the development of pulsed power accelerator.
In the operation of vircator, it was found that the temporary behavior of cathode emitting area is similar to the microwave pulse of vircator at different background pressures. The changes of emitting area at different diode gaps are investigated and the variation ratio of effective emitting radius is also presented. The emitting area at different diode gaps reached its peak value in different ways. Indeed, at moderate current density, the emitting area increased throughout up to its peak value, but at higher current density, the emitting area increased in the form of fluctuation. Further, the variation ratio of effective emitting radius is in the range of <10 cm/μs in the stable stage of diode operation. The screening effect of cathode plasma is considered and the screening radius for carbon fiber cathode is calculated to be 0.67 cm at 230 A/cm2 current density. The radial expansion velocity of individual emitting centers is estimated to be 1.2 cm/μs, suggesting the spherical expansion of cathode plasma spots. Most importantly, there exits the self-quenching behavior of explosive emission centers, due to the process of energy or material release and cooling. For explosive emission cathodes, three factors, namely, the generation and the self-quenching of emitting centers, and screening effect, determine the increase and decrease of cathode emitting area. At j = 230 A/cm2, the lifetime of cathode emitting centers is calculated to be about 60 ns, the plasma density of carbon fiber cathode was estimated to be 5 × 1015 cm−3, and the Debye radius was <3 × 10⁻⁵ cm−3. Moreover, the relative stable current density did not appear under the higher background pressure. The lifetime of virtual cathode was discussed and the back ground pressure affects obviously the microwave pulse, both theoretically and experimentally.
On the cathode surface, the electron beam sources are discrete plasma spots or emitting centers, rather than a plasma layer covering the entire cathode surface. The generation, development and quenching of these emitting centers directly affect the changes of emitting area. This involves the delay time for explosive emission of cathode micro protrusions, the axial and radial expansion of plasma spot, and the lifetime of emitting centers. The changes of emitting area affects the stability of beam current injected into the virtual cathode region, further leading to the fluctuation of microwave pulse of vircator. Therefore, to further improve the microwave pulse of vircator, the stable emitting area of explosive emission cathode is necessary.
ACKNOWLEDGEMENTS
We would like to thank Dr. S. Guo, Dr. X. Wang, Dr. P. Yan, and Dr. W. Wang for suggestions and discussions.