INTRODUCTION
Human activities such as overgrazing and deforestation can reduce the soil carbon (C) pool, leading to decreased soil productivity (Janzen Reference Janzen2004). Bouwman (Reference Bouwman and Bouwman1990) pointed out that in almost all cases cultivation reduces soil organic carbon (SOC) content compared with natural ecosystems. About 25–40% of SOC is usually lost when forest soil is cultivated (Davidson & Ackerman Reference Davidson and Ackerman1993). Cultivation of grassland soil typically reduces SOC by 30–50% (Aguilar et al. Reference Aguilar, Kelly and Heil1988). Agricultural production has increased in many arid areas during the past 50 years. However, there are relatively few studies about the effects of cultivation on SOC in arid areas.
Approximately 60–75% of C lost through soil degradation can be re-sequestered by ecological restoration (Lai Reference Lai1999; Takata et al. Reference Takata, Funakawa, Yanai, Mishima, Akshalov, Ishida and Kosaki2008). For example, the SOC pool in a forest soil was found to reach 76% of its original amount after 26 years of natural forest regeneration (Wu et al. Reference Wu, Li and Zeng1998). In some cases, conversion of wasteland to cropland may increase SOC. For example, SOC concentrations were 35% greater after 3 years of rice cultivation on waste grassland (Li & Yang Reference Li and Yang2009). In an arid area, Xu et al. (Reference Xu, Tang and Sheng2010) reported that SOC concentrations had risen 286% after 5 years of cotton production on a soil with low fertility.
Soil aggregates are organic–inorganic complexes and the basic unit of soil structure (Mikha & Rice Reference Mikha and Rice2004). Soil organic C is closely related to aggregate formation (Zhang et al. Reference Zhang, He, Chen, Huang and Wilson1996; Blanco-Canqui & Lal Reference Blanco-Canqui and Lal2004; Zinn et al. Reference Zinn, Lal, Bigham and Resck2007). The number, size and distribution of aggregates are affected by SOC (Tisdall & Oades Reference Tisdall and Oades1982; Eynard et al. Reference Eynard, Schumacher, Lindstrom and Malo2005). An increase in SOC content promotes the formation and stability of soil structure (Six et al. Reference Six, Elliott and Paustian2000a , Reference Six, Elliot and Paustian b ). Aggregate formation provides physical protection of SOC against decomposition (Lützow et al. Reference Lützow, Kögel-Knabner, Ekschmitt, Flessa, Guggenberger, Matzner and Marschner2007; Pan et al. Reference Pan, Zhou, Li and Zhang2007). Aggregate-associated SOC is sensitive to soil management practices (Angers et al. Reference Angers, Recous and Aita1997). For example, DeGryze et al. (Reference DeGryze, Six, Paustian, Morris, Paul and Merckx2004) reported that surface soil structure returned to its natural condition after farmland was abandoned. Information about aggregate-associated SOC in arid areas would increase understanding about the effects of different soil types and management practices on C sequestration (Gulde et al. Reference Gulde, Chung, Amelung, Chang and Six2008).
The Manasi River Basin in the Xinjiang Uyghur Autonomous Region is the fourth largest irrigated agricultural area in China. The amount of cultivated land in the basin increased from 156 km2 in 1949 to 6221 km2 in 2010. It is important to protect the quality of agricultural soil in this basin. In the past, flood irrigation practices destroyed the water–salt balance in many areas of Xinjiang and intense evaporation caused secondary salinization. Large areas of farmland were deserted due to declining productivity, which contributed to serious ecological problems (Eynard et al. Reference Eynard, Schumacher, Lindstrom and Malo2005; Fan et al. Reference Fan, Pan, Li, Chen and Zhang2008).
The introduction of a farming system that combines drip irrigation with plastic film mulch in 2000 made it possible to reclaim abandoned salinized farmland for crop production in many areas of Xinjiang. Although SOC content is very low in this region, no definite conclusion has been reached as to whether SOC is gained or lost after reclamation of abandoned, salinized farmland. Saline-alkali soils are widely distributed and their potential for C sequestration should not be ignored (Xie et al. Reference Xie, Li and Zhai2009). The present work investigated whether the soil C pool would increase or decrease if salinized farmland was reclaimed after many years of abandonment, how these changes would occur across time and whether the reclamation of saline alkali soils in arid areas could increase C sequestration. The objectives of the current study were to: (1) identify changes in soil C following the reclamation of abandoned, salinized farmland, and (2) monitor temporal changes in both aggregate stability and aggregate-associated SOC concentrations during reclamation. The results are important both for understanding changes in soil quality after reclamation of salinized farmland and for identifying management strategies that are conducive for sustainable agricultural development.
MATERIALS AND METHODS
Description of the study area
The Manasi River Basin is located at the centre of Eurasia, along the southern edge of the Junggar Basin (44°33′N, 85°37′E, 400 m a.s.l) (Fig. 1). This area has an arid, continental climate. Meteorological data records were collected for the 50 years from 1956 to 2006. The average annual values for frost-free period, precipitation and evaporation are 169 days, 153 and 2005 mm, respectively.

Fig. 1. Sketch map of the Manasi River Valley and the study region.
The experimental site is in the middle reaches of the Manasi River Basin. Excess flood irrigation in the 1970s and 1980s caused the water table to rise near the soil surface in the region and since the salt content of the shallow groundwater was high, evaporation led to salt accumulation at the soil surface. Therefore, a large area of salinized land developed in the basin over time. More than a quarter of the farmland in the Manasi River Basin was abandoned because of salinization.
Experimental site
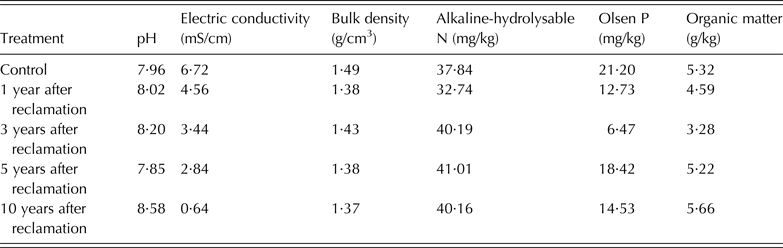
The experimental site was a 105 ha area in the Shihutan Township. The site had been farmed, but then it was abandoned for more than 27 years because of soil salinization. The land has been reclaimed for cotton production with drip irrigation and plastic film mulch at different times during the past 10 years (Fig. 2). The experiment consisted of five treatments: (1) original abandoned farmland (control, 5 ha); (2) 1 year of cotton production (20 ha); (3) 3 years of cotton production (30 ha); (4) 5 years of cotton production (20 ha); and (5) 10 years of cotton production (30 ha). The management practices were the same in all the cotton fields: cotton was planted at the end of April each year and the plant density was 2·4 × 104 plants/ha. The fields were drip-irrigated 8–10 times each growing season. Nitrogen (N) and phosphorus (P) fertilizers were applied via drip-irrigation (300 kg N/ha and 200 kg P/ha). The total irrigation amount was 4500 m3/ha/year. Calcium superphosphate (450 kg/ha) was applied before planting. Cotton gin screenings (2250 kg/ha) and cotton residue (6000–7500 kg/ha) were returned to the soil each autumn. Selected physical and chemical properties of the soil in the 0–20 layer are shown in Table 1. Soil pH tended to increase as reclamation time increased, whereas soil electrical conductivity decreased. Bulk density 1, 5 and 10 years after reclamation was 8% less than in abandoned farmland, whereas bulk density 3 years after reclamation was 12% greater than in abandoned farmland. Alkaline-hydrolysable nitrogen (N) concentrations generally increased after reclamation, except for 1 year after reclamation. Olsen phosphorus (P) concentration was less in the reclaimed farmland than in the abandoned field. Soil organic matter (OM) decreased during the first 3 years since reclamation and then increased after 5 and 10 years (Table 1).
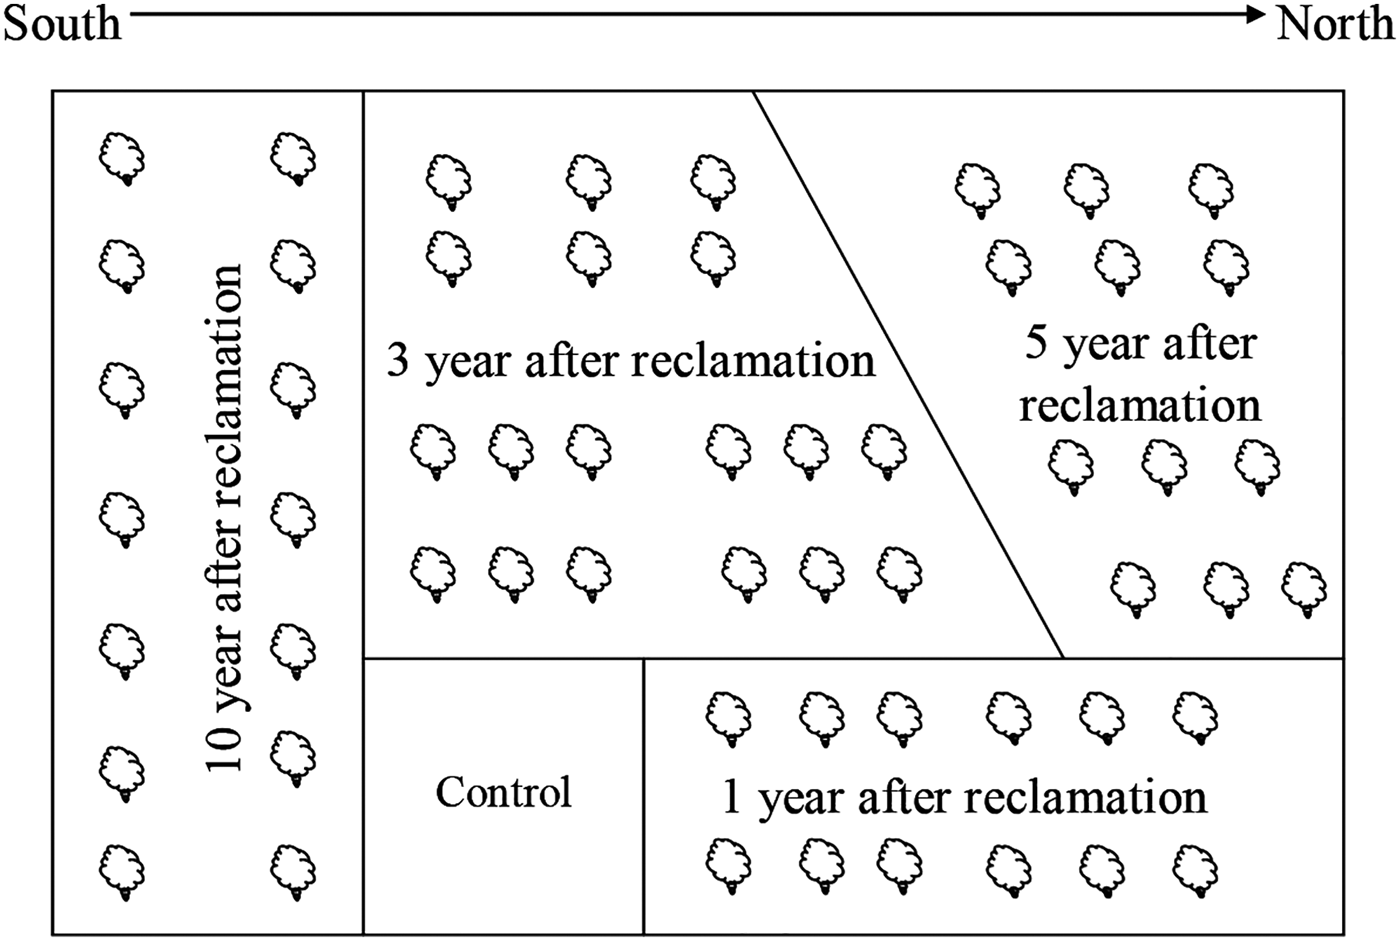
Fig. 2. A sketch map of the experiment site in the Shihutan Township. Control: original abandoned farmland.
Table 1. Selected physical and chemical properties of the soil after abandoned, salinized farmland was reclaimed for cotton production

Note: Control is original abandoned farmland
The soil at the site is classified as grey desert soil according to the local classification (Gong et al. Reference Gong, Lei and Chen1988) and as Yermosol by the FAO–UNESCO system (Fan et al. Reference Fan, Pan, Li, Chen and Zhang1974). A soil survey done by the local Soil and Fertilizer Station in 2000 showed no significant spatial variation in the distribution of soil salinity and soil OM in the reclamation area. Vegetation on the abandoned farmland is sparse, mainly consisting of Suaeda glauca Bunge, Kalidium foliatum and Salsola collina Pall. The vegetation was uniformly distributed across the landscape and grazing was prohibited in the area. Due to the nature of the present study, there were no true replications of the different reclamation times. However, considering the uniformity of the soil, vegetation and climate conditions, it was assumed that there were no inherent differences among the five field sites at the beginning of the study.
Soil sample collection
Soil samples in the 0–20 cm depth were collected at the end of 2011. Selected physical and chemical properties were tested as the background value (Table 1). Soil sampling was carried out from the five treatments. To represent each conversion time, five core samples were taken randomly from each treatment site. Soil cores were thoroughly mixed to generate a composite sample for each area to generate total of three replicates.
Soil samples in the 0–60 depth were collected in April (spring), August (summer) and October (autumn) in 2012. The samples were collected by digging five pits (30 cm wide × 100 cm deep) in each treatment area. The pits were located in an S-shaped pattern across the entire area of each treatment. Undisturbed soil samples were removed from the 0–5, 5–10, 10–20, 20–40 and 40–60 cm depths of each pit using a flat spatula. The samples were taken immediately to the lab where they were combined to form one composite sample (c. 1 kg) per depth per treatment. These composite samples were thoroughly mixed and then divided into quarters. The soil in three of the quarters was air-dried and then stored at room temperature. Three sub-samples of this soil were separately analysed as described below to determine aggregate size distribution at each depth of each treatment. Each subsample was considered a replication.
Analytical methods
Soil aggregation was determined by placing 100 g air-dry soil on a set of nested sieves (250- and 53-μm sieves).The sieves were put in water for 5 min to allow the samples to equilibrate. The sieves were then moved up and down in the water (180 times per min) for 5 min. After sieving, the aggregate fractions (i.e., >250, 53–250 and <53 µm) were dried to constant weight at 60 °C and then weighed (Kemper & Koch Reference Kemper and Koch1966). Whole soil samples and the aggregate fractions were both analysed to determine SOC.
Soil organic C was determined using the Walkley–Black method (Díaz-Zorita Reference Díaz-Zorita1999). Available soil N was determined using the alkaline hydrolysis diffusion method (Mulvaney & Khan Reference Mulvaney and Khan2001). Available P was determined using the 0·5 M sodium bicarbonate (NaHCO3) method (Page et al. Reference Page, Miller and Keeney1982).
Calculations and statistical analysis
The contribution of aggregate-associated SOC to total SOC (CASOC TSOC , %) was calculated according to the following equation (Gao et al. Reference Gao, Guo, Liu, Che and Li2010):
 $$CASO{C_{TSOC}} = \displaystyle{{ASO{C_{SCI}} \times AMF} \over {TSOC}}$$
where ASOC SCI is the aggregate-associated SOC content in size class i (mg/g), AMF is the aggregate mass fraction of the total soil sample (%) (i.e., soil mass in size class i divided by the total weight of the soil) and TSOC is the SOC content of the total soil sample (mg/g).
The aggregate index (A i , %), which indicates the dispersion of macro-aggregates (i.e., >250 µm fraction), was calculated according to the following equation (Gong & He Reference Gong and He2001):
 $${A_i} = \displaystyle{{T{W_{ST}} - WSA{W_{ \gt 250}}} \over {T{W_{ST}}}} \times 100$$
where TW ST is the total mass of the soil sample (mg) and WSAW >250 is the mass of >250 µm water stable aggregates (mg). The aggregate index increases as soil aggregate stability decreases.
Soil organic C stocks (SOCD, kg/m2) were calculated according to the following equation (Zhou et al. Reference Zhou, Zhou and Wang2003):
 $$SOCD = \displaystyle{{Sd \times OCC \times SBD} \over {100}}$$
where Sd is the soil depth (cm), OCC is the organic C content (g/kg), and SBD is the soil bulk density (g/cm3).
One- and two-way ANOVA were conducted using SPSS version 11·5 software. The main factors for statistical analysis of SOC and SOC density were season, conversion time and depth. Aggregate-associated SOC and stable aggregate content were not measured in different seasons. Therefore, the main factors in statistical analysis for these variables were conversion time and depth. Least significant difference (LSD) tests were used to compare means. Data are expressed as mean ± standard error (s.e.).
RESULTS
Changes in soil organic carbon with depth
Reclamation of salinized land by cotton farming generally increased SOC concentrations and stocks; however, the pattern varied across time (Fig. 3). Compared with abandoned farmland, SOC in the 0–60 cm increased after 1 year of cotton farming, decreased after 3 years and then increased again after 5 and 10 years. After 10 years of cotton farming, SOC concentrations and stocks in the 0–60 cm depth had increased by 45 and 35%, respectively.
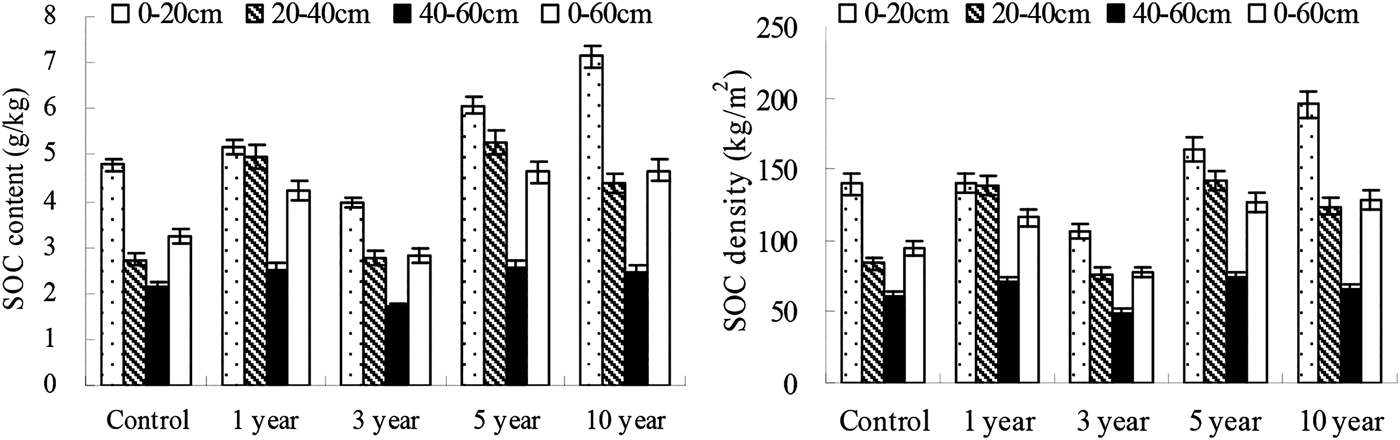
Fig. 3. Changes in soil organic carbon (SOC) concentrations and stocks in the 0–20, 20–40, 40–60 and 0–60 cm depths after abandoned, salinized farmland was reclaimed for cotton production. Values for the 0–60 cm depth represent the average of all five soil depths. Control: original abandoned farmland.
Soil organic C concentrations decreased significantly with depth (P < 0·05) (Fig. 3). The exception was 1 year after reclamation, where there was no significant difference in SOC concentration between the 0–20 cm and the 20–40 cm depths. In abandoned farmland, SOC concentrations in the 0–20 and 20–40 cm depths were 124 and 27% greater, respectively, than in the 40–60 cm depth. Ten years after reclamation, SOC concentrations in the 0–20 and 20–40 cm depths were 188 and 77% greater, respectively, than in the 40–60 cm depth.
The SOC stocks also decreased significantly with depth (P < 0·05) (Fig. 3). The exception was that 1 year after reclamation there was no significant difference in SOC stocks between the 0–20 cm and the 20–40 cm depths. In abandoned farmland, SOC stocks in the 0–20 and 20–40 cm depths were 129 and 39% greater, respectively, than in the 40–60 cm depth. Ten years after reclamation, SOC stocks in the 0–20 and 20–40 cm depths were 197 and 88% greater, respectively, than in the 40–60 cm depth.
Seasonal changes in soil organic carbon
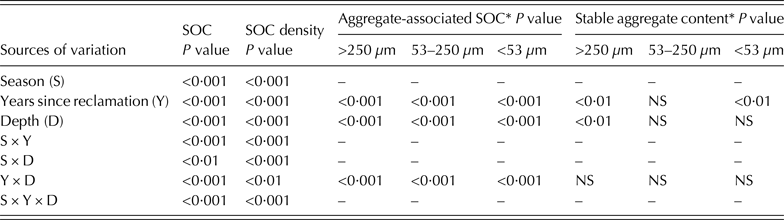
The P values for the ANOVA are shown in Table 2. Season, years since reclamation, depth and their interaction significantly affected SOC and SOC density (P < 0·05). Years since reclamation, depth and their interaction had significant effects on aggregate-associated SOC (P < 0·05). Years since reclamation had a significant effect on soil mass in the >250 and <53 µm fractions. Depth had a significant effect on soil mass in the >250 µm fraction.
Table 2. P values for the effect of season, years since reclamation and soil depth on soil organic carbon (SOC), SOC density, aggregate-associated SOC and stable aggregate content

NS, not significant.
*Aggregate-associated SOC and stable aggregate content were not determined in different seasons.
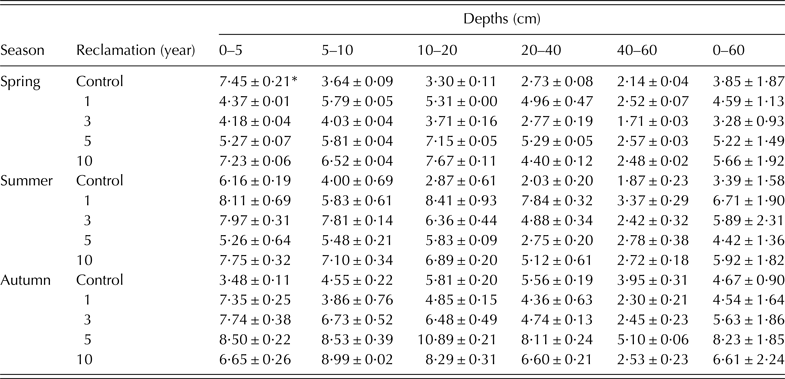
In abandoned farmland, SOC concentrations in the 0–5 cm depth were significantly greater in spring (April), followed by summer (August) and then autumn (October) (P < 0·05) (Table 2). The SOC concentrations in spring were 21% greater than those in summer and 114% greater than those in autumn. In the 0–60 cm depth of abandoned farmland, the SOC concentrations in autumn were 174% greater than those in summer and 104% greater than those in spring.
One year after reclamation, SOC concentrations in the 0–60 cm depths were 37% greater those in spring and autumn (Table 3). Similarly, SOC concentrations 3 years after reclamation were 80% greater in summer than in spring and 71% greater in autumn than in spring. The seasonal changes 5 years after reclamation exhibited a consistent pattern in all depths. The most striking temporal changes in SOC concentration were observed in the 10–40 cm depth, where SOC concentrations in autumn were 53% greater than those in spring and 121% greater than those in summer. Ten years after reclamation, the seasonal changes in SOC concentration were relatively small. In the 0–60 cm depth, SOC concentrations in autumn were 168% greater than those in summer and 11% greater than those in spring.
Table 3. Soil organic carbon (SOC) concentrations as affected by season and by depth

Control: original abandoned farmland.
*Values are means ± standard deviation.
Correlation of soil organic carbon with soil available nutrient concentration
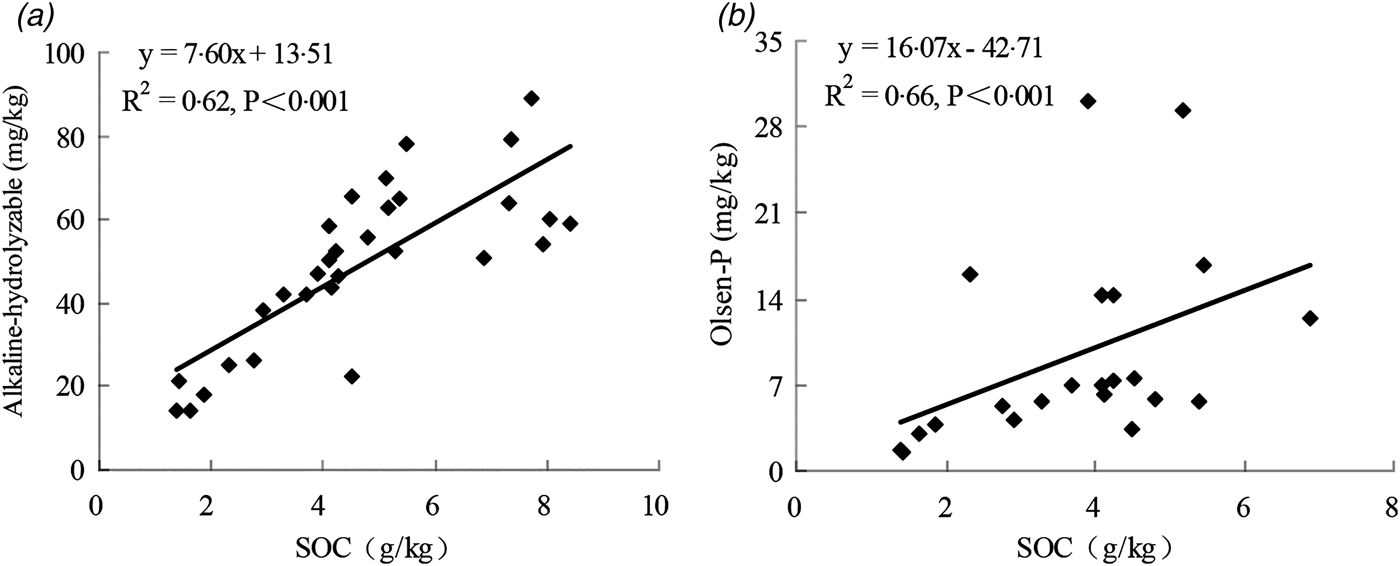
The SOC was significantly and positively correlated with available soil N (Fig. 4, R 2 = 0·62, P < 0·001) and available soil P (R 2 = 0·66, P < 0·001). These findings indicate that available soil nutrient concentration was closely related to SOC.

Fig. 4. Correlation of soil organic carbon (SOC) with (a) alkaline-hydrolysable N and (b) Olsen P.
Water stable aggregation
The soil mass in the >250 µm fraction was relatively small in abandoned farmland as well as 1 and 3 years after reclamation (Fig. 5). For example, the >250 µm fraction accounted for only 0·10 of the total soil mass in the 20–40 cm depth 1 year after reclamation. This was the smallest amount among the three aggregate size fractions in the present study. The soil mass in the >250 µm fraction increased with time. For example, the >250 µm fraction contained as much as 0·66 of the soil mass in the 10–20 cm depth 5 years after reclamation and 0·57 of the soil mass in the 0–5 cm depth 10 years after reclamation.

Fig. 5. Water stable aggregate content in different soil depths as affected by reclamation time. Values for the 0–60 cm depth represent the average of all five soil depths. Control: original abandoned farmland.
In abandoned farmland, the >250 µm fraction accounted for 0·25 of the total soil mass in the 0–5 cm depth and 0·34 of the total soil mass in the 5–10 cm depth. The aggregate index in the abandoned farmland was 75%. In comparison, 10 years after reclamation, the >250 µm fraction accounted for 0·57 of the total soil mass in both the 0–5 cm and the 5–10 cm depths. The aggregate index declined to 43%.
The proportion of soil in the <53 µm fraction increased as soil depth increased. In abandoned farmland, the <53 µm fraction accounted for 0·56 of the total soil mass in the 40–60 cm depth. In comparison, the <53 µm fraction accounted for 0·41 and 0·39 of the total soil mass in the 40–60 cm depth 5 and 10 years after reclamation, respectively.
Aggregate-associated soil organic carbon
Aggregate-associated SOC concentrations decreased as aggregate size decreased (Fig. 6). Macro-aggregate-associated (>250 µm) SOC concentrations were significantly greater than whole soil SOC concentrations (P < 0·05). Aggregate-associated SOC concentrations increased as reclamation time increased. Compared with abandoned farmland, aggregate-associated SOC concentrations 5 years after reclamation were greater by 47% in the >250 µm fraction, 33% in the 53–250 µm fraction and 28% in the <53 µm fraction (0–60 cm depth). Ten years after reclamation, aggregate-associated SOC concentrations were greater by 53% in the >250 µm fraction, 73% in the 53–250 µm fraction and 113% in the <53 µm fraction. Aggregate-associated SOC concentrations within each fraction were generally lower 1 and 3 years after reclamation compared with abandoned farmland.

Fig. 6. Aggregate-associated soil organic carbon (SOC) concentrations in different soil depths as affected by reclamation time. Values for the 0–60 cm depth represent the average of all five soil depths. Error bars represent standard deviation. Control: original abandoned farmland.
Aggregate-associated SOC concentrations decreased as depth increased (Fig. 6). Five years after reclamation, macro-aggregate-associated (>250 µm) SOC concentrations in the 0–10 cm depth were 11% greater than those in the 10–40 cm depth and 74% greater than those in the 40–60 cm depth. Ten years after reclamation, macro-aggregate-associated SOC concentrations in the 0–10 cm depth were 42% greater than those in the 10–40 cm depth and 52% greater than those in the 40–60 cm depth. Similar trends were observed in the 53–250 and <53 µm fractions.
Contribution of aggregate-associated soil organic carbon to total soil organic carbon
Aggregate-associated SOC in the >250 µm and the 53–250 µm fractions contributed more to total SOC in reclaimed farmland than in abandoned farmland. The <53 µm fraction contributed least to total SOC (Fig. 7). The contribution of macro-aggregate-associated (>250 µm) SOC to total SOC was relatively small during the first years after reclamation. However, the contribution significantly increased 5 years after reclamation (P < 0·05). In the 0–60 cm depth, the contribution of macro-aggregate-associated (>250 µm) SOC to total SOC was 87 and 69% greater 5 and 10 years after reclamation, respectively, compared with abandoned farmland. The contribution of micro-aggregate-associated (<53 µm) SOC to total SOC decreased as reclamation time increased.
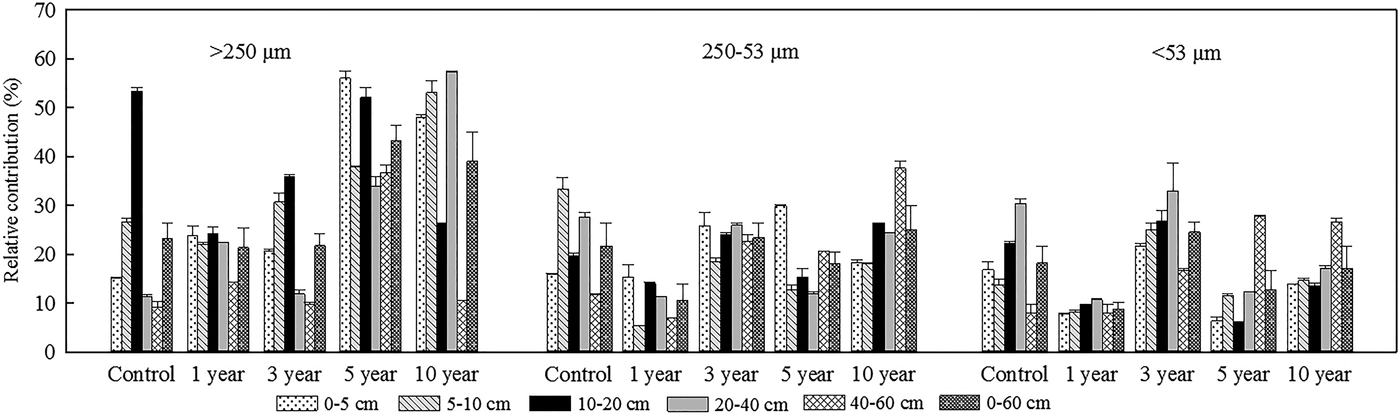
Fig. 7. The relative contribution of aggregate-associated soil organic carbon (SOC) to total SOC after reclamation. Values for the 0–60 cm depth represent the average of all five soil depths. Error bars represent standard deviation. Control: original abandoned farmland.
In the 0–5 cm depth, the contribution of macro-aggregate-associated (>250 µm) SOC to total SOC was 57, 36, 270 and 217% greater 1, 3, 5 and 10 years after reclamation, respectively, compared with abandoned farmland. There was no significant change in the contribution of the 53–250 µm fractions to total SOC 1 year after reclamation. However, the contribution of the 53–250 µm fractions to total SOC increased by 61, 88 and 15% 3, 5 and 10 years after reclamation, respectively. The contribution of macro-aggregate-associated SOC to total SOC decreased as soil depth increased. In contrast, the contribution of micro-aggregate-associated SOC to total SOC increased with depth.
DISCUSSION
Changes in soil organic carbon after reclamation
Soil organic C concentrations and stocks were generally greater in abandoned farmland than in the 1 and 3 years reclamation treatments, especially in the 0–10 cm depth. Vegetative succession began when the salinized farmland was abandoned. The biomass of the halophytic vegetation (S. glauca Bunge, K. foliatum, S. collina Pall and Tamarix chinensis Lour.) was not removed during the 27 years before the current study and the soil was not tilled. There may have been some increase in SOC during this time, especially near the soil surface. During the early stages of reclamation, cultivation changed the soil environment. Tillage operations disrupt soil aggregates (Aguilar et al. Reference Aguilar, Kelly and Heil1988), resulting in higher SOC decomposition rates (Prentice & Fung Reference Prentice and Fung1990). During the first 3 years after reclamation, SOC in the surface soil was mineralized more rapidly than it was replaced.
The SOC concentrations 5 and 10 years after reclamation were greater than those in the abandoned farmland. Xinjiang is a desert region and biomass production is generally low. Agricultural soils in the area are irrigated, thus increasing biomass production. Cotton gin screenings and cotton residue were mixed into the soil after harvest in the autumn. Cotton roots are also an important source of organic C. Additional OM would change not only the structure but also the biological and chemical properties of the soil. Overall, reclamation significantly increased both SOC concentrations and stocks. Appropriate fertilizer application combined with the return of residue to the soil may gradually increase C accumulation and the soil could become a C sink.
Soil organic C concentrations generally decreased with soil depth. The gin screenings and above-ground residue were mixed into the soil to a depth of about 40 cm. In addition, in this drip-irrigated system, cotton roots are primarily located in the upper 40 cm of the profile (Liu et al. Reference Liu, Yang, Li, Liu, Yu and Wang2012). These organic inputs increased SOC and microbial activity in the topsoil, especially in the 0–20 cm depth. Organic inputs below the 40 cm depth consisted primarily of leached OM and root exudates. These C amounts would have been very small.
There was significant seasonal variation in SOC. In abandoned farmland, the SOC content in the 0–5 cm depth was greatest in spring. The vegetation on the abandoned farmland consists primarily of perennial shrubs and ephemeral herbs. The latter accounted for 0·70–0·80 of the vegetative cover. Melting snow makes the soil wet in early spring: the ephemeral herbs germinate and complete their entire life-cycle quickly. Vegetative growth on abandoned farmland is greater in spring than in any other season. The roots of most ephemeral plants are mainly concentrated in the 0–10 cm depth. These roots contribute C to the soil and promote microbial activity. This results in SOC accumulation near the surface of abandoned farmland.
In the reclaimed land, SOC concentrations in the 0–60 depth were low in spring and high in the summer. The main reason is probably that soil aggregation in the cotton fields was reduced by freezing and thawing during winter and early spring (Skogland et al. Reference Skogland, Lomeland and Goksoyr1988; Fitzhugh et al. Reference Fitzhugh, Driscoll, Groffman, Tierney, Fahey and Hardy2001). The loss of aggregate protection increased OM decomposition, thus reducing SOC concentrations in spring (Wang & Bettany Reference Wang and Bettany1993). The SOC concentration increased in summer due to new organic inputs from the growing cotton crop.
Soil aggregation and aggregate-associated soil organic carbon
Six et al. (Reference Six, Elliott and Paustian2000a , Reference Six, Elliot and Paustian b ) reported that the >250 µm fraction was positively correlated with soil fertility, making it the most important fraction in the soil. Therefore, the >250 µm fraction can be used as an index to reflect the quality of soil structure. Reclamation significantly increased the proportion of soil macro-aggregates. After 10 years of cotton production, the >250 µm fraction accounted for 0·57 of the total soil mass in the 0–10 cm depth. This was 90% greater than that in abandoned farmland. Increases in the mass of the >250 µm fraction indicate that the soil structure is becoming more stable (Six et al. Reference Six, Elliott and Paustian2000a , Reference Six, Elliot and Paustian b ).
The stabilization of SOC occurs through chemical processes, biochemical chelation and physical protection. Among these processes, physical protection may be most important (Christensen Reference Christensen2001; Bronick & Lal Reference Bronick and Lal2005). Macro-aggregate-associated (<250 µm) SOC concentrations decreased during the first year of reclamation. This is probably because tillage during the first year damaged soil aggregates, resulting in the decomposition of OM that accumulated during vegetative succession of the abandoned farmland (Prentice & Fung Reference Prentice and Fung1990).
Macro-aggregate-associated SOC concentrations and the contribution of macro-aggregate-associated SOC to total SOC both increased as reclamation time increased. Reclamation also reduced the contribution of micro-aggregate-associated SOC to total SOC. As already mentioned, organic C inputs to soil were greater in the reclaimed farmland than in the abandoned farmland. Furthermore, soil conditions were more favourable for microbial activity. Both of these factors promote macro-aggregate formation (Bossuyt et al. Reference Bossuyt, Denef, Six, Frey, Merckx and Paustian2001). Macro-aggregates provide physical protection of SOC. In addition, macro-aggregate-associated particulate OM increases during reclamation (Rieu & Sposito Reference Rieu and Sposito1991). As expected, SOC concentrations increased as aggregate size increased (Elliott Reference Elliott1986; Jastrow Reference Jastrow, Boutton and Miller1996).
The water stable macro-aggregate content decreased with soil depth, whereas the micro-aggregate content increased. As mentioned previously, relatively little residue was incorporated below the 40 cm depth. The primary organic inputs below this depth would have been root exudates and leached OM. Organic matter is the glue which binds soil particles together to form aggregates. This may partly explain why the proportion of macro-aggregates and macro-aggregate-associated SOC were significantly less in the 40–60 cm depth than in the 0–20 cm depth.
CONCLUSIONS
The results indicate that reclamation of abandoned, salinized farmland for cotton production can increase SOC concentrations and stocks. The SOC concentrations and stocks decreased during the first 3 years of cotton production but then began to increase steadily. After 10 years of cotton production SOC concentrations and stocks in the 0–60 cm depth were 45% greater than those in abandoned farmland. The increases in SOC were closely linked to changes in macro-aggregation and macro-aggregate-associated SOC. It should be noted that the return of crop residue and gin screenings to the soil is important for increasing SOC. Additional study is needed about temporal changes in soil quality and land productivity changes after reclamation of abandoned farmland. Although SOC is closely related to soil quality and productivity (Majumder et al. Reference Majumder, Biswapati, Bandyopadhyay and Chaudhury2007), SOC concentrations are only one means of evaluating the effect of reclamation on the soil system. Soil physical and chemical properties, nutrient content, soil microbial and enzyme activity, as well as crop yield, should also be considered.
This research was supported by the National Natural Science Foundation of China (grant no. 31171507) and (grant no. 31360320), Research Project of Chinese Ministry of Education (grant no. 213039A) and the International Science & Technology Cooperation Programme of China (grant no. 2011DFA93140).