


INTRODUCTION
Ten years after Petersen and colleagues’ seminal article on mild cognitive impairment (MCI) (Petersen et al., Reference Petersen, Smith, Waring, Ivnik, Tangalos and Kokmen1999), a new interest in classifying cognitive phenotypes of MCI through neuropsychological test performance emerged. Several research groups propose that MCI diagnoses fall into cognitive phenotypes, including primary amnestic, dysexecutive, and mixed or multi-domain MCI (Clark et al., Reference Clark, Delano-Wood, Libon, McDonald, Nation, Bangen and Bondi2013; Damian et al., Reference Damian, Hausner, Jekel, Richter, Froelich, Almkvist and Frisoni2013; Delano-Wood et al., Reference Delano-Wood, Bondi, Sacco, Abeles, Jak, Libon and Bozoki2009; Libon et al., Reference Libon, Xie, Eppig, Wicas, Lamar, Lippa and Swenson2010). Recently, other variants have been reported too, including language/dysnomic or visuospatial phenotypes (Bondi et al., Reference Bondi, Edmonds, Jak, Clark, Delano-Wood, McDonald and Galasko2014; Edmonds et al., Reference Edmonds, Delano-Wood, Clark, Jak, Nation, McDonald and Salmon2015; Machulda et al., Reference Machulda, Lundt, Albertson, Kremers, Mielke, Knopman and Petersen2019).
Amnestic Mild Cognitive Impairment
Amnestic MCI (aMCI) is a syndrome characterized by substantial memory impairment but preservation of functional abilities (Albert et al., Reference Albert, DeKosky, Dickson, Dubois, Feldman, Fox and Petersen2011). While the diagnosis of aMCI is relatively straightforward from a neuropsychological perspective, assessment of the etiology requires an examination of β-amyloid and tau in cerebrospinal fluid or by positron emission tomography, a variety of magnetic resonance imaging volumetric indices (e.g., ventricle, hippocampal, entorhinal cortex, whole brain), and analysis of vascular pathology (Gorelick et al., Reference Gorelick, Scuteri, Black, DeCarli, Greenberg, Iadecola and Petersen2011; Nettiksimmons, DeCarli, Landau, & Beckett, Reference Nettiksimmons, DeCarli, Landau and Beckett2014; Yaffe, Petersen, Lindquist, Kramer, & Miller, Reference Yaffe, Petersen, Lindquist, Kramer and Miller2006). Cognitively, aMCI may be heterogenous with a wide range of impairment in various cognitive domains. In the Mayo Clinic Study of Aging, 38% of participants with incident MCI clustered under aMCI and heterogeneity in their cognitive performance was evident in each domain (Machulda et al., Reference Machulda, Lundt, Albertson, Kremers, Mielke, Knopman and Petersen2019). Though most participants scored within one standard deviation of each other, the range extended several standard deviations in both directions (Machulda et al., Reference Machulda, Lundt, Albertson, Kremers, Mielke, Knopman and Petersen2019). Conceivably, clustering techniques could be applied to subtypes of MCI such as aMCI or other related diagnostic entities such as subjective cognitive decline (SCD).
Subjective Cognitive Decline
SCD is a formal diagnosis for those who complain of cognitive issues but have no substantial objective deficits that would warrant a diagnosis of MCI (Jessen et al., Reference Jessen, Amariglio, Van Boxtel, Breteler, Ceccaldi, Chételat and Van Der Flier2014). Prior work suggests that the etiologies of SCD are multifaceted, including vascular pathology (Dufouil, Fuhrer, & Alpérovitch, Reference Dufouil, Fuhrer and Alpérovitch2005), depression or anxiety (Balash et al., Reference Balash, Mordechovich, Shabtai, Giladi, Gurevich and Korczyn2013), or early Alzheimer’s pathology (Amariglio et al., Reference Amariglio, Becker, Carmasin, Wadsworth, Lorius, Sullivan and Sperling2012; Selnes et al., Reference Selnes, Aarsland, Bjørnerud, Gjerstad, Wallin, Hessen and Kjærvik2013). SCD can be broadly categorized as reversible or stable SCD with no further cognitive decline and SCD with subsequent progression to MCI or dementia (Jessen et al., Reference Jessen, Amariglio, Buckley, van der Flier, Han, Molinuevo and Sikkes2020). Correctly identifying those who later progress is of the utmost importance, especially if early delivery of supports and services could reduce future caregiver burden.
Progression to Dementia for SCD and aMCI
Meta-analytic results suggest that the annual progression rate of those with “subjective memory complaints” is 7% for MCI and 2% for dementia (Mitchell, Beaumont, Ferguson, Yadegarfar, & Stubbs et al., Reference Mitchell, Beaumont, Ferguson, Yadegarfar and Stubbs2014). From a meta-analysis that examined aMCI, the annual progression rate to dementia was estimated at 12% (Mitchell & Shiri-Feshki, Reference Mitchell and Shiri-Feshki2009). Conceivably, subgroups of participants with SCD or aMCI may progress more quickly or at slower rates.
Role of Machine Learning
If cognitive phenotypes within SCD or aMCI diagnoses convert to a worsened cognitive state at different rates, then identifying the most influential neuropsychological tests to discriminate phenotypes is necessary. Random forests – a machine learning algorithm – is a novel technique to extract the neuropsychological tests most relevant to progression toward greater cognitive impairment. The use of random forests is becoming widely accepted in the cognitive aging literature (Maroco et al., Reference Maroco, Silva, Rodrigues, Guerreiro, Santana and de Mendonça2011). In short, participants are selected at random with replacement from an original dataset and compiled into a new dataset. This is conducted several hundred or thousands of times, creating one large analysis across all datasets (Breiman, Reference Breiman2001). Within each dataset, a random selection of variables is chosen (e.g., cognitive tests) and used to best discriminate participants into predefined clusters (e.g., cognitive profiles). From this, random forests will calculate importance values of each variable and its accuracy when classifying participants into groups.
This machine learning algorithm is robust to a variety of neuroimaging techniques, including electroencephalography (Lehmann et al., Reference Lehmann, Koenig, Jelic, Prichep, John, Wahlund and Dierks2007), magnetic resonance imaging (Lebedev et al., Reference Lebedev, Westman, Van Westen, Kramberger, Lundervold, Aarsland and Tsolaki2014), and single photon emission computed tomography (Ramirez et al., Reference Ramirez, Chaves, Gorriz, Lopez, Lvarez, Salas-Gonzalez and Padilla2009). With regard to cognitive testing, random forests are efficacious in developing weights for neuropsychological tests to discriminate clinical groups such as healthy older adults, those with MCI, and those with Alzheimer’s disease (Llano, Laforet, & Devanarayan, Reference Llano, Laforet and Devanarayan2011). As such, random forests may be an effective tool to develop a parsimonious set of cognitive tests that discriminate SCD and aMCI phenotypes through cognitive performance on a neuropsychological battery.
Objectives
This study expands prior work on cognitive profiles by answering several questions: (1) What are the phenotypes of SCD? (2) What are the phenotypes of aMCI? (3) Do different phenotypes progress at different rates? and (4) How accurate is a machine learning algorithm (random forests) at classifying individuals into phenotypes?
METHOD
Participants
Participants were members of the Prague cohort of the Czech Brain Aging Study (CBAS; Sheardova et al., Reference Sheardova, Vyhnalek, Nedelska, Laczo, Andel, Marciniak and Hort2019). Initially, participants without dementia were referred to the Memory Clinic by general practitioners, neurologists, or psychiatrists for cognitive complaints reported by themselves and/or by their informants. In total, 861 older adults with SCD or aMCI were examined at the Motol University Hospital Memory Clinic in Prague, Czech Republic. Of these, 742 underwent neuropsychological testing with 260 missing over 25% of the neuropsychological data, leaving 482 participants. Those missing large amounts of neuropsychological data may have refused or were recruited to CBAS for various ancillary substudies. An additional 37 were excluded due to missingness on the Geriatric Depression Scale 15-item version (GDS-15; Yesavage et al., Reference Yesavage, Brink, Rose, Lum, Huang, Adey and Leirer1982) or the Beck Anxiety Inventory (BAI; Beck, Epstein, Brown, & Steer, Reference Beck, Epstein, Brown and Steer1988), resulting in an analytical sample of 445, including 163 participants with SCD and 282 participants with aMCI.
Exclusion Criteria of the CBAS
Those with other neurological disorders (e.g., Parkinson’s disease, epilepsy, multiple sclerosis, severe cranio-cerebral trauma), severe depression or other psychiatric disorders (e.g., schizophrenia, bipolar disorder), other systemic issues causing cognitive impairment (e.g., systemic cancer, chronic kidney disease), or a recent history of stroke were excluded from CBAS (Sheardova et al., Reference Sheardova, Vyhnalek, Nedelska, Laczo, Andel, Marciniak and Hort2019).
Defining SCD and aMCI
SCD was defined as having normal cognitive performance on a neuropsychological battery (i.e., scores <1.5 standard deviations below age- and education-adjusted means), self-reported persistent cognitive complaints with onset within the last 5 years, which motivated the consultation and was unrelated to an acute event, and had a Clinical Dementia Rating (Hughes, Berg, Danziger, Coben, & Martin, Reference Hughes, Berg, Danziger, Coben and Martin1982) (CDR) global score of ≤.5 (Jessen et al., Reference Jessen, Amariglio, Van Boxtel, Breteler, Ceccaldi, Chételat and Van Der Flier2014).
aMCI was defined by self- or informant-reported cognitive decline in addition to scoring ≥1.5 standard deviations below age- and education-adjusted neuropsychological test means in at least one of the memory tests and a CDR score of ≤.5 (Albert et al., Reference Albert, DeKosky, Dickson, Dubois, Feldman, Fox and Petersen2011). Although aMCI was based mainly on neuropsychological tests, agreement within a multidisciplinary clinical team was required for the formal diagnosis, including a cognitive neurologist and a clinical neuropsychologist assessing the nature of the cognitive complaints, the patient medical history, and estimated premorbid cognitive functioning. Cognitive phenotypes were unknown during evaluations. However, clinicians did have knowledge of the prior neuropsychological performance, diagnosis, and suspected etiology. Motol University Hospital and CBAS use an integrative clinical approach that incorporates all available data to assure an accurate diagnosis.
Procedure
All data come from CBAS, a longitudinal cohort study of patients in Memory Clinics in Prague and Brno, Czech Republic (Sheardova et al., Reference Sheardova, Vyhnalek, Nedelska, Laczo, Andel, Marciniak and Hort2019). All participants and informants provided informed consent and the study has been approved by the Motol University Hospital Institutional Review Board.
MEASURES
Neuropsychological Tests
All neuropsychological tests were translated into Czech, back-translated to English and edited for any discrepancies, and adapted to the Czech population [e.g., the Controlled Oral Word Association Test (COWAT) in Czech uses the letters “N,” “K,” and “P” instead of the English COWAT that uses “F,” “A,” and “S” as these are more appropriate for the Czech language Preiss et al., Reference Preiss, Kalivodová, Kundrátová, Mrlinová, Ježková, Kubů and Houbová2002].
Attention/working memory or processing speed was assessed with four tests: Trail Making Test – Part A (TMT-A) reverse-coded for analytical purposes with a max time of 180 s (Reitan, Reference Reitan1958), Digit Symbol Coding Test, Digit Span – Forward (Digits-F), and Digit Span – Backward (Digits-B) from the Wechsler Adult Intelligence Scale – Revised (WAIS-R) (Wechsler & De Lemos, Reference Wechsler and De Lemos1981).
Executive function was assessed with two tests: COWAT with letters N, K, and P (Czech Version) (Benton, Reference Benton1969), and Trail Making Test – Part B (TMT-B) reverse-coded for analytical purposes (Bezdicek et al., Reference Bezdicek, Motak, Axelrod, Preiss, Nikolai, Vyhnalek and Ruzicka2012). The maximum time for completion of the TMT-B was 500 s, and those who were unable to complete it in the given time were scored as 500 s.
Language was assessed with four tests: Boston Naming Test (BNT) (Goodglass, Kaplan, & Weintraub, Reference Goodglass, Kaplan and Weintraub1983), Verbal Fluency Test – Vegetables (VFT-V), Verbal Fluency Test – Animals (VFT-A) (Nikolai et al., Reference Nikolai, Štěpánková, Michalec, Bezdíček, Horáková, Marková and Kopeček2015), and the Similarities subtest from the WAIS-III (Wechsler III, Reference Wechsler1997).
Memory was assessed with four tests: two verbal memory tests [Rey Auditory Verbal Learning Test (AVLT) and Uniform Data Set Logical Memory] and two nonverbal memory tests [Brief Visuospatial Memory Test (BVMTR) and the Rey–Osterrieth Complex Figure Test (ROCFT)]. More specifically, immediate recall was assessed with three tests: AVLT – Immediate Recall (AVLT-I; Sum of Trials 1–5) (Bezdicek et al., Reference Bezdicek, Stepankova, Moták, Axelrod, Woodard, Preiss and Poreh2014), BVMTR – Revised Immediate Recall (BVMTR-I; Sum of Trials 1–3) (Benedict, Schretlen, Groninger, Dobraski, & Shpritz, Reference Benedict, Schretlen, Groninger, Dobraski and Shpritz1996), and the Uniform Data Set Logical Memory Immediate Recall Test (Log-I) (Nikolai et al., Reference Nikolai, Stepankova, Kopecek, Sulc, Vyhnalek and Bezdicek2018). Delayed recall was assessed with four tests: AVLT – Delayed Recall (AVLT-D), BVMTR – Revised Delayed Recall (BVMTR-D), the Uniform Data Set Logical Memory Delayed Recall Test (Log-D), and the ROCFT Recall (ROCFT-R) (Osterrieth, Reference Osterrieth1944).
Visuospatial skills were assessed with two tests: Clock Drawing Test (CDT) (Cohen, Ricci, Kibby, & Edmonds, Reference Cohen, Ricci, Kibby and Edmonds2000; Mazancova, Nikolai, Stepankova, Kopecek, & Bezdicek, Reference Mazancova, Nikolai, Stepankova, Kopecek and Bezdicek2017) (Cohen’s scoring system) and the ROCFT Copy (ROCFT-C) (Meyers & Meyers, Reference Meyers and Meyers1995).
Global cognition was measured by the Mini Mental State Examination (MMSE) (Štěpánková et al., Reference Štěpánková, Nikolai, Lukavský, Bezdíček, Vrajová and Kopeček2015) and was used to characterize the overall functioning of the cognitive phenotypes after clustering on the full neuropsychological battery.
Demographics
Age (years), sex (male or female), education (years), depression as measured by the GDS-15 (cutoff ≥ 5; Yesavage et al., Reference Yesavage, Brink, Rose, Lum, Huang, Adey and Leirer1982), and anxiety as measured by the BAI (cutoff ≥ 16; Beck et al., Reference Beck, Epstein, Brown and Steer1988) were used as demographics to describe the latent cognitive profiles.
STATISTICAL ANALYSES
Descriptive Statistics
We used analysis of variance (ANOVA) to compare test scores across latent profiles for each diagnostic group and reported the omnibus p-values. Cohen’s d (Cohen, Reference Cohen1988) was used to measure effect size (.20 small, .50 medium, and .80 large).
Multiple Imputation
Because latent profile analyses and random forests require no missing data, multiple imputation was conducted on participants with less than 25% of the neuropsychological tests as missing. Missing data were imputed through using a bootstrapping procedure (mean of 20 iterations) that utilized predictive mean matching (Hmisc; Harrell, Reference Harrell2019). This sophisticated type of imputation uses complete cases to better predict values for missing cases. The vast majority of neuropsychological tests (89%) had less than 5% of data missing. Two tests had slightly higher missingness: TMT-B at 15% and TMT-A at 12%.
Latent Profile Analysis
Deriving latent, homogenous clusters from a heterogenous group of participants has been a widely used methodology in the cognitive aging literature. While most studies that utilize this technique have large sample sizes (Blanken et al., Reference Blanken, Jang, Ho, Edmonds, Han, Bangen and Nation2020; Hayden et al., Reference Hayden, Kuchibhatla, Romero, Plassman, Burke, Browndyke and Welsh-Bohmer2014; Köhler et al., Reference Köhler, Hamel, Sistermans, Koene, Pijnenburg, van der Flier and Ramakers2013), previous work has shown that latent profile analysis is effective with sample sizes similar to our own (McGuinness, Barrett, McIlvenna, Passmore, & Shorter, Reference McGuinness, Barrett, McIlvenna, Passmore and Shorter2015). Finite mixture models utilize a theory developed from structural equation modeling which suggests that a latent construct (e.g., an undiagnosed cognitive phenotype) may drive the differences seen in the observed variables (e.g., neuropsychological test performance). Latent profile analyses (occasionally referred to as gaussian finite mixture models) for SCD and aMCI groups were carried out (mclust; Scrucca, Fop, Murphy, & Raftery, Reference Scrucca, Fop, Murphy and Raftery2016). The mclust procedure uses an algorithm to group participants into data-driven categories called latent profiles. In our study, the procedure used all neuropsychological tests to derive the latent profiles. Demographics and the MMSE were not included in constructing the latent profile analyses but were assessed at the group level once participants were sorted into their respective phenotypes.
Bayesian information criterion (BIC) and integrated complete-data likelihood (ICL) statistics were used to determine the best fitting latent profile solution for each diagnostic category. For each additional profile being estimated, the BIC value is corrected to maximize parsimony. ICL is estimated by taking the BIC value and penalizing it further when profiles overlap (Scrucca et al., Reference Scrucca, Fop, Murphy and Raftery2016). In simulation studies, sample size does not affect statistical power substantially in comparison to other factors like the Cohen’s d effect size difference between latent profiles (Tein, Coxe, & Cham, Reference Tein, Coxe and Cham2013).
Z-Score Estimation by Cognitive Domain
In order to compare latent profiles on cognitive performance, Z-scores were created for all neuropsychological tests. Z-scores were computed with the overall means and standard deviations within each diagnostic category (i.e., individual score minus the overall SCD/aMCI mean, divided by the overall SCD/aMCI standard deviation).
Survival Analysis and Cox Regression
Kaplan–Meier curves were conducted for time-to-event data. Participants with SCD were followed for a maximum of 7.75 years and participants with aMCI were followed for a maximum of 7.50 years. For the SCD group, an event was dummy-coded as converting to MCI or all-cause dementia at the earliest diagnosis (1) or censored at the latest time point available (0). For the aMCI group, an event was dummy-coded as converting to all-cause dementia at the earliest diagnosis (1) or censored at the latest time point available (0). Median number of days to diagnosis were reported with the survival curves. Omnibus p-values are reported for each Kaplan–Meier plot to suggest that differences between the curves exist.
In order to formally test for differences in progression rates after controlling for group differences (age, sex, and education), Cox proportional hazards regression was used. Hazard ratios adjusted for age, sex, and education (AHR) were reported with p-values and confidence intervals for each latent profile (survminer and survival; Kassambara, Kosinski, Biecek, & Fabian, Reference Kassambara, Kosinski, Biecek and Fabian2017; Therneau & Lumley, Reference Therneau and Lumley2015).
Machine Learning
Random forests were conducted using the randomForest package in R (Liaw & Wiener, Reference Liaw and Wiener2002) to (a) examine the accuracy of the phenotype classifications in each diagnostic group and (b) identify the cognitive tests that drive phenotype classification (Breiman, Reference Breiman2001). This machine learning classification tool was used on SCD and aMCI groups separately to identify the neuropsychological tests that best discriminated latent profiles.
Briefly, bootstrapped datasets of identical sizes to the originating dataset are randomly developed with replacement (i.e., each participant can be randomly assigned to a new dataset once, more than once, or never). With each new dataset (10,000 were specified), five random cognitive tests from the whole battery are used to split the participants into phenotypes. This ultimately gives the importance values of the tests (i.e., how effective a cognitive test is at separating profiles within SCD or aMCI diagnostic categories). Due to the iterative bootstrapping procedure, roughly one-third of all individuals sampled are left out, creating an “out-of-bag” (OOB) dataset that can be used for measuring classification accuracy.
The number of new datasets was set at 10,000 and the number of cognitive tests that each dataset selects was set at the square root of the total number of tests, or five. Classification accuracy was reported for the entire group (OOB error) by comparing the random forest predictions to the original latent profiles and within each profile (classification error). Mean decrease in accuracy (MDA) was used to ascertain variable importance and is presented in Supplemental Table 2. Larger values of MDA for a cognitive test indicate greater classification error of the latent profiles if the test was excluded from the battery. All analyses were conducted in R v.3.6.1.
RESULTS
Latent Cognitive Profiles and Progression
In both the SCD and aMCI groups, a three-latent-profile solution best fit the data based on the model BIC and ICL values.
SCD
See Table 1 for demographics and differences in cognitive performance by each profile. Profile 1 (20%) was characterized by being the oldest and performed the poorest on the cognitive tests. In comparison to a typical (average) participant with SCD (Z-score of 0), Profile 1 scored below average on all tests and especially poorly on immediate and delayed recall (BVMTR-I: −1.03 SD, BVMTR-D: −1.17 SD), language (BNT: −1.16 SD), and executive function (TMT-B: −1.00 SD). Profile 2 (53%) was characterized by being younger and performed typical to the average SCD participant with some deficits in processing speed. Profile 3 (27%) was characterized by being the youngest and consistently scored one-half to over one standard deviation above typical SCD values, suggesting excellent cognitive performance. See Figure 1 for a plot of the Z-scores by profile.
Table 1. Cognitive phenotypes of adults with subjective cognitive decline
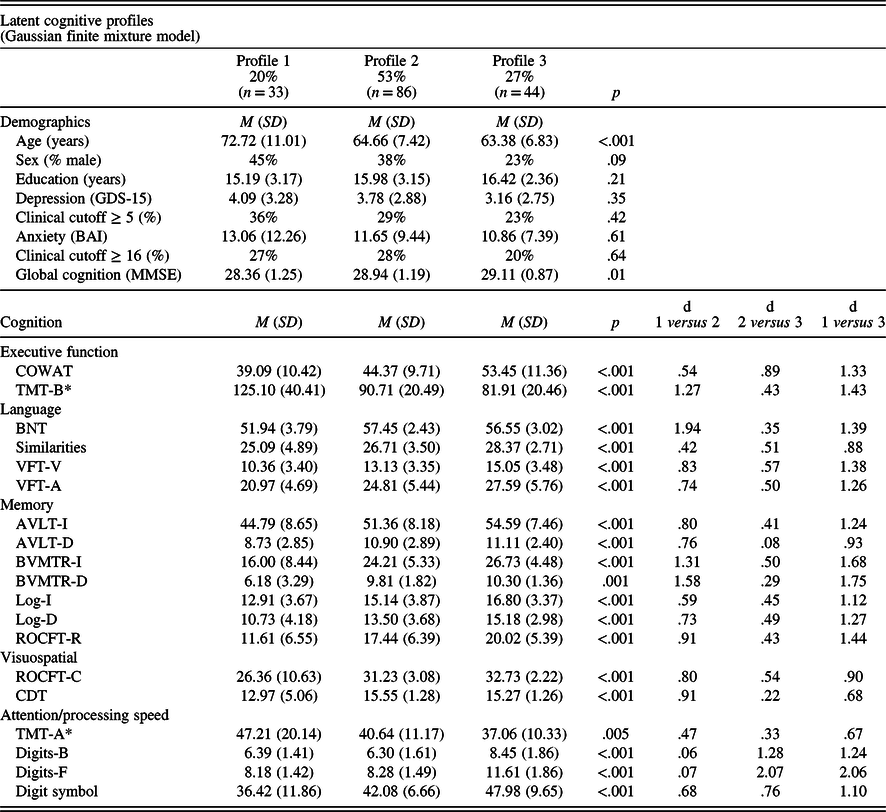
Note. *Tests where higher scores indicate worse performance. Omnibus p-values are reported from analyses of variance (ANOVAs). “d” refers to Cohen’s d effect sizes. AVLT-I/D = Rey Auditory Verbal Learning Test Immediate or Delayed Recall, BAI = Beck Anxiety Inventory, BNT = Boston Naming Test, BVMTR-I/D = Brief Visuospatial Memory Test – Revised Immediate or Delayed Recall, CDT = Clock Drawing Test, COWAT = Controlled Oral Word Association Test, Digits-B/F = Digit Span Test – Backward or Forward (WAIS-III), Digit Symbol = Digit Symbol Coding Test (WAIS-R), GDS-15 = Geriatric Depression Scale 15-item version, Log-I/Log-D = Logical Immediate or Delayed Memory (Uniform Data Set), MMSE = Mini Mental State Examination, Similarities = Similarities (WAIS-III), ROCFT-C/ROCFT-R = Rey–Osterrieth Complex Figure Test Copy or Recall, TMT-A/TMT-B = Trail Making Test Part A and Part B, VFT-V/VFT-A = Verbal Fluency Test – Vegetables/Animals.
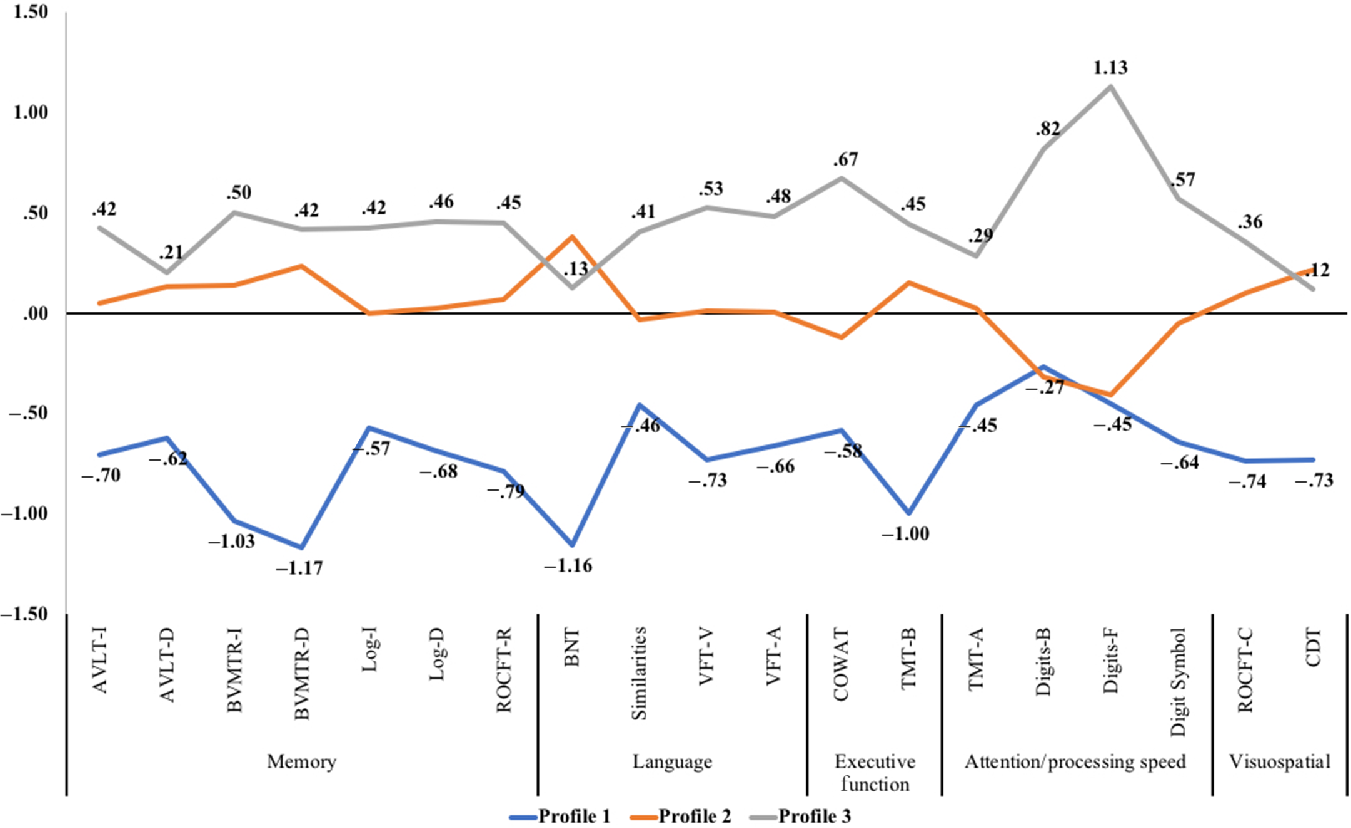
Fig. 1. Z-score cognitive profile plot for participants with subjective cognitive decline. Note. AVLT-I/D = Rey Auditory Verbal Learning Test Immediate or Delayed Recall, BNT = Boston Naming Test, BVMTR-I/D = Brief Visuospatial Memory Test – Revised Immediate or Delayed Recall, CDT = Clock Drawing Test, COWAT = Controlled Oral Word Association Test, Digits-B/F = Digit Span Test – Backward or Forward (WAIS-III), Digit Symbol = Digit Symbol Coding Test (WAIS-R), Log-I/Log-D = Logical Immediate or Delayed Memory (Uniform Data Set), Similarities = Similarities (WAIS-III), ROCFT-C/ROCFT-R = Rey–Osterrieth Complex Figure Test Copy or Recall, TMT-A/TMT-B = Trail Making Test Part A and Part B, VFT-V/VFT-A = Verbal Fluency Test – Vegetables/Animals.
Progression to MCI or Dementia
For survival analyses, 161 participants with SCD (32 from Profile 1, 85 from Profile 2, and 44 from Profile 3) were included, totaling 227.41 person-years. Participants were followed for up to 7.75 years (M = 1.40, SD = 1.89), though 84 participants (18 from Profile 1, 44 from Profile 2, and 22 from Profile 3) were left-censored and contributed zero days to the analysis. Overall, 25 progressed to MCI or dementia (12 from Profile 1, 10 from Profile 2, and 3 from Profile 3). Of the 25 conversions, 52% (n = 13) were to aMCI, 44% (n = 11) were to non-aMCI, and 4% (n = 1) were to dementia. Median days to progression could only be estimated for Profile 1 (Md = 843 days) due to few overall conversions in Profiles 2 and 3. See Figure 2 for the Kaplan–Meier survival curves.
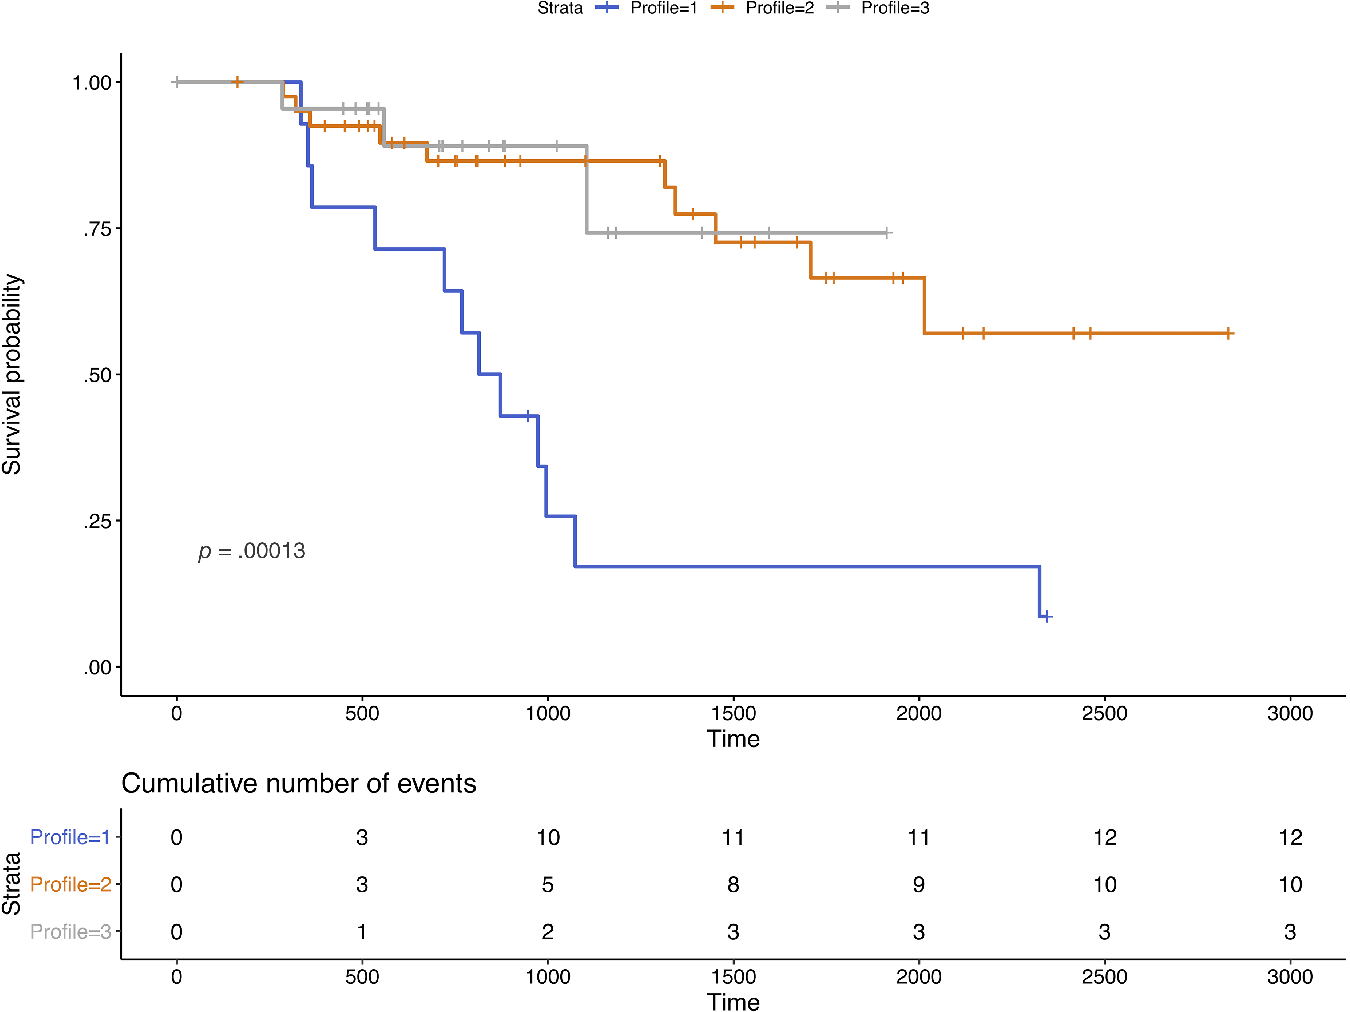
Fig. 2. Kaplan–Meier survival curves for participants with subjective cognitive decline. Note. n = 161 over 227.41 person-years. Time is measured in days. Sample sizes by profile were 32 from Profile 1, 85 from Profile 2, and 44 from Profile 3. Events included progression to mild cognitive impairment or all-cause dementia.
After controlling for age, sex, and education, participants in Profile 1 [AHR = 2.78, 95% CI = (.67, 11.49); p = .16] and Profile 2 [AHR = 1.11; 95% CI = (.30, 4.14); p = .87] progressed to MCI or dementia somewhat more quickly in comparison to participants in Profile 3, but these results were not statistically significant. There was a greater, but nonsignificant, risk of progression to MCI or dementia in Profile 1 compared to Profile 2 (Profile 1 vs. 2: AHR = 2.50, 95% CI = [.91, 6.86]; p = .08).
aMCI
See Table 2 for demographics and differences in cognitive performance by each profile. Profile 1 (39%) was characterized by being the youngest, male-dominant and performed above average on all cognitive tests in comparison to the typical aMCI participant. Profile 2 (38%) was characterized by being in their mid 70s, more female-dominant and performed as dysnomic aMCI with memory impairment and minor deficits in language. Like Profile 1, Profile 2 performed above average on tests of executive function, processing speed, and visuospatial skills. Profile 3 (24%) was characterized by being the oldest, most female-dominant, and had severe multi-domain involvement. Although Profile 2 and Profile 3 scored similarly on memory, Profile 3 revealed more pronounced deficits in language (−.30 SD to −.53 SD), executive function (−.34 SD on COWAT and −1.56 SD on TMT-B), processing speed (−.25 SD to −1.10 SD), and visuospatial skills (−.60 SD on CDT and −.92 SD on ROCFT-C). See Figure 3 for a plot of the Z-scores by profile.
Table 2. Cognitive phenotypes of adults with amnestic cognitive impairment (aMCI)

Note. *Tests where higher scores indicate worse performance. Omnibus p-values are reported from analyses of variance (ANOVAs). “d” refers to Cohen’s d effect sizes. AVLT-I/D = Rey Auditory Verbal Learning Test Immediate or Delayed Recall, BNT = Boston Naming Test, BVMTR-I/D = Brief Visuospatial Memory Test – Revised Immediate or Delayed Recall, CDT = Clock Drawing Test, COWAT = Controlled Oral Word Association Test, Digits-B/F = Digit Span Test – Backward or Forward (WAIS-III), Digit Symbol = Digit Symbol Coding Test (WAIS-R), Log-I/Log-D = Logical Immediate or Delayed Memory (Uniform Data Set), Similarities = Similarities (WAIS-III), ROCFT-C/ROCFT-R = Rey–Osterrieth Complex Figure Test Copy or Recall, TMT-A/TMT-B = Trail Making Test Part A and Part B, VFT-V/VFT-A = Verbal Fluency Test – Vegetables/Animals.
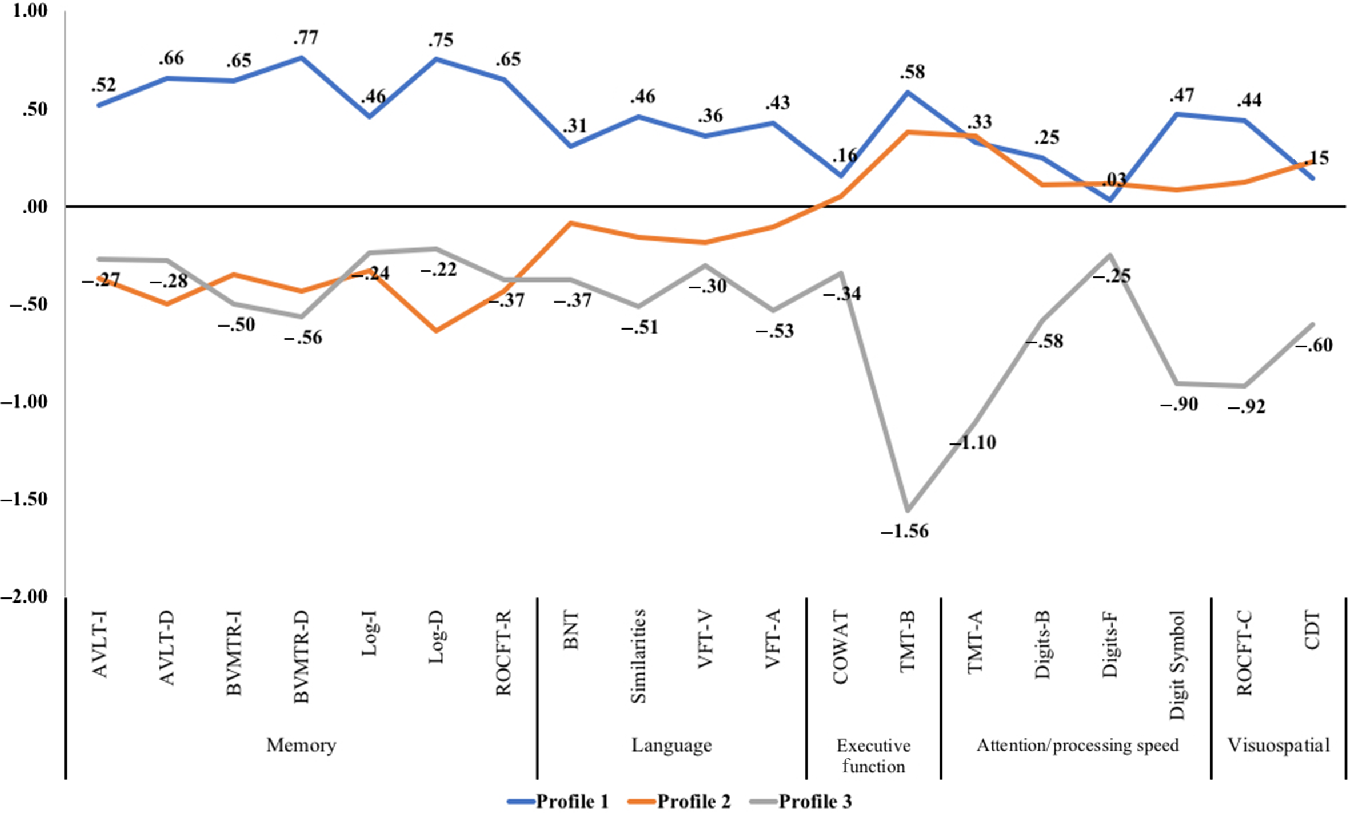
Fig. 3. Z-Score cognitive profile plot for participants with amnestic mild cognitive impairment. Note. AVLT-I/D = Rey Auditory Verbal Learning Test Immediate or Delayed Recall, BNT = Boston Naming Test, BVMTR-I/D = Brief Visuospatial Memory Test – Revised Immediate or Delayed Recall, CDT = Clock Drawing Test, COWAT = Controlled Oral Word Association Test, Digits-B/F = Digit Span Test – Backward or Forward (WAIS-III), Digit Symbol = Digit Symbol Coding Test (WAIS-R), Log-I/Log-D = Logical Immediate or Delayed Memory (Uniform Data Set), Similarities = Similarities (WAIS-III), ROCFT-C/ROCFT-R = Rey–Osterrieth Complex Figure Test Copy or Recall, TMT-A/TMT-B = Trail Making Test Part A and Part B, VFT-V/VFT-A = Verbal Fluency Test – Vegetables/Animals.
Progression to Dementia
For survival analyses, 280 participants with aMCI (109 from Profile 1, 104 from Profile 2, and 67 from Profile 3) were included, totaling 375.66 person-years. Participants were followed for up to 7.50 years (M = 1.34, SD = 1.53), though 121 participants (45 from Profile 1, 36 from Profile 2, and 40 from Profile 3) were left-censored and contributed zero days to the analysis. Overall, 76 progressed to dementia (15 from Profile 1, 40 from Profile 2, and 21 from Profile 3). Profile 3 progressed more quickly (Md = 721 days) than Profile 2 (Md = 968 days) and Profile 1 (Md = 2024 days). See Figure 4 for the Kaplan–Meier survival curves.

Fig. 4. Kaplan–Meier survival curves for participants with amnestic mild cognitive impairment. Note. n = 280 over 375.66 person-years. Time was measured in days. Sample sizes by profile were 109 from Profile 1, 104 from Profile 2, and 67 from Profile 3. Events included progression to all-cause dementia.
After controlling for age, sex, and education, Profile 2 [AHR = 2.71; 95% CI = (1.43, 5.15); p = .002] and Profile 3 [AHR = 5.71, 95% CI = (2.71, 12.04); p <. 001] progressed to dementia significantly more quickly in comparison to Profile 1. Profile 3 progressed to dementia significantly more quickly than Profile 2 [AHR = 2.10, 95% CI = (1.19, 3.71); p = .01].
Cognitive Test Selection and Classification
Random forest algorithms used all neuropsychological tests to classify participants into cognitive phenotypes. Participants with SCD were more difficult to classify (classification error rate: 20.86%) than participants with aMCI (classification error rate: 7.80%), suggesting greater uniformity in performance or the importance of noncognitive factors in SCD (see Supplemental Table 1 for the interquartile ranges of each test). For the SCD group, Digits-F, BNT, TMT-B, Digits-B, and BVMTR-D were the strongest determinants of classification. For the aMCI group, TMT-B, Log-D, BVMTR-D, ALVT-D, and ROCFT-R were the strongest determinants of classification. See Supplemental Table 2 for the most important cognitive tests by each profile.
DISCUSSION
The purpose of this study was to answer four questions: (1) What are the phenotypes of SCD? (2) What are the phenotypes of aMCI? (3) Do different phenotypes convert at different rates? and (4) How accurate is a machine learning algorithm (random forests) at classifying individuals into phenotypes? This study builds on the use of statistical clustering techniques to identify subpopulations in heterogenous MCI populations (Bondi et al., Reference Bondi, Edmonds, Jak, Clark, Delano-Wood, McDonald and Galasko2014; Clark et al., Reference Clark, Delano-Wood, Libon, McDonald, Nation, Bangen and Bondi2013; Damian et al., Reference Damian, Hausner, Jekel, Richter, Froelich, Almkvist and Frisoni2013; Delano-Wood et al., Reference Delano-Wood, Bondi, Sacco, Abeles, Jak, Libon and Bozoki2009; Edmonds et al., Reference Edmonds, Delano-Wood, Clark, Jak, Nation, McDonald and Salmon2015; Libon et al., Reference Libon, Xie, Eppig, Wicas, Lamar, Lippa and Swenson2010; Machulda et al., Reference Machulda, Lundt, Albertson, Kremers, Mielke, Knopman and Petersen2019) by extending the methodology to SCD and aMCI and by estimating differential risk of progression to MCI/dementia.
SCD and aMCI Phenotypes
SCD profiles were characterized by deficits on all domains in comparison to the “typical” participant with SCD (20%; Profile 1), average performance on all domains with mild processing speed deficits on two tests (53%; Profile 2), and superior performance on all domains (27%; Profile 3). Our study supports that within SCD participants, distinct cognitive phenotypes exist, with roughly 20% trending toward what may be considered (psychometrically) a mild form of MCI. Using the National Institute on Aging and Alzheimer’s Association (NIA-AA) criteria, we posit that SCD Profile 1 may represent Stage 2 (e.g., normal cognitive performance with signs of decline from previous functioning), while SCD Profiles 2 and 3 represent Stage 1 (e.g., normal cognitive performance) (Jack et al., Reference Jack, Bennett, Blennow, Carrillo, Dunn, Haeberlein and Liu2018). Participants with SCD in Profile 1 (20%) scored below the mean on every cognitive test, with especially large deficits on the BVMTR, BNT, and the TMT-B. Comparatively, Profile 2 (53%) scored on average with the exception of minor deficits in processing speed (Digits-B and Digits-F) and Profile 3 (27%) scored above average on every test.
aMCI profiles were characterized by superior performance on all domains compared to the “typical” participant with aMCI (39%; Profile 1), dysnomic aMCI (38%; Profile 2), and severe multi-domain aMCI (24%; Profile 3). Using the NIA-AA criteria, we posit that Profile 1 may represent Stage 3 (e.g., impaired cognitive performance but maintained functional status). Given that the diagnosis of aMCI requires persevered functional status, Profiles 2 and 3 may have not fully met criteria for Stage 4 (e.g., a mild form of dementia where several domains are involved, progressive cognitive deterioration is evident, and functional status is impacted) (Jack et al., Reference Jack, Bennett, Blennow, Carrillo, Dunn, Haeberlein and Liu2018). A classification in between Stages 3 and 4 may best describe Profiles 2 and 3, whereby functional status is maintained but significant, progressive, impairment is evident across several domains. With regard to prior categorization of language (dysnomic) or visuospatial-dominant impairments in MCI (Bondi et al., Reference Bondi, Edmonds, Jak, Clark, Delano-Wood, McDonald and Galasko2014; Edmonds et al., Reference Edmonds, Delano-Wood, Clark, Jak, Nation, McDonald and Salmon2015; Machulda et al., Reference Machulda, Lundt, Albertson, Kremers, Mielke, Knopman and Petersen2019), our study suggests that roughly 20% of participants with SCD and 38% of participants with aMCI may display similar language or visuospatial deficits relative to each diagnostic category. Both deficits in language (Verma & Howard, Reference Verma and Howard2012) and visuospatial or navigational abilities (Hort et al., Reference Hort, Laczó, Vyhnálek, Bojar, Bureš and Vlček2007; Laczó et al., Reference Laczó, Vlček, Vyhnálek, Vajnerová, Ort, Holmerová and Hort2009) are often present in prodromal Alzheimer’s disease.
Profiles 1 of both the SCD and aMCI groups performed remarkably similar. In fact, the SCD Profile 1 scored identically or worse than the aMCI Profile 1 on several tests across all domains (i.e., BNT, BVMTR, ROCFT, CDT, TMT-A, Digits-F). Premorbid cognitive functioning and age should be considered when assessing the clinical relevance of these results, as older adults with mild deficits may be more likely to receive a diagnosis of SCD rather than MCI after considering age-adjusted norms. That is, the overlap may be due to age-related diagnostic bias in the SCD group. The natural decline in cognition with advancing age is reflected in age-adjusted cognitive norms, and the cognitive performance of the older patient may be interpreted as normal even if the older individual scores the same as the younger patient diagnosed with aMCI. Another possible explanation revolves around cognitive reserve, as the interaction between age and cognitive reserve may explain the differences seen in cognitive phenotypes (Stern, Reference Stern2012), especially given the high level of educational attainment across all SCD profiles.
Progression to MCI or Dementia
With respect to progression to MCI or dementia, SCD participants from Profile 1 progressed more quickly than participants from Profiles 2 or 3, but these differences in progression did not reach statistical significance after controlling for age, sex, and education. This was likely due to issues of statistical power, as sensitivity analyses found that unadjusted hazard ratios were statistically significant for Profile 1 in comparison to Profile 2 (p < .001) and Profile 3 (p = .01). Alternatively, it may be that the progression rates are better explained by the significant differences in age and sex. Jessen and colleagues (Reference Jessen, Amariglio, Buckley, van der Flier, Han, Molinuevo and Sikkes2020) identified three major groups of those with SCD: reversible SCD, stable SCD, and converters. Our study cannot suggest that baseline cognitive phenotypes were driving the different rates in progression to MCI/dementia seen by the Kaplan–Meier curves. However, Bessi and colleagues (Reference Bessi, Mazzeo, Padiglioni, Piccini, Nacmias, Sorbi and Bracco2018) found that long-term verbal memory (delayed 24 hr) was particularly affected in those with SCD who progressed to Alzheimer’s disease. Other factors may be at play too, such as temporal stability in SCD (Wolfsgruber et al., Reference Wolfsgruber, Kleineidam, Wagner, Mösch, Bickel, Lϋhmann and Brettschneider2016), cognitive reserve (Mazzeo et al., Reference Mazzeo, Padiglioni, Bagnoli, Bracco, Nacmias, Sorbi and Bessi2019), and apolipoprotein E ϵ4 (Ali, Smart, & Gawryluk, Reference Ali, Smart and Gawryluk2018).
For aMCI, our study provides evidence for a dose–response relationship between baseline level of impairment and risk of dementia. We suggest the existence of two subtypes of multi-domain aMCI: dysnomic aMCI (Profile 2) and severe multi-domain aMCI (Profile 3, i.e., deficits across all domains). Participants with severe multi-domain aMCI progressed more quickly to dementia than participants with dysnomic aMCI after controlling for age, sex, and education, further suggesting the relationship between baseline level of impairment and progression to dementia. Similarly, those with dysnomic aMCI progressed more quickly than participants with mild impairment (Profile 1) after controlling for age, sex, and education. Nettiksimmons and colleagues (Reference Nettiksimmons, DeCarli, Landau and Beckett2014) found that 80% of participants with aMCI who were neurobiologically similar to controls (e.g., on β-amyloid, tau, hippocampal, and ventricle volume) did not progress to dementia. We speculate that while the cognitive impairment between Profiles 1 of SCD and aMCI were similar, the underlying neuropathology could be different. Future work should examine the neurobiological underpinnings of latent cognitive phenotypes.
Machine Learning Accuracy
We used machine learning to examine heterogeneity within the cognitive phenotypes and to identify the best neuropsychological tests for classifying cognitive phenotypes. Classifying SCD profiles with the machine learning algorithm was less accurate in comparison to aMCI (20.86% vs. 7.80% classification error rate). However, it should be noted that a success rate of 79% and 92%, respectively, still shows that the method is quite robust, even with our relatively small sample sizes. After calculating interquartile ranges for the SCD and aMCI groups (Supplemental Table 1), we found that classification may have been less accurate in SCD due to lower variability in cognitive performance, potentially exacerbated by ceiling effects. Alternatively, SCD profiles may have been influenced to a greater extent by age, affective symptomatology, and education, despite no group-level differences. That is, the random forest algorithm would err when it is only classifying phenotypes by cognitive performance in a diagnostic category that is more likely to be influenced by contextual factors such as affective symptomatology (Balash et al., Reference Balash, Mordechovich, Shabtai, Giladi, Gurevich and Korczyn2013).
Cognitive Tests that Best Predict Phenotypes
Out of the 19 tests that were used, the machine learning algorithm identified the TMT-B as the most effective test at discerning cognitive phenotypes in aMCI and among the most effective tests at discerning cognitive phenotypes in SCD. In fact, even if this test had been considered traditionally as a test of executive function, performance also relies on intact visual search, attention, and psychomotor speed. This has great clinical utility given that the TMT-B and TMT-A are non-proprietary, can often be administered in less than 12 min (or less than 8 min if using more conservative 150 and 300 s cutoffs for TMT-A and TMT-B, respectively), and have been validated for use in many languages. In addition to the TMT-B, several other tests (BNT, BVMTR, and the VFT-V) best discriminated SCD Profile 1 from the other two SCD profiles. Given that the deficits experienced by participants from Profile 1 map onto the mildest form of aMCI in our study, these tests may be sensitive to identifying participants with SCD who have legitimate cognitive deficits. Clinicians would best be served by providing supports and services to these participants with actual deficits, rather than the 80% “worried well” who perform rather remarkably despite having memory complaints.
The random forest machine learning algorithm is highly useful when paired with clustering techniques (e.g., latent profile/class analysis, cluster analysis) to estimate the relative importance of different cognitive tests within each phenotype classification. It has been used in the past to create weights for neuropsychological tests to discriminate diagnostic groups (Llano et al., Reference Llano, Laforet and Devanarayan2011), and this methodology could be extended to other classification systems such as the NIA-AA criteria.
As investigators move toward a continuum approach to classifying Alzheimer’s disease (Jack et al., Reference Jack, Bennett, Blennow, Carrillo, Dunn, Haeberlein and Liu2018), clustering techniques paired with machine learning may help refine classification and detection. Indeed, our results suggest that there may be an intermediate staging between Stage 3 and Stage 4 of the NIA-AA criteria based on our clustering of aMCI, and the machine learning algorithm reported the cognitive tests that were most associated with these phenotypes. Moreover, knowing the differential contribution of specific tests to diagnostic classification may not only save clinicians and patients time and money, but it may also improve the early detection of progression to MCI or dementia.
Limitations
This study was limited by missing data, though persons with severe missingness were excluded and sophisticated, predictive mean matching multiple imputation was used on others. While we provided estimates of progression to a more severe cognitive status, the number of years of follow-up was limited. This study was limited in its examination of MCI by only including older adults with the amnestic variant of MCI. Future work should use clustering methodologies to better understand subpopulations within non-aMCI and their corresponding rate of progression. We also could not estimate symptom duration at the time of entry, which is relevant when estimating risk of progression. Some studies use more conservative ceilings for TMT-A and TMT-B at 150 and 300 s, respectively. Our use of 180 and 500 s allowed for greater variability in those with strong executive dysfunction or poor processing speed, but this may be considered a limitation. Genotyping, neuroimaging, and biochemical assays were unavailable for all participants in this study and may be helpful in the future to better understand the etiology of these cognitive phenotypes across both groups. Future work will be needed to better ascertain progression estimates in both SCD and aMCI phenotypes given the limited follow-up time for participants in this study.
CONCLUSION
Within diagnoses of SCD and aMCI, participants differ systematically and can be categorized into distinct latent cognitive phenotypes. Additionally, these phenotypes convert to a more severe form of impairment at varied rates. Classifying participants with SCD was more difficult for the machine learning algorithm, suggesting lower variability in terms of cognitive performance compared to the aMCI group. Our results suggest that classic diagnostic categories may not be sufficient to describe the neuropsychological profile and risk of progression, and further stratification within aMCI and SCD groups could be useful. Clinicians should acknowledge that great cognitive heterogeneity exists within older adults without dementia seeking neuropsychological consultation and should be mindful that these impairments may require vastly different management, supports, and services.
ACKNOWLEDGMENTS
This work was supported in part by funds from the University of South Florida Nexus Initiative (UNI) Award, the European Regional Development Fund – Project ENOCH (#CZ.02.1.01/0.0/0.0/16_019/0000868), and by the Institutional Support of Excellence 2. LF UK (#699012).
CONFLICT OF INTEREST
The authors have nothing to disclose.
SUPPLEMENTARY MATERIALS
To view supplementary material for this article, please visit https://doi.org/10.1017/S1355617720001046.


