Introduction
Most cropping fields are weed infested, and increasingly many crop-infesting weed species exhibit some level of herbicide resistance (HR). In many systems, crop weed infestations are frequently dominated by only one or two species that are well adapted to the prevailing agroecosystems (Llewellyn et al. Reference Llewellyn, Ronning, Ouzman, Walker, Mayfield and Clarke2016). For example, in southern Australian cropping fields, rigid ryegrass (Lolium rigidum Gaudin) dominates due to adaptation in growth and development patterns that now closely mimic those of wheat (Triticum aestivum L.) (Llewellyn et al. Reference Llewellyn, Ronning, Ouzman, Walker, Mayfield and Clarke2016).
A biological characteristic of many important Australian crop weeds, such as L. rigidum, is that the majority of seed is retained on the plant at maturity, late into the season (Walsh and Powles Reference Walsh and Powles2014). This “crop-mimicking” characteristic may be beneficial for the weed, because seeds that are retained on the plant, and above harvest cutter height, will be collected by the combine harvester. Most weed seeds collected in this way are then expelled from the harvester along with the unwanted chaff and straw. This results in the even dispersal of weed seeds behind the harvester and decreases patchiness and intraspecies weed competition (Izquierdo et al. Reference Izquierdo, Blanco-Moreno, Chamorro, Gonzalez-Andujar and Sans2009). Wider weed seed dispersal also increases the mixing of genetic material, thereby promoting the evolution of weeds with greater genetic diversity. In addition, collection of weed seed with the crop at harvest typically leads to some contamination of the crop seed (Michael et al. Reference Michael, Owen and Powles2010), and sowing contaminated crop seed aids weed dispersal both within the field and across landscapes, as reviewed in Norsworthy et al. (Reference Norsworthy, Ward, Shaw, Llewellyn, Nichols, Webster, Bradley, Frisvold, Powles, Burgos, Witt and Barrett2012). Fortunately, this biological attribute of weeds retaining their seed at harvest now provides an opportunity for weed seed destruction using harvest weed seed control (HWSC).
HWSC describes a range of weed control tactics that are designed to capture and destroy weed seeds during the crop harvest process (Walsh et al. Reference Walsh, Newman and Powles2013). HWSC reduces the number of seeds entering the weed seedbank and can help, over time, to drive annual weed populations to very low levels, even if the process is not 100% effective at removing viable weed seeds (Walsh et al. Reference Walsh, Newman and Powles2013). HWSC systems target the chaff fraction of harvest residues, which, when existing harvesters are set up for HWSC, typically contains almost all of the weed seed (Broster et al. Reference Broster2016). Some systems act solely on this fraction (i.e., seed destructors, chaff cart, chaff tramlining, and chaff lining), while others act on both the chaff and straw residues (i.e., narrow windrow burning and the bale direct system) (Llewellyn et al. Reference Llewellyn, Ronning, Ouzman, Walker, Mayfield and Clarke2016; Walsh et al. Reference Walsh, Harrington and Powles2012). HWSC is becoming widely adopted in Australian broad-acre crops, and its use is likely to increase (Llewellyn et al. Reference Llewellyn, Ronning, Ouzman, Walker, Mayfield and Clarke2016; Walsh et al. Reference Walsh, Ouzman, Newman, Powles and Llewellyn2017). HWSC provides a nonherbicide weed control option and joins a growing collection of tactics that can be used in integrated weed management.
Herbicides are the main weed control tactic used in crop production, and there is a tendency for an herbicide to be used persistently and without diversity, leading to HR evolution. HWSC is used at the end of the growing season following herbicide use, so weeds surviving herbicide treatment are exposed to HWSC. By targeting weed seeds present late in the growing season with an alternative control, HWSC can provide protection from HR for earlier-applied herbicides; however, the level of protection will likely depend on the efficacy of both the herbicide(s) and the HWSC. Weed population modeling is a powerful tool for predicting HR evolutionary dynamics under different management strategies (Neve et al. Reference Neve, Vila-Aiub and Roux2009; Renton et al. Reference Renton, Busi, Neve, Thornby and Vila‐Aiub2014). Integrated spatial modeling is especially useful to facilitate a detailed examination of the early stages of HR evolution, in the years before resistance becomes noticeable in the field (Somerville et al. Reference Somerville, Powles, Walsh and Renton2017a). In addition, the rate of combination of initially rare, multiple forms of resistance within individual plants is more realistically portrayed with an integrated spatial model, such as SOMER (Somerville et al. Reference Somerville, Powles, Walsh and Renton2017a).
HWSC, when used proactively, may delay the evolution of HR, but this role of HWSC has not been investigated. Moreover, the efficacy of HWSC in delaying HR evolution is likely to depend on the frequency and efficacy of HWSC use, as well as the level of herbicide efficacy. Therefore, this study used the SOMER model to predict the effects of HWSC on weed densities and HR evolution when used in conjunction with herbicides and to assess how these predictions are affected by varying HWSC frequency (annual vs. less frequently), HWSC efficacy, and herbicide efficacy.
Materials and Methods
Model Structure: Incorporation of HWSC
SOMER is an integrated spatial model that simulates the evolution of HR in a weed population in a crop field over several years (Somerville et al. Reference Somerville, Powles, Walsh and Renton2017a). It is based on previous nonspatial models of HR evolution (Neve et al. Reference Neve, Diggle, Smith and Powles2003; Renton et al. Reference Renton, Diggle, Manalil and Powles2011; Somerville et al. Reference Somerville, Powles, Walsh and Renton2017b) and written in R (R Core Team 2014). It is currently parameterized to represent L. rigidum weeds in wheat cropping systems. Integrated spatial modeling represents the location and genotype of every weed plant and seed within a field, localized pollen and natural weed seed dispersal, seed dispersal by harvesting equipment, and localized inter- and intraspecies competition. For the current study, the SOMER model, applied to L. rigidum in Australian winter wheat (Somerville et al. Reference Somerville, Powles, Walsh and Renton2017a) was modified to include HWSC. Weed seeds produced within a cropped field can suffer five possible fates during crop harvest (Figure 1), but we grouped these into three possible outcomes for the weed seeds at harvest: seeds that were not collected by the harvester and were therefore retained primarily at the source (Figure 1C); seeds removed or destroyed by HWSC (Figure 1D and G); and seeds dispersed behind the harvester (Figure 1F and H). Therefore, overall HWSC efficacy depends on two model parameters: the proportion of newly produced weed seed collected by the combine harvester and the proportion of this collected weed seed that is destroyed or removed from the field. The use of GPS-guided harvesting is assumed, such that the harvester follows the same path, and the collected seeds that survive HWSC are thus dispersed behind the harvester in the same direction each year (Blanco-Moreno et al. Reference Blanco-Moreno, Chamorro, Masalles, Recasens and Sans2004; Somerville et al. Reference Somerville, Powles, Walsh and Renton2017a).

Figure 1 Alternative fates of weed seeds at harvest time (A). Most seeds are collected into the grain harvester (B). However, some seeds are not collected by the combine harvester, because the seeds are already shed or because seed head height is lower than that of harvest height (C). Other seeds are misdirected within the harvester and avoid HWSC. Misdirected seeds may be inadvertently removed with the grain (D), or ejected from the harvester (F), leaving successfully drafted seeds (E). Additionally, when only the chaff fraction is treated with HWSC, some seeds will be incorrectly drafted in with the straw, which is then dispersed onto the field (F). Typically most captured seeds are destroyed (G), but some seeds survive HWSC when the treatment is not 100% effective (H).
Investigations: Combining Weed Control Tactics
Using the new version of the integrated spatial SOMER model, three investigations were conducted to investigate the effects of HWSC on weed seed numbers and HR evolution. All simulations represented an area of 81 ha divided into 5,625 subpopulations, each within a 144-m2 sector, with the edges of the 81-ha area “wrapped” (Somerville et al. Reference Somerville, Powles, Walsh and Renton2017a). The simulations were based on the following assumptions: (1) HR was conferred by two independent semidominant genes (Powles and Yu Reference Powles and Yu2010), both at an initial allele frequency of 10−6, with one gene conferring resistance to a PRE herbicide, and one to a POST herbicide; (2) annual use of an effective presowing weed control to which resistance did not evolve; and (3) weeds emerged throughout the growing season, divided into five discrete sequential cohorts (Figure 2) (Somerville et al. Reference Somerville, Powles, Walsh and Renton2017a). We also assumed that a very small number of weed seeds contaminate the crop seeds at planting, at a consistent average rate of 0.1 weed seed m−2 yr−1 (Michael et al. Reference Michael, Owen and Powles2010); in these simulations the contaminating seeds are assumed to be sourced externally, from an unselected population. The model parameters are outlined in Table 1, with more details on the separate weed cohorts outlined in Table 2.

Figure 2 The sequential emergence pattern of many important crop weeds. Weeds emerging early in the season, before crop sowing, are designated here as Cohort 1. Weeds emerging after crop sowing into Cohort 2 are always treated with both a PRE herbicide and a POST herbicide. When a longer-acting PRE herbicide is used, the weeds emerging in Cohort 3 are also treated with two sequential herbicides. The weeds in Cohorts 2 through 4 are small enough to be vulnerable to the POST herbicide. Harvest weed seed control (HWSC) targets survivors from every cohort, except possibly the latest-emerging weeds, meaning that most weeds are exposed to three weed control tactics.
Table 1 Parameter values used throughout these simulations.

Table 2 Probability-based mortality rates for herbicide-susceptible weeds in Cohorts 2–5 that were treated with herbicides before the use of HWSC.Footnote a

a Mortality rates indicate the probability of a susceptible weed that germinated in Cohorts 2–5 being killed.
b “Average kill of all weeds” in the notes column accounts for the lowered fitness of later cohorts.
c Weeds in these cohorts are affected by both postsowing herbicide applications, giving an effective control rate in susceptible weeds in these cohorts of 0.97+0.03×0.97=0.9991.
Annual weed control in Australian cropping systems typically involves individual herbicide treatments, sequentially applied before, during, and then after the crop is seeded (Llewellyn et al. Reference Llewellyn, Ronning, Ouzman, Walker, Mayfield and Clarke2016). In this study, it was assumed that an average 40% of weed seedlings emerged before the crop was seeded, and 97% (of this 40%) were destroyed by the presowing knockdown herbicide application(s). It is a common farming practice to then apply a PRE herbicide at sowing and a POST in-crop herbicide later, which act across more weed cohorts (Figure 2). PRE herbicides have varying lengths of soil-residual activity on weed species, and we have defined a shorter-acting PRE herbicide (i.e., with shorter soil-residual activity, killing 70% of full weed equivalents) as the PRE part of the “Shorter&Post” herbicide sequence. Alternatively, a longer soil-residual PRE herbicide was modeled, and this is defined as the PRE herbicide used in the “Longer&Post” herbicide sequence. Each herbicide in the Longer&Post herbicide sequence independently killed an average of 95% of weed seedlings that emerged at/after crop sowing. The two Longer&Post herbicides were each able to maintain relatively low weed numbers when used alone, and so the main purpose of examining the Longer&Post herbicide sequence was to evaluate whether both of these herbicides can be protected from resistance evolution by combining their use with annual HWSC (Figure 3). These herbicide sequences are very similar to those examined in previous nonspatial simulations by Somerville et al. (Reference Somerville, Powles, Walsh and Renton2017b).

Figure 3 Representation of the lifecycle of each weed subpopulation growing within a sector of a cropped field as simulated in the new SOMER spatial model. The arrow with the dotted outline from Cohort 3 weeds indicates that the PRE herbicide was simulated as either shorter acting (only affecting Cohort 2 weeds) or longer acting (affecting weeds in Cohorts 2 and 3). The POST herbicide affected weeds in Cohorts 2, 3, and 4. The yellow and orange rectangular boxes show stochastic activities undertaken within the annual weed lifecycle, within each subpopulation. The blue circles indicate annual herbicide applications used in this study. The orange diamond-shaped boxes on the right-hand side linked by orange dashed arrows show pollen and natural seed movement within and between subpopulations. The purple dotted arrows on the right-hand side show seed movement by the combine harvester. In these simulations, HWSC removed up to 88% of the annually produced seed (purple square). Each year’s weed plants were divided into cohorts, owing to their sequential germination. The use of cohorts enabled alternate crop competition and herbicide use on weeds with different germination and emergence dates.
Investigations: Alterations in Efficacy and Frequency
Investigation 1: Efficacy of HWSC and the Shorter&Post Herbicides
Investigation 1 examined how the level of HWSC efficacy affected weed seed numbers and HR evolution over time, when used with an herbicide sequence including a shorter-acting, soil-residual PRE herbicide followed by an effective POST herbicide. This sequence is called the “Shorter&Post” herbicides, with the levels of control listed in Table. 2. The alternate levels of HWSC efficacy that were investigated with this herbicide sequence are detailed in Tables 3 and 4. The effects of varying both seed-collection probability (Table 3) and seed-destruction probability (Table 4) were considered. Twenty-five replicate simulations were conducted for every parameter combination in this investigation and in the following investigations to account for stochastic variation in model parameters.
Table 3 Relative probabilities of weed seed fates, assuming different seed-collection probabilities.Footnote a

a Letter codes (a–h) refer to possible seed fates in Figure 1.
Table 4 Relative probabilities of weed seed fates, assuming different seed destruction probabilities.Footnote a

a Letter codes (a–h) refer to possible seed fates in Figure 1.
Investigation 2: Efficacy of HWSC and the More Effective (Longer&Post) Herbicides
Investigation 2 examined how the level of HWSC efficacy affected weed seed numbers and HR evolution when used with a very effective herbicide sequence including a longer soil-residual PRE herbicide, followed by an effective POST herbicide. This sequence is called the “Longer&Post” herbicides, with the levels of control listed in Table 2. The alternate levels of HWSC efficacy investigated here are outlined in Tables 3 and 4 and are identical to those examined in Investigation 1.
Investigation 3: Reducing the Frequency of Use of HWSC
Investigation 3 examined how a lower frequency of HWSC (using HWSC less than once per year) affected weed seed numbers and HR evolution over 25 yr. This investigation was conducted using an average HWSC efficiency of 85.5%. This HWSC efficacy comprises 90% seed collection and 95% seed destruction, which equates to 10% seed uncollected, 85.5% destroyed, and 4.5% dispersed behind the combine harvester. In the years that HWSC was not used, an average 90% of seed was collected into and then dispersed behind the combine harvester.
Results and Discussion
Investigation 1: Efficacy of HWSC and the Shorter&Post Herbicides
The Shorter&Post herbicide sequence (Table 2) resulted in rapid resistance evolution to the more effective POST herbicide (Somerville et al. Reference Somerville, Powles, Walsh and Renton2017b). Adding HWSC lengthened the number of years of effective herbicide control. To maintain low weed numbers for at least 25 yr with the Shorter&Post herbicide sequence required annual HWSC with an average efficiency above 72% (Figure 4).

Figure 4 The effect of changes in HWSC efficiency on the average number of weeds per square meter when the Shorter&Post herbicides (Table 2) were used. (A) Seeds not collected during harvest. (B) Undestroyed seeds collected and then dispersed behind the combine harvester. The different scenarios (blue diamond, red circle, and black triangle symbols) were created by altering the probabilities that seeds were destroyed by HWSC or removed from the field. More information on inputs to each scenario is provided in Table 3, column 4 (A) and Table 4, column 4 (B). Each line represents one of 25 replicates, run for 25 yr. The lines are truncated at weed densities of approximately 30 plants m−2, because this is a reasonable estimate of when L. rigidum densities are likely to impact yield enough to cause a change of practice.
Current best farming practice also aims to limit the number of HR genes within a field. These simulations showed that low-resistance gene frequencies were more difficult to achieve than constantly low weed numbers and required a higher level of weed control. Annual HWSC needed to be at least 85% effective when combined with the Shorter&Post herbicides to halt any increase in the percentage of herbicide-resistant weeds (Figure 5). Any reduction in the efficacy of HWSC resulted in many scattered outbreaks of HR across the simulated 81-ha field area. Multiple HR evolution, where weeds contain resistance to both herbicides, was also more likely (although still rare) when more of the seeds were collected and dispersed across the field by the harvester (Figure 5, lower tier, LHS).

Figure 5 Changes over time in proportions of different genotypes in weed populations treated with the Shorter&Post herbicides (Table 2) over 25 yr, when seeds were not collected during harvest (upper tier) or were dispersed (lower tier) behind the combine harvester. The probability of seed death changes from left (zero collected/killed) to right (90% killed). The different lines represent the proportion of the weeds present at harvest that are herbicide susceptible (SS), resistant to the shorter-acting PRE herbicide (R_shorter), resistant to the POST herbicide (R_post), or multiply resistant (M). More information on inputs to each scenario is provided in Table 3, column 4 (upper tier) and Table 4, column 4 (lower tier). Each figure includes five replicates (chosen from 25) to display a range of stochastic results.
Investigation 2: Efficacy of HWSC and the More Effective (Longer&Post) Herbicides
The more effective Longer&Post herbicide sequence benefited from the addition of annual HWSC. HWSC with an efficacy as low as 45% was effective in keeping weed numbers low for at least 25 yr in 49 of 50 replicate simulations (Figure 6). In all replicates, the evolution of single-gene resistance was slowed when HWSC was added, which in turn also lowered the likelihood of multiple HR occurring (Figure 7).

Figure 6 The effect of changes in HWSC efficiency on the average number of weeds per square meter when the Longer&Post herbicides (Table 2) were used. (A) Seeds not collected during harvest. (B) Undestroyed seeds dispersed behind the combine harvester. The different scenarios (blue diamond, red circle, and black diamond symbols) were created by altering the probabilities that seeds were destroyed by HWSC or removed from the field. More information on inputs to each scenario is provided in Table 3, column 4 (A) and Table 4, column 4 (B). Each line represents one of 25 replicates, run for 25 yr. The lines are truncated at weed densities of approximately 30 plants m−2, because this is a reasonable estimate of when L. rigidum densities are likely to impact yield enough to cause a change of practice.

Figure 7 Changes over time in proportions of different genotypes in weed populations treated with the Longer&Post herbicides (Table 2) over 25 yr, when some seeds were not collected during harvest (upper tier) or were dispersed (lower tier) behind the combine harvester. The first four graphs in each row show the wide variability between different replicates when none of the seeds were destroyed by HWSC. In the fifth graph, 45% to 47.5% of seed was killed by HWSC, and some resistance developed. When more than 45% of the seeds were destroyed by HWSC, resistance did not develop (unpublished data). The different lines represent the proportion of the weeds present at harvest with alternate genotypes. More information on inputs to each scenario is provided in Table 3, column 4 (upper tier) and Table 4, column 4 (lower tier). See caption to Figure 5 for definitions of abbreviations.
When no HWSC was used (no seed destroyed during harvest) with the Longer&Post herbicide sequence, the results of different replicates were highly variable (Figure 7); when most of the seeds were collected and dispersed behind the harvester (Figure 7, upper row), 15 of 25 replicates evolved multiple HR over 25 yr. In contrast, when the weed seeds were not collected into the harvester (Figure 7, lower row), multiple HR occurred less often (in 13 of 25 replicates over 25 yr).
If HWSC was incorporated into these simulations, there was a 5- to 8-yr delay between the appearance of multiple HR and the occurrence of a meaningful growth in weed numbers. This delay was primarily due to the very low weed seedbank that resulted from the use of Longer&Post herbicide sequence with annual HWSC (Figure 6). However, due to the stochastic nature of these simulations, one replicate with 45% HWSC efficacy did evolve multiple HR (Figure 7). Multiple HR also occurred in one of a series of supplementary parameterizations with high kill rates that used the more effective Longer&Post herbicides and an HWSC effectiveness on collected seed of 92% (Supplementary Figure S1). Multiple HR was more likely in the early years, when the seedbank was larger, but was possible in any replicate, in any year, due to the inclusion of a realistic rate of rare spontaneous mutation.
Investigation 3: Reducing the Frequency of Use of HWSC
HWSC can be used every year but can also be used intermittently. If HWSC efficacy was kept at 86% and HWSC was still used annually, then the less-effective Shorter&Post herbicides kept weed numbers low for at least 25 yr, although this did not typically remove all HR from the 81-ha field area. When HWSC was used less frequently with this less effective herbicide sequence, both multiple HR and high weed numbers occurred more frequently and increased more rapidly (Figure 8).

Figure 8 Illustration of how spatial patterns in weed density and the occurrence of multiple HR (M) are influenced by the frequency of HWSC used with the Shorter&Post herbicide sequence. Figures show weeds per square meter in year 25, with 25 replicates of each scenario. (A) HWSC used every second year. (B) HWSC used every third year. (C) HWSC not used. After 25 yr, each 81-ha field contained some level of multiple HR. The “M” symbols indicate the year that multiple HR occurred, for example, “M8” developed its first multiply resistant seeds in year 8 of the simulation and also contained seeds that were susceptible or were resistant to just one of the herbicides. Note that although low levels of multiple HR existed for several years, the large numbers of weeds in B and C in year 25 are due to POST HR (B).
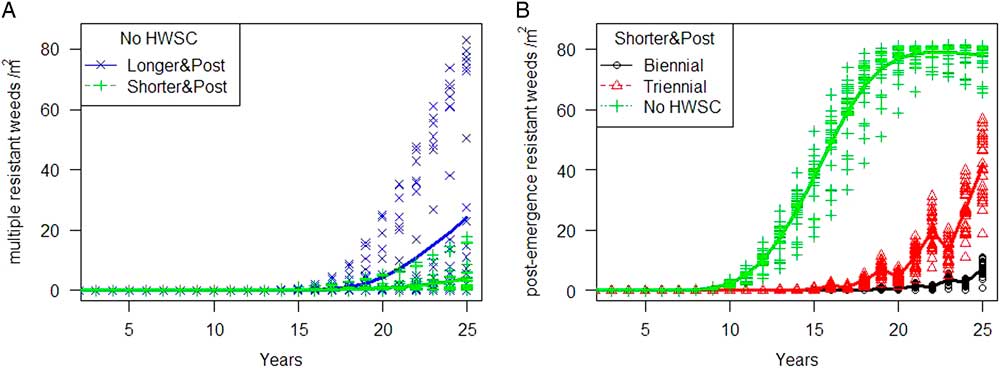
Only in the simulations without any HWSC did a noticeable growth in multiple herbicide-resistant weeds occur within the 25 yr of these simulations (Figure 9A). However, several of the Shorter&Post herbicide simulations resulted in large weed numbers, with resistance to the higher efficacy POST herbicide developing first (Figure 9B). Significant levels of multiple HR only evolved in the Shorter&Post herbicide simulations after large numbers of POST herbicide-resistant weeds were widespread. New HR gene mutations had a small chance of occurring in all these simulations, with a probability of new mutations of 10−8. When the majority of the weeds within a simulation carried single-gene resistance to just one of the herbicides, it is statistically more likely that a seed of that genotype would be the one to evolve a mutation conferring resistance to another herbicide, creating multiply resistant seeds.

Figure 9 Changes in the number of weeds of the different genotypes resulting from the four worst scenarios in Investigation 3, with solid lines indicating the average results. (A) The development of multiple HR in the absence of HWSC. (B) The development of resistance to POST herbicides when the less-efficient Shorter&Post herbicides were used with limited HWSC. Graphs include data from 25 replicates.
In contrast, when annual or biennial HWSC was used with the Longer&Post herbicides, this sequence provided sufficient weed control to gradually eliminate all HR genes and keep weed numbers below 2 m−2 for at least 25 yr (Figure 10A). Weed numbers only increased in the Longer&Post treatments when multiple HR arose, which occurred rarely with HWSC used every third year (Figure 10B) and more often without any HWSC (Figure 10C). Due to the use of two sequential effective herbicides (Longer&Post), the multiple HR within the 81-ha area generally began once, from a single rare individual. This rarity (less than one new outbreak of multiple HR per year within any 81-ha area) meant there was a great deal of variability in when multiple HR established in replicates that used Longer&Post herbicides with infrequent HWSC (Figure 10B and 10C).

Figure 10 Illustration of how spatial patterns in weed density and multiple HR are influenced by the frequency of HWSC when used with the Longer&Post herbicide sequence. Figures show weeds per square meter in year 25, with 25 replicates of each scenario. (A) HWSC used every second year. (B) HWSC used every third year. (C) HWSC not used. After 25 yr, each 81-ha field area either contained no herbicide-resistant weeds (symbol “S”), susceptible weeds and weeds resistant to the longer-acting PRE herbicide (“Rpre”), or susceptible weeds and weeds resistant to the POST herbicide (“Rpost”). When the area developed a weed population with more than one multiply resistant seed, the “M” symbol indicates the year that multiple HR occurred, for example, “M17” developed its first multiply resistant seeds in year 17 after the simulation began. Note that the dense patches of weeds in C are due to multiple HR (Figure 9A).
In the simulations reported here, the proactive regular use of effective HWSC was shown to be capable of delaying the increase in weed numbers that is a result of HR evolution, or even avoiding it completely, and could provide the extra control needed to eliminate rare HR genes from weed populations. When HWSC frequency of use was reduced, so that the seeds were only targeted every second year (biennial use), the simulations using two highly effective herbicides (the Longer&Post scenario) still maintained low resistance levels, as long as five specific requirements were met: (1) effective presowing knockdown herbicides were used; (2) the two herbicides were each consistently killing 95% of all postsowing weeds; (3) HWSC was introduced while the frequency of resistance was still low; (4) HWSC consistently removed or killed at least 85% of all seeds; and (5) HR did not re-enter the field via imported pollen or seed. In addition, these results imply that if identifying and successfully removing rare early patches of multiply resistant weeds was possible and these five requirements were strictly followed, then HWSC frequency could be safely reduced still further, to once every 3 yr (triennial use). If more rotation of crops and herbicides was employed, in contrast to the extreme continuous wheat modeled here, we would expect the benefits of proactive HSWC to be even greater, as more resistance alleles would be removed from the population by HWSC for each selection event. However, the relative benefits of the different strategies investigated would be the same.
The advantages to be gained by using two herbicides that kill large percentages of weeds are more obvious here, due to the spatial nature of these simulations. The realistic spatial separation within the SOMER model ensured that the evolution of multiple HR was rare, even with ineffective or infrequent use of HWSC, when compared with the more rapid evolution of multiple HR seen with nonspatial modeling of similar herbicide sequences (Somerville et al. Reference Somerville, Powles, Walsh and Renton2017b). Multiple HR was further slowed when any remaining viable seeds were not collected and then dispersed by the combine harvester. The dispersal of viable seeds across the field reduced the effective life of the herbicides by 1 yr (Somerville et al. Reference Somerville, Powles, Walsh and Renton2017a), due to a reduction in intraspecies competition, and also increased the rates of multiple HR evolution (Figures 5 and 7). The rare outbreaks of multiple HR observed in the scenarios using two herbicides that each killed more than 95% of weeds may be suitable for intensive patch management, although this can be difficult with outcrossing species that have an established field-wide presence (Somerville et al. Reference Somerville, Powles, Walsh and Renton2017a).
Combining proactive HWSC with multiple herbicides can be very effective at protecting these herbicides from resistance evolution, as HWSC targets the survivors of earlier-applied herbicides. In the current study, the efficacy of HWSC was assumed to remain constant over time; however, this may not be consistently true. These benefits of HWSC for reducing resistance evolution are only gained because the HWSC is used proactively, when weed numbers and resistance allele frequencies are still low. Weeds are always under some selection pressure to improve their survival, and if weed numbers and/or HR were higher when HWSC was introduced, then weeds would be under a stronger selection pressure to evolve resistance to HWSC (Walsh et al. Reference Walsh, Newman and Powles2013). Examples of heritable weed physiological changes that could decrease HWSC efficacy include lodging, shorter or prostrate growth habits, seed shatter, and earlier flowering (Ashworth et al. Reference Ashworth, Walsh, Flower, Vila‐Aiub and Powles2016). Evolution of resistance to HWSC is an area that should be researched both empirically and by simulation. In future studies, we will simulate the evolution of resistance to HWSC, as well as weed-spectrum changes resulting from HWSC.
This study did not examine the effect of herbicide-resistant weed seed contamination within crop seed, which could rapidly spread resistance across the field, if resistant weeds were allowed to produce seed and contaminate the crop seed. In fact, these simulations incorporated 0.01 unselected seeds m−2 yr−1 as contamination within the crop seed. When weed numbers are very low (as they were in later years of some of these simulations), this level and susceptibility of contaminating weed seeds will become more important in diluting resistance evolution and affecting resistance percentage calculations. Contamination of crop seed with herbicide-resistant weed seeds and the benefits of high levels of crop seed cleaning are thus interesting areas to investigate in further integrated spatial modeling. Individual patch treatment is another potentially useful management tool identified here to limit multiple HR evolution, which could also be investigated in further integrated spatial modeling.
Acknowledgements
We thank the staff and Ph.D students at the Australian Herbicide Resistance Initiative (AHRI) and the modelers in MR’s study group at the University of Western Australia for helpful discussions. AHRI is supported by the Grains Research and Development Corporation. No conflicts of interest have been declared.
Supplementary material
To view supplementary material for this article, please visit https://doi.org/10.1017/wsc.2018.9