


Introduction
Rhinitis is an inflammation of the nasal membranes. The most common cause of rhinitis is allergy; rhinitis can also result from non-allergic, infectious and autoimmune causes. Common symptoms of allergic rhinitis include sneezing, nasal congestion, rhinorrhoea, itchy nose and eyes, and a scratchy throat. It is essential to differentiate allergic rhinitis from other causes with a similar spectrum of symptoms, as the aetiology and management of these conditions differ.
In clinical practice, the diagnosis of allergic rhinitis is based on patients’ symptoms and history, physical examination findings, and results of blood tests, nasal cytology and skin-prick tests for common aeroallergens. There are advantages and disadvantages of these tests; some are invasive and some are not sufficient to determine allergic rhinitis in all cases.
Photographic red–green–blue (RGB) measurements provide an objective value to assess the colour of mucosa.Reference Tugrul, Degirmenci, Eren, Dogan, Meric Hafiz and Ozturan1 Such an objective measurement could aid the diagnosis of allergic rhinitis. This study aimed to evaluate the colour of nasal mucosa, which is easy to determine with a direct, non-invasive, objective photographic measurement, as an objective parameter of allergic rhinitis.
Materials and methods
Participants
Seventy-three patients with allergic rhinitis (allergy group) and 73 normal healthy individuals (control group) without nasal pathologies who attended to the out-patient clinic of the tertiary referral centre were included in the study (Figure 1). The exclusion criteria for both groups included: the presence of acute respiratory tract infection or chronic sinusitis, or a history of previous nasal surgery. Control group individuals were chosen after history taking and endoscopic nasal examination; none of these individuals had nasal pathologies, including allergic rhinitis. None of the study patients had received any medicine for allergic rhinitis in the month before the study.
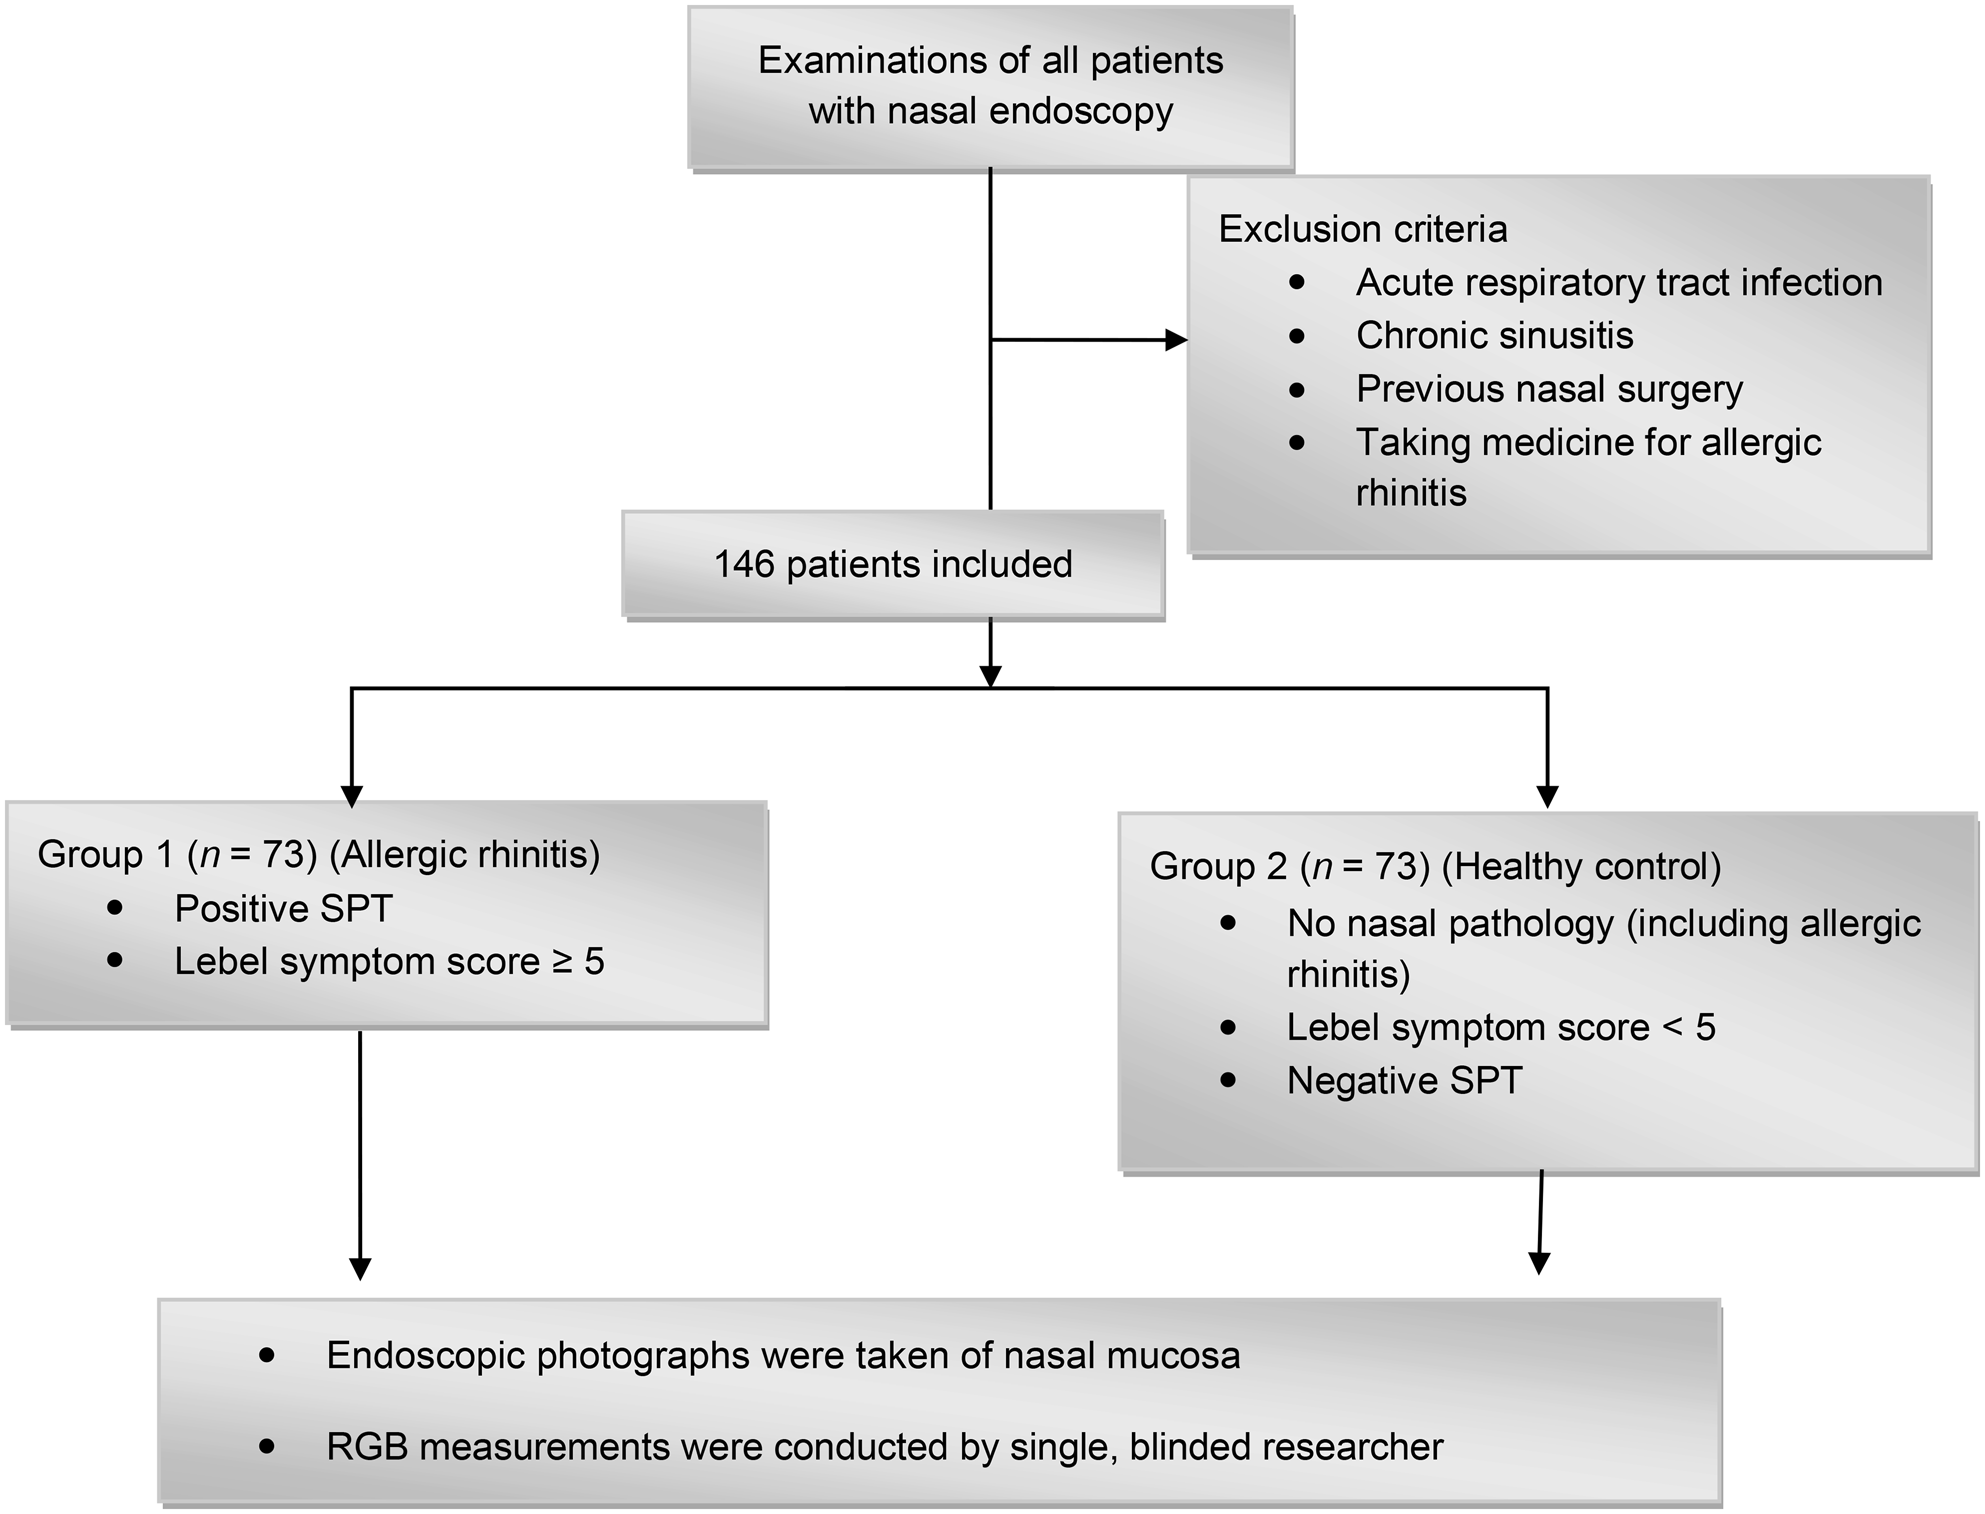
Fig. 1. Study flow diagram. SPT = skin-prick test; RGB = red–green–blue
Lebel Symptom Score Scale
Patients’ symptoms were assessed using the Lebel Symptom Score Scale (Table 1).Reference Lebel, Bousquet, Morel, Chanal, Godard and Michel2 The allergic rhinitis symptoms assessed included sneezing, rhinorrhoea, itchy nose and eyes, scratchy throat, and nasal congestion. A Lebel score of 5 and above was used as the inclusion criteria for a positive clinical history of allergic rhinitis. Healthy subjects with a Lebel Symptom Score below 5 were included in the control group.
Table 1. Lebel Symptom Score ScaleReference Lebel, Bousquet, Morel, Chanal, Godard and Michel2

Patients are considered positive for allergic rhinitis if total score is 5 or higher (maximum possible score = 11)
Skin-prick test
Patients underwent a skin-prick test for the following allergens: Dermatophagoides pteronyssinus, Dermatophagoides farinae, weed mix, epithelium mix, grass mix, tree mix and mould mix. The results were evaluated after 15 minutes, and wheals of 3 mm greater than the negative control were considered positive. All of the patients in the allergy group had positive skin-prick test results for at least one of the most common aeroallergens. All subjects in the control group had negative skin-prick test results.
Red–green–blue measurements
Endoscopic examinations were conducted using the same 4 mm, 0-degree endoscope and light source. Endoscopic photographs of the septum and both inferior turbinates were taken for all participants. All endoscopic photographs were taken holding the endoscope 1 cm above the nasal mucosa. Before using the endoscope, auto white balance was performed.
Each image was marked with standardised points at the anterior part of nasal mucosa on both sides (two points on the right side and two points on the left side of the anterior septum, and two points on each anterior part of both inferior turbinates). These points were numbered: 1 and 2 over the right inferior turbinate; 3 and 4 over the right side of the anterior septum; 5 and 6 over the left inferior turbinate; and 7 and 8 over the left side of the anterior septum (Figure 2).
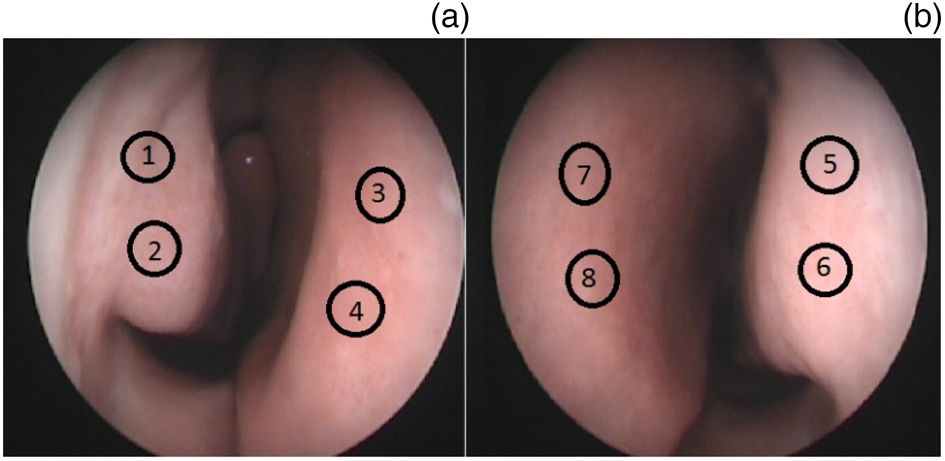
Fig. 2. Standardised measurement points at the anterior part of the nasal mucosa on both sides: (a) right side (1 & 2 = inferior turbinate; 3 & 4 = anterior septum), and (b) left side (5 & 6 = inferior turbinate; 7 & 8 = anterior septum).
The examinations and photography were conducted by the same otolaryngologist, using the same endoscope. The RGB measurements were performed by an otolaryngologist blinded to the study groups. The Adobe® Photoshop® Elements 7.0 software program was used to measure the numerical values of the RGB colour components at the standardised points.
Statistical analysis
The statistical tests were conducted using the Statistical Package for the Social Sciences software, version 13.0 for Windows (SPSS, Chicago, Illinois, USA). All quantitative variables were estimated using measures of central location (i.e. mean and median) and measures of dispersion (i.e. standard deviation (SD)). Data normality was assessed using the Kolmogorov–Smirnov test of normality. The independent t-test was used for comparing quantitative data (age, RGB values) between groups. The chi-square test was used to compare qualitative data (sex) between groups. Spearmen correlation analysis was conducted to evaluate the correlation between the Lebel symptom scores and the RGB values. Receiver operating characteristic analysis was performed to define the cut-off points of the RGB values.
Ethical considerations
Permission for the study (clinical trial registration number: NCT03070288) was obtained from the institutional ethics committee. All procedures performed in this study were in accordance with the ethical standards of the institutional research committee, and with the 1964 Helsinki declaration and its later amendments or comparable ethical standards. The investigators obtained written informed consent from each participant.
Results
Demographic information
The allergy group comprised 73 individuals (42 females and 31 males) with a mean age of 32.36 years. The control group comprised 73 individuals (45 females and 28 males) with a mean age of 34.85 years. There were no statistical differences between the two groups in terms of age and sex (p > 0.05) (Table 2).
Table 2. Demographic characteristics of the groups

SD = standard deviation
Lebel symptom scores
Allergic rhinitis symptoms were assessed using the Lebel Symptom Score Scale. The mean (± SD) Lebel Symptom Score Scale score was 8.78 ± 1.69 for the allergy group and 0.27 ± 0.59 for the control group (p < 0.05). There was no statistically significant correlation between the Lebel symptom scores and the RGB values (p > 0.05).
Skin-prick test results
Patients underwent a skin-prick test for the following allergens: D pteronyssinus, D farinae, weed mix, epithelium mix, grass mix, tree mix and mould mix. Positive reactivity was shown by 53 patients to D farinae, by 62 patients to D pteronyssinus, by 32 patients to weed mix, by 37 patients to epithelium mix, by 32 patients to grass mix, by 37 patients to tree mix and by 29 patients to mould mix. Twelve patients were positive to only one allergen; the remaining patients were positive to more than one allergen.
Red–green–blue values
The R values of the allergy group were higher than those of the control group, but the difference was not statistically significant at all points. Only the comparison of R4, R6, R7, R8 values revealed statistically significant differences between the two groups (p < 0.05; Figure 3) (4 = right anterior septum, 6 = left inferior turbinate, 7 and 8 = left anterior septum). The G values were significantly higher in the allergy group compared to the control group at all points (p < 0.05; Figure 4). The B values were significantly higher in the allergy group compared to the control group at all points (p < 0.05; Figure 5).

Fig. 3. Comparison of the red (R) values between groups (group 1 = allergy group, group 2 = control group). *p < 0.05; †p > 0.05

Fig. 4. Comparison of the green (G) values between groups (group 1 = allergy group, group 2 = control group). *p < 0.05

Fig. 5. Comparison of the blue (B) values between groups (group 1 = allergy group, group 2 = control group). *p < 0.05
Comparison of the separate colour components revealed a highly significant difference between the colours, with a colour sequence of: R followed by G followed by B (i.e. R was greater than G, and G was greater than B).
The cumulative R, G and B values at all points were higher in the allergy group, and there was a statistically significant difference between the allergy and control groups (p < 0.05; Figure 6).

Fig. 6. Sequence of the colour components of the mean red–green–blue (RGB) values: R is greater than G, and G is greater than B (group 1 = allergy group, group 2 = control group). *p < 0.05
Receiver operating characteristic analysis was conducted to define cut-off values of the RGB measurements for patients with allergic rhinitis. We did not find a statistically significant cut-off value for R colour, but G and B colours had significant cut-off values. The cut-off value for G colour was over 132.7, with 93.15 per cent sensitivity and 66.67 per cent specificity; the area under the curve was 0.85 (95 per cent confidence interval (CI) = 0.784–0.902) (p < 0.001). The cut-off value for B colour was over 130, with 72.60 per cent sensitivity and 80.25 per cent specificity; the area under the curve was 0.805 (95 per cent CI = 0.733–0.864) (p < 0.001; Figure 7 and Table 3).

Fig. 7. Receiver operating characteristic curves of the (a) red (R), (b) green (G), and (c) blue (B) values.
Table 3. Receiver operating characteristic analysis of red–green–blue values

AUC = area under the curve; CI = confidence interval
Discussion
The main outcomes of the present study are: (1) RGB measurements provide an objective value for assessing the colour of nasal mucosa; (2) the colour of the allergic nasal mucosa was significantly different to that of healthy nasal mucosa.
All colours in nature are formed by combinations of the three primary colours (red, green and blue) whose ratios vary from 0 to 255. A 100 per cent (255) mixture of these three colours is perceived as white, while a 0 per cent (0) mixture is perceived as black. As the tones of RGB colours differ, the colours we see change accordingly.Reference Yildirim, Degirmenci, Tugrul and Ozturan3 Using the Adobe Photoshop Elements 7.0 program, we were able to measure the RGB values of areas on endoscopic photographs.
The correlation between inflammation and the RGB colours of various tissues and mucosa has been investigated previously.Reference Tugrul, Degirmenci, Eren, Dogan, Meric Hafiz and Ozturan1,Reference Ozturan, Dogan, Yenigun, Veyseller and Yildirim4,Reference Osada, Arakawa, Sakamoto, Ueyama, Shibuya and Ogihara5 The objective results of RGB measurements can be used to definitively diagnose laryngopharyngeal reflux and assess treatment results.Reference Ozturan, Dogan, Yenigun, Veyseller and Yildirim4 Another study revealed a significant correlation between the RGB values of tympanic membrane images and the existence of effusion in the middle ear.Reference Tugrul, Degirmenci, Eren, Dogan, Meric Hafiz and Ozturan1 This indicated that RGB measurements can provide a useful and objective method for the diagnosis of otitis media with effusion.Reference Tugrul, Degirmenci, Eren, Dogan, Meric Hafiz and Ozturan1
The RGB measurements provide an objective means of assessing the colour of nasal mucosa. The G and B colour component values were significantly higher in the allergic rhinitis patients than in the healthy controls. The R colour component value was higher in allergic rhinitis patients, but the difference was not statistically significant at all points. The cumulative R, G and B values of all points were higher in the allergy group, with a statistically significant difference between the two groups.
• Red–green–blue (RGB) measurements can be used to investigate the inflammation of various types of tissues and mucosa
• The RGB measurements provide an objective value for assessing the colour of nasal mucosa
• The colour of nasal mucosa in allergic rhinitis patients is significantly different to that of healthy controls
• The G and B colour component values were significantly higher in allergic rhinitis patients than in healthy controls
• Photographic RGB measurements can be useful when nasal mucosa discolouration cannot be distinguished from normal tissue by the naked eye during endoscopic assessment
A study on autofluorescence imaging in ulcerative colitis showed that the G colour component was correlated with the existence of polymorphonuclear cells in the lamina propria and with crypt architectural irregularities.Reference Osada, Arakawa, Sakamoto, Ueyama, Shibuya and Ogihara5 There were significant differences in G colour component values between limited and extensive polymorphonuclear cell infiltration.Reference Osada, Arakawa, Sakamoto, Ueyama, Shibuya and Ogihara5
Allergic rhinitis patients’ nasal mucosa is infiltrated with eosinophils, neutrophils, lymphocytes and basophilic cells.Reference Yang, Okuda, Pawankar and Aihara6 As we know, there is high amount of eosinophil infiltration in allergic rhinitis patients’ nasal mucosa, which is probably the cause of bluish-grey discolouration.
Nasal examination of allergic rhinitis patients reveals a bluish-grey discolouration and oedema. Clear watery nasal draining may be seen. In some of the allergic rhinitis patients, blue- or purple-coloured shine under the eyes may be present (allergic shiner). A horizontal crease across the nasal supratip associated with habitual rubbing of the nose (allergic salute) may be seen. The posterior oropharyngeal wall may demonstrate ‘cobblestoning’.Reference Lim and Leong7 Examination is an important step for diagnosis, but these findings arise in allergic rhinitis patients in a differential spectrum and do not occur in every case.
We studied nasal mucosa discolouration using an objective method, to determine whether or not it is a promising diagnostic parameter in patients with possible allergic rhinitis. Photographic RGB measurements can be useful in patients with allergic symptoms where nasal mucosa discolouration cannot be distinguished from normal tissue by the naked eye during an endoscopic assessment.
The RGB measurements were conducted using the same equipment in this study. It is possible that the results would differ with a change of light source or cameras. Hence, validation studies must be performed so that this method can be used widely.
This method can be an option for making quick decisions and to contribute to the diagnosis. Furthermore, it can be useful at out-patient clinics where allergy testing is not available.
Nasal mucosa discolouration can be measured objectively to aid the diagnosis of allergic rhinitis. In addition to comparisons with normal controls, comparisons with acute rhinitis and sinusitis groups will be more accurate for the diagnosis. These are the limitations of our study. Further studies are needed to advance this objective method.
Conclusion
Our naked eye or endoscopic view on the monitor may not always allow the differentiation of particular colour changes pathognomonic for allergic rhinitis. Therefore, widely available RGB measurements can provide an objective, non-invasive, inexpensive and handy method to aid allergic rhinitis diagnosis.
Competing interests
None declared


