


People with social anxiety disorder (SAD) have a significant and persistent fear of social situations within which embarrassment, rejection, or scrutiny may occur (American Psychiatric Association, APA, 2013). For a SAD diagnosis, social situations need to almost always elicit fear or anxiety that is out of proportion to the actual threat, be avoided or endured with intense fear or anxiety, and cause significant impairment in an important life domain over at least 6 months (APA, 2013). Clinical practice guidelines recommend cognitive behavioral therapy (CBT) as the first-line treatment for SAD (Andrews et al., Reference Andrews, Bell, Boyce, Gale, Lampe, Marwat and Wilkins2018), and suggest that although group CBT is more effective than most other interventions it is less clinically effective or cost-effective than individual CBT (National Institute for Health and Care Excellence, 2013; although some meta-analyses have failed to find a difference between group and individual CBT, e.g., Acarturk, Cuijpers, van Straten, & de Graaf, Reference Acarturk, Cuijpers, van Straten and de Graaf2009). However, group CBT requires substantially fewer clinician hours per patient and is thus more feasible in community mental health clinics with limited resources (McEvoy, Reference McEvoy2007), so it is important to continue investigating ‘enhancements’ that may increase the clinical and cost-effectiveness of group CBT. Although group CBT is effective for many patients, there is considerable room for improvement in outcomes, with the majority of people failing to achieve full remission (McEvoy, Erceg-Hurn, Saulsman, & Thibodeau, Reference McEvoy, Erceg-Hurn, Saulsman and Thibodeau2015; Rapee, Gaston, & Abbott, Reference Rapee, Gaston and Abbott2009). Theory-driven treatment innovations are therefore needed to improve outcomes.
Cognitive behavioral models suggest that individuals with SAD hold negatively biased mental representations of themselves in the form of imagery from the ‘observer perspective’ (Clarke & Wells, Reference Clarke, Wells, Heimberg, Liebowitz, Hope and Schneier1995; Heimberg, Brozovich, & Rapee, Reference Heimberg, Brozovich, Rapee, Hofmann and DiBartolo2014). These representations are guided by negative core beliefs about the self (e.g. incompetent, unlikeable) and others (e.g. hostile, judgmental), internal somatic cues (e.g. elements of the fight-flight-freeze response such as shaking and sweating), long-term memory (e.g. early social traumas), and observable social feedback (often in the form of ambiguous social cues). This mental representation leads the individual to believe that they are revealing personal inadequacies that fall short of observers' expected standards, which leads to further negative thoughts and images about evaluation and impending social catastrophes (rejection, humiliation) and avoidance behaviors (e.g. averting eye gaze, not contributing to conversations, avoiding social events). A distorted self-image is, therefore, a key maintaining factor for SAD, which is targeted in CBT by behavioral experiments (including video-feedback) and cognitive restructuring (Orr & Moscovitch, Reference Orr and Moscovitch2010; Rapee & Hayman, Reference Rapee and Hayman1996).
Mental imagery is multisensory and may include visual, somatic, auditory, olfactory, and gustatory perceptions (Holmes & Mathews, Reference Holmes and Mathews2010). Experimental studies have found that instructions to process negative and positive information within a mental imagery mode intensifies negative and positive affect, respectively, compared to verbal-linguistic processing (Holmes, Lang, & Shah, Reference Holmes, Lang and Shah2009; Holmes & Mathews, Reference Holmes and Mathews2005). Given the evidence of the predominance of current negative imagery in SAD that is literally or thematically related to past social traumas (Hackmann, Clark, & McManus, Reference Hackmann, Clark and McManus2000; Moscovitch, Gavric, Merrifield, Bielak, & Moscovitch, Reference Moscovitch, Gavric, Merrifield, Bielak and Moscovitch2011), and evidence that holding negative social imagery in mind increases anxiety, avoidant behaviors, self-focused attention, performance deficits, and negative self-appraisals (Hirsch, Clark, Mathews, & Williams, Reference Hirsch, Clark, Mathews and Williams2003; Hirsch, Meynen, & Clark, Reference Hirsch, Meynen and Clark2004; Makkar & Grisham, Reference Makkar and Grisham2011), using cognitive techniques within the imagery mode may target these images more powerfully and enhance cognitive and affective change relative to more traditional verbal strategies (Heimberg et al., Reference Heimberg, Brozovich, Rapee, Hofmann and DiBartolo2014; Reimer & Moscovitch, Reference Reimer and Moscovitch2015).
Evidence from a pilot study of imagery-enhanced group CBT (IE-CBT, N = 19; McEvoy and Saulsman, Reference McEvoy and Saulsman2014), a benchmarking study comparing patients receiving IE-CBT (n = 53) to historical controls who received standard group CBT (n = 129; McEvoy et al., Reference McEvoy, Erceg-Hurn, Saulsman and Thibodeau2015), and an uncontrolled open trial in an independent clinic without supervision from the protocol developers (N = 46; McEvoy, Saulsman, & Rapee, Reference McEvoy, Saulsman and Rapee2018) suggests that integrating mental imagery-based techniques throughout group CBT yields very large within-group effect sizes (Cohen's ds ~ 2.00) and improves patient social interaction anxiety compared to group CBT without imagery enhancements (between-group d = 0.61 at 1-month follow-up, McEvoy et al., Reference McEvoy, Erceg-Hurn, Saulsman and Thibodeau2015). These within-group effect sizes were compared favorably to historical evaluations of individual (ds ~ 0.8–1.9) and group CBT (ds ~ 0.4–0.1.3; see McEvoy, Reference McEvoy2007; McEvoy, Nathan, Rapee, & Campbell, Reference McEvoy, Nathan, Rapee and Campbell2012), although recent group CBT effects are also on the higher end of those achieved from individual CBT (d ~ 2.0; Alden, Buhr, Robichaud, Trew, & Plasencia, Reference Alden, Buhr, Robichaud, Trew and Plasencia2018). However, no previous study has directly compared standard CBT, which tends to rely predominantly on the verbal mode, to an imagery-enhanced CBT (IE-CBT) protocol that comprehensively incorporates the imagery mode into all elements of a CBT package.
This randomized clinical trial was the first to directly compare a multi-session IE-CBT package to more traditional CBT that emphasized the verbal-based mode of processing (VB-CBT). It is important to note that the aim of this trial was to investigate whether integrating imagery-based techniques throughout standard CBT would improve outcomes for patients, rather than to determine whether IE-CBT would outperform an inert treatment (e.g. waitlist) or one that was unlikely to achieve established treatment outcome benchmarks. Meta-analysis and controlled trials have demonstrated that individuals with SAD do not remit on waitlists over the duration of the interventions evaluated in this study (12 weeks, Steinert, Stadter, Stark, & Leichsenring, Reference Steinert, Stadter, Stark and Leichsenring2017) and social support controls yield only small to moderate effects (Rapee et al., Reference Rapee, Gaston and Abbott2009), so it was considered unethical (National Statement on Ethical Conduct in Human Research, 2007, (Updated 2018)) and unnecessary to include a non-active control. It was hypothesized that IE-CBT would result in larger reductions than VB-CBT on the pre-registered primary outcomes: (a) self-reported social interaction anxiety, (b) clinician-rated severity, and (c) the proportion of patients remitting from SAD based on a structured diagnostic interview. Secondary outcomes reported here, including performance anxiety, fears of negative and positive evaluation, and general anxiety and depression symptoms, were expected to change more during IE-CBT.
Method
Participants
Patients referred to an Australian community mental health clinic by a general practitioner, psychiatrist, or psychologist for treatment for SAD between July 2016 and February 2019 were assessed by a clinical psychologist to determine eligibility for the trial. Inclusion criteria were: ⩾18-years-old, principal DSM-5 (American Psychiatric Association, 2013) diagnosis of SAD assessed using the Structured Clinical Interview for DSM-5 (SCID-5; First, Williams, Karg, & Spitzer, Reference First, Williams, Karg and Spitzer2015), and stable medications for ⩾1 month prior to the start of treatment. Exclusion criteria were: current and/or past bipolar disorder, psychosis, current substance use disorder, high suicidality, or self-harm risk (i.e. plans and/or intent); current CBT for SAD outside of the trial. See CONSORT flowchart (see Fig. 1 and online Supplement) for progress through the study. The groups were comparable at baseline on demographic and clinical variables (Table 1). The sample comprised a similar proportion of males and females. Most had achieved a high school qualification, around half had post-school qualifications, around half were employed, and most were single and from an Anglo/European background. The sample was chronic and comorbid, with symptoms being reported for 10–12 years on average, 64% having at least one comorbid disorder, and the vast majority (94%) not experiencing sufficient benefit from previous psychiatric treatment. Around two-thirds were using psychotropic medication.
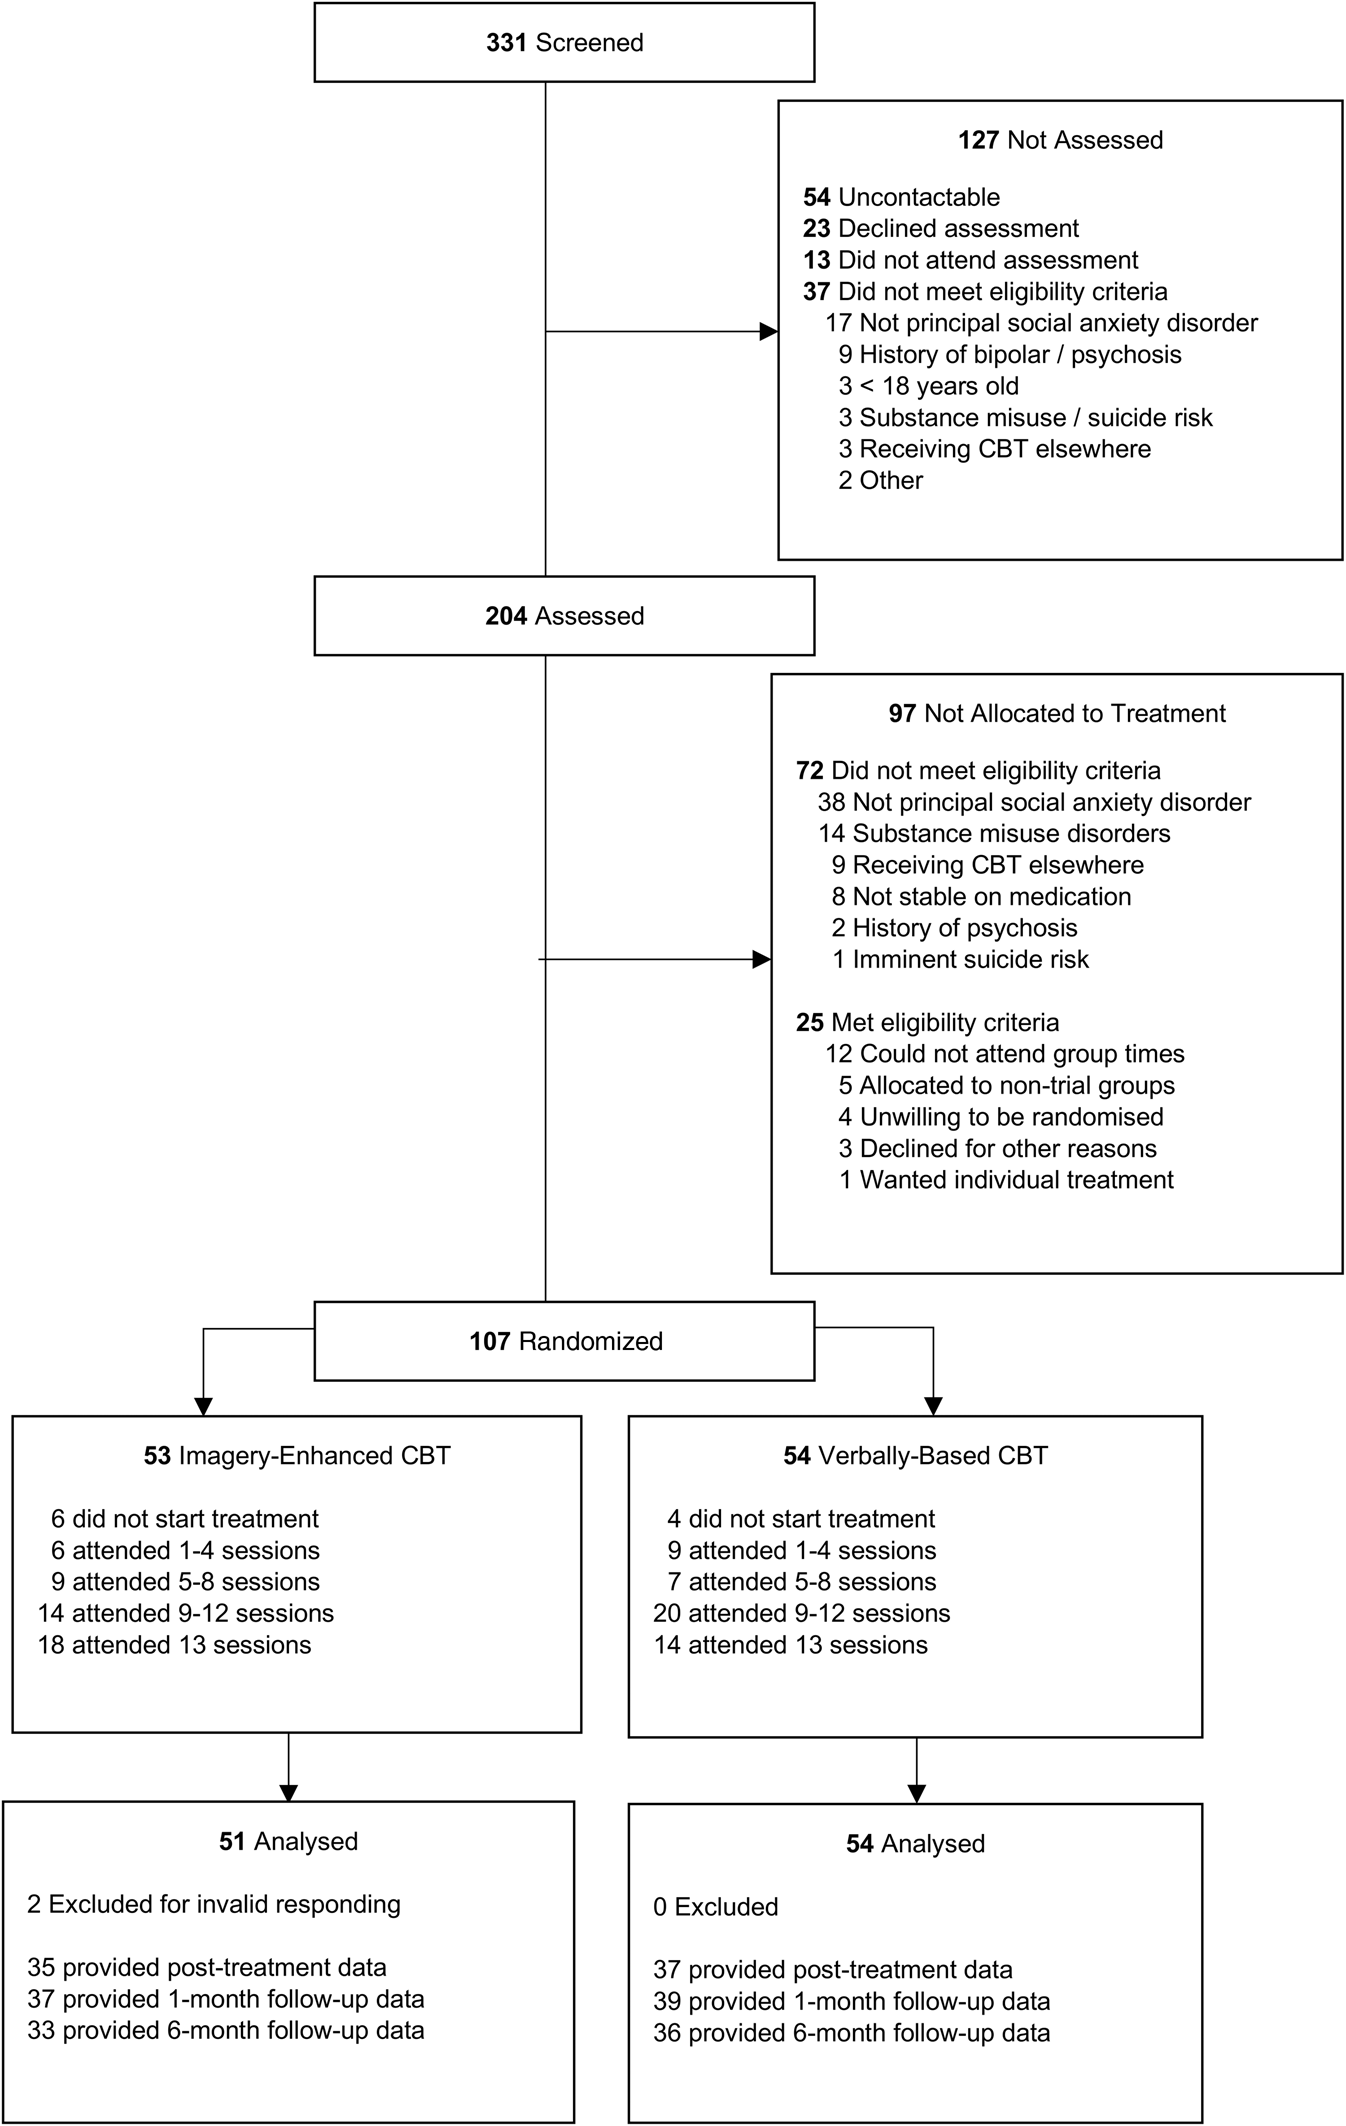
Fig. 1. CONSORT diagram. CBT, cognitive behavior therapy.
Table 1. Sociodemographic and clinical details of participants in the imagery-enhanced (IE) and verbally-based (VB) Cognitive Behavior Therapy (CBT) conditions

SAD, social anxiety disorder; MDD, major depressive disorder; GAD, generalized anxiety disorder; SIAS, Social interaction anxiety scale; SPS, social phobia scale; BFNE, brief fear of negative evaluation – straightforwardly worded; FPE, fear of positive evaluation; PROMIS, Patient-Reported Outcomes Measurement Information System. SIAS, SPS, BFNE-S, FPE, and PROMIS scale means (s.d.) are based on observed scores.
Note. Figures for continuous variables are means and standard deviations, except for Duration Current Episode, for which the median and inter-quartile range are reported due to skewness. Figures for categorical variables are counts and percentages.
Treatments
Patients were randomized to either IE- or VB-CBT, which both targeted the same maintaining factors: negative automatic cognitions (e.g. probability and cost of evaluation), avoidance, safety behaviors, negative self-images, self-focused attention, and negative core beliefs. The treatments targeted both social interaction and performance anxiety. The protocols differed in the predominant cognitive mode within which the strategies were applied. We note that VB-CBT resembles standard CBT, but this treatment was labelled VB-CBT for this trial to highlight the key dimension on which the interventions differed (i.e. relative emphasis of verbal v. imagery modes of processing). IE-CBT incorporated mental imagery-based techniques throughout all sessions, whereas VB-CBT focused on ‘thoughts’ without mentioning imagery or using imagery-based techniques, except for the video-feedback session (see online Supplementary Materials for a detailed session-by-session overview). The video-feedback session was retained in both conditions given evidence that it is a powerful component of CBT and our primary interest was to determine whether imagery-enhancements would improve outcomes relative to current best practice, rather than remove important components from VB-CBT simply to inflate the chances of IE-CBT to demonstrate superiority. Both treatments comprised 12, 2-h weekly group sessions, a 1-month follow-up with the group, and individual 1- and 6-month follow-ups with the trial assessor. All groups were facilitated by two clinicians.
Assessing and treating clinicians
Assessing clinicians were blind throughout the trial, had extensive prior training and experience administering structured diagnostic interviews, and were required to complete two practice SCIDs prior to this study with the concordant principal and comorbid diagnoses. Treating clinicians were masters or doctoral level clinical psychologists thoroughly trained by the lead investigators and protocol developers or other previously certified clinicians. The training involved reading comprehensive treatment manuals with detailed therapist instructions, scripts, and client handouts, and co-facilitation of at least one group with one of the protocol developers or certified clinicians (see online Supplementary Materials for more details). Clinicians ran both protocols to control for therapist-specific factors and received weekly supervision by the lead investigator (PM).
Assessments
Primary outcome measures. The three pre-registered primary outcomes captured self-report symptoms, diagnoses, and clinician-rated severity. All self-report measures were highly reliable, as indexed by Omega (ω). The 20-item Social Interaction Anxiety Scale (SIAS, ω = 0.91; Mattick & Clarke, Reference Mattick and Clarke1998) was used to assess self-reported social interaction anxiety and was administered at baseline, sessions 4, 8, 12, and 1- and 6-month follow-up. The SCID-5 was administered by blind assessors to all participants at baseline and again at 1- and 6-month follow-up. Principal and comorbid diagnoses at baseline were re-assessed at each follow-up. To ascertain the current diagnostic status and avoid overlaps with previous assessment time points, participants were asked to reflect on how they had been feeling ‘in the past few weeks’ at 1- and 6-month follow-up. The severity of diagnoses was rated by clinicians on an 8-point scale at baseline and 1- and 6-month follow-up, with a score of 4 (at least occasional symptoms that definitely interfere with functioning) designated as the minimum threshold for a diagnosis.
Secondary outcome measures. The following measures were administered at baseline, each session, and at follow-ups and all were highly reliable: the PROMIS depression (ω = 0.99) and anxiety (ω = 0.94) scales (Pilkonis et al., Reference Pilkonis, Choi, Reise, Stover, Riley, Cella and Group2011) measure symptom severity over the previous 7-days; the Brief Fear of Negative Evaluation scale – straightforwardly worded (ω = 0.92, BFNE, Rodebaugh et al., Reference Rodebaugh, Woods, Thissen, Heimberg, Chambless and Rapee2004), measures fear or concern about being negatively evaluated; Fear of Positive Evaluation scale (FPE,ω = 0.80; Weeks, Heimberg, & Rodebaugh, Reference Weeks, Heimberg and Rodebaugh2008) assesses fear and distress related to positive evaluation from others. The Social Phobia Scale (SPS, ω = 0.97; Mattick & Clarke, Reference Mattick and Clarke1998), a 20-item measure of performance anxiety, was administered in sessions 1, 4, 8, 12, and follow-ups. Additional secondary measures (McEvoy et al., Reference McEvoy, Moulds, Grisham, Holmes, Moscovitch, Hendrie and Erceg-Hurn2017) will be reported elsewhere. More details regarding rating scales and psychometrics are provided in the online Supplementary Materials.
Assessment and intervention quality measures
All treatment sessions were audiotaped. Protocol adherence (% components completed), and adherence to therapy method and therapist skills (Cognitive Therapy Rating Scale; CTRS; Blackburn et al., Reference Blackburn, James, Milne, Baker, Standart, Garland and Reichelt2001), were assessed for a random 20% of treatment sessions by independent clinical psychologists. The trial coordinator independently readministered all SCID-5 modules to a random 20% of patients at pre-treatment to assess inter-rater reliability (see online Supplementary eTable 1). Randomization schedules were generated by a researcher independent from the trial prior to assessments commencing at http://www.random.org. Expectancy effects were assessed by asking patients if they believed they received ‘the most effective’ treatment (yes, no, unsure), and clinicians blind to the condition were asked to guess each participant's treatment condition following 1- and 6-month individual follow-up assessments. The Working Alliance Inventory (WAI; Tracey & Kokotovic, Reference Tracey and Kokotovic1989) was administered in sessions 3, 6, and 9, and the Group Cohesion Scale (GCS; Stokes, Reference Stokes1983) was administered in sessions 4, 7, and 10 to ensure these process variables did not differ between treatments. Weekly homework was allocated and compliance monitored using the Homework Rating Scale-II in sessions 2, 5, 8, and 11 (HRS-II; Kazantzis, Deane, & Ronan, Reference Kazantzis, Deane, Ronan, Kazantzis, Deane, Ronan and L'Abate2005). Average scores on the WAI, GCS, and HRS-II across the study were compared across the treatment groups.
Procedure
The study protocol was approved by the Human Research Ethics Committee of the local Health Department (approval # 04_2016) and University (HR87_2016). Potential participants completed clinical and SCID interviews with a clinical psychologist at which trial eligibility was assessed. Eligible patients were invited to discuss the research trial with a trial coordinator not involved in their treatment, written informed consent was obtained, and the SCID was readministered to a random 20% of participants. The study information sheet informed participants that they would be randomized to one of two group treatments, both of which were expected to be effective, but that the study was designed to determine whether one was more effective than the other.
Eligible individuals were randomly assigned on a 1:1 ratio in blocks for each cohort with no stratification (maximum of 12 patients per group). Once eligibility was determined, informed consent was obtained, and participant availability for the whole day for the next cohort that was due to commence was confirmed, the blind assessing clinician provided the participant with the next sealed envelope in the sequence, which contained the dates and times of their group sessions. One group in each condition was scheduled to start on the same day (morning and afternoon groups) for all six cohorts (total 12 groups). Treatments alternated between morning and afternoon groups for each successive cohort. Participants then attended their allocated group session and completed the measures at the pre-registered time points (http://www.anzctr.org.au, ACTRN12616000579493, see protocol paper; McEvoy et al., Reference McEvoy, Moulds, Grisham, Holmes, Moscovitch, Hendrie and Erceg-Hurn2017).
Data analysis
A detailed statistical analysis plan (SAP), updated from the pre-registered plan to ensure current best practices were followed, including power analysis that was published on Open Science Framework prior to the final data being collected (https://osf.io/msq9w/). Analyses were conducted using R 3.6.3 (R Development Core Team, 2010) by a statistician blind to condition. The primary endpoint was 1-month follow up, with effects also examined at 12-weeks and 6-month follow up. Power analysis for the trial (previously peer-reviewed and published) identified that taking into account potential dependencies within the 12 treatment groups, 98 participants (49 per treatment) would be required for 80% power to detect a moderate (d = 0.51) difference between the treatments (McEvoy et al., Reference McEvoy, Moulds, Grisham, Holmes, Moscovitch, Hendrie and Erceg-Hurn2017).
Assessment and intervention quality comparisons
Fisher's exact tests were used to compare the proportion of patients believing they received the most effective treatment and assessing clinicians' capacity to identify patients' conditions. Independent samples t tests were used to compare mean time between assessment and treatment session, group cohesion, working alliance, CTRS score, and average ratings of quantity and quality of homework completion.
Continuous outcome measures
A mixed-model repeated measures (MMRM) approach was used to assess whether the continuous outcomes (BFNE-S, SIAS, SPS, FPE, PROMIS-Anxiety & Depression) differed between groups. MMRM analyses use a residual covariance structure, rather than random intercepts and slopes for each individual, to account for the repeated-measures nature of the data (Mallinckrodt & Lipkovich, Reference Mallinckrodt and Lipkovich2017). MMRM tests for treatment effects by constructing contrasts of the differences in model-estimated marginal means between the treatment groups at a given follow-up. This approach is popular for its increased power to detect effects in clinical trials (Mallinckrodt & Lipkovich, Reference Mallinckrodt and Lipkovich2017).
For the measures with five post-baseline measurements (SIAS and SPS), time was entered as a categorical predictor and an unstructured residual covariance was used. This is a highly flexible approach that does not make any assumptions about the ‘form’ of change or the structure of the residuals throughout the trial. For measures assessed weekly (BFNE, FPE, PROMIS Anxiety & Depression), this approach is not feasible as the sample size cannot support the large number of parameters that need to be estimated. Instead, time was entered as a piecewise linear spline and a first-order continuous auto-regressive (CAR1) structure was used. Where categorical time makes no assumptions about the form of change throughout the study, piecewise time requires the specification of the form of change within each of the assessment blocks. For the present analysis, the assessment period was divided into three blocks: Session 2 to Session 12, Session 12 to 1-Month follow-up, 1-Month follow-up to 6-Month follow-up. The analysis assumed that the changes within each of these blocks would be linear. More details about the model structure and reasoning behind these choices are provided in the statistical analysis plan for the trial (https://osf.io/54j9d/).
A random intercept for each group (therapy group, not treatment group) was included to account for the correlation between responses of individuals in the same group within each treatment but was removed if it had little variance and caused convergence problems. Baseline scores were included as a covariate in all analyses.
Baseline-adjusted means and standard errors were estimated at each follow-up. Contrasts of those means were used to evaluate differences between the treatments and effect sizes. Unstandardized effect sizes indexed estimated mean change from baseline. Standardized within-treatment effect sizes were calculated by dividing the unstandardized effects by the pre-treatment standard deviation. Between-treatment effect sizes were computed by subtracting changes in VB-CBT from those in IE-CBT.
Clinician-rated severity
As clinician-rated severity is scored by ordered category, a cumulative link mixed-model (CLMM) was used. A random intercept for the group was included but was removed if it caused estimation issues.
Diagnosis
To test whether the treatments differentially reduced the number of individuals with a SAD diagnosis (remission), the difference in proportions of individuals without a diagnosis at each follow-up was compared.
Reliable and clinically significant change
Jacobson and Truax's (Reference Jacobson and Truax1991) reliable and clinically significant change statistics indexed changes greater than expected from measurement error, and clinically meaningful change, respectively, on the SIAS. The severity cut-off for clinically significant change was the mid-point between non-clinical and clinical means (40.56; Carleton et al., Reference Carleton, Thibodeau, Weeks, Teale Sapach, McEvoy, Horswill and Heimberg2014; McEvoy et al., Reference McEvoy, Erceg-Hurn, Saulsman and Thibodeau2015).
Missing data
Missing data were addressed using multiple imputations with predictive mean-matching and 100 imputations (van Buuren & Groothuis-Oudshoorn, Reference van Buuren and Groothuis-Oudshoorn2011). Rubin's rules were used to compute pooled means and proportions, standard errors, confidence intervals, and p values. Thorough documentation and R code for the trial analyses, sensitivity analyses, and assumption tests are available on the Open Science Framework (https://osf.io/msq9w/).
Results
Assessment and intervention quality comparisons
The inter-rater reliability for SAD diagnosis was perfect, and was ‘fair’ for clinician-rated SAD severity ratings, and current MDD and GAD diagnoses (see online Supplementary eTable 1). No differences between conditions were detected in the proportion of patients believing they received the most effective treatment (p = 0.61), assessing clinicians' capacity to identify patients' conditions (1-month, p = 0.63; 6-month, p > 0.99), mean time between assessment and treatment session (p = 0.91), group cohesion (p = 0.73), working alliance (p = 0.34), CTRS score (p = 0.23), or average ratings of quantity (d = 0.17, p = 0.42) and quality (d = 0.23, p = 0.29) of homework completion. Protocol compliance was rated as 100% for both treatments.
Treatment attendance
Attendance was similar between the treatments: IE-CBT mean = 9.73/13 sessions (s.d. = 3.96), VB-CBT mean = 9.02 sessions (s.d. = 3.93). The proportions of individuals receiving a ‘high’ dose of treatment (8+ sessions; McEvoy et al., Reference McEvoy, Nathan, Rapee and Campbell2012) were also comparable (73.30% v. 70.00%).
Primary and secondary outcomes
Both treatments had very large within-treatment effect sizes (ds > 2.00) on the primary self-report outcome (SIAS) to 1-month follow-up, which indicates very large symptom improvement (see Table 2). Large effects were observed on all secondary self-report outcomes at all time points. There were no significant differences between the treatment groups, and in most cases between-treatment effect sizes were small to negligible (Table 3).
Table 2. Estimated mean changes from baseline and within-group effect sizes

SIAS, Social Interaction Anxiety Scale; SPS, Social Phobia Scale; BFNES-S, Brief Fear of Negative Evaluation Scale; FPE, Fear of Positive Evaluation Scale; PROMIS, Patient-Reported Outcomes Measurement Information System.
The pooled multiply-imputed baseline values used to compute the baseline-adjusted means were 56.85 (SIAS), 44.56 (SPS), 26.43 (BFNE-S), 41.19 (FPE), 64.87 (PROMIS-anxiety) and 61.10 (PROMIS-depression). Standard deviations used to compute the standardized-effect sizes were 9.55 (SIAS), 16.01 (SPS), 5.01 (BFNE-S), 14.17 (FPE), 6.86 (PROMIS-Anxiety) and 6.41 (PROMIS-depression).
Table 3. Estimated mean difference between groups (imagery-enhanced v. verbally-based CBT) at follow-up assessments and standardized between-groups effect sizes
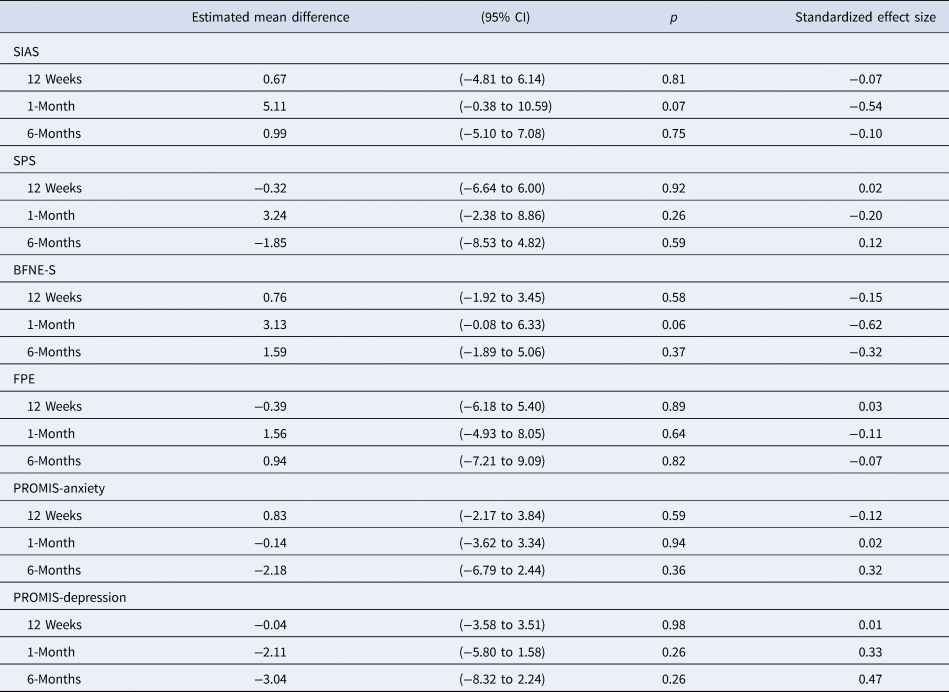
SIAS, Social Interaction Anxiety Scale; SPS, Social Phobia Scale; BFNES-S, Brief Fear of Negative Evaluation Scale; FPE, Fear of Positive Evaluation Scale; PROMIS, Patient-Reported Outcomes Measurement Information System.
Clinician-rated severity and diagnostic status
Odds ratios (OR) indexing the probability of VB-CBT having a higher severity rating than IE-CBT were 1.45 (95% CI 0.45–4.62, p = 0.53) at 1-month and 1.31 (95% CI 0.42–4.08, p = 0.65) at 6-month follow-up. The difference in the proportion of individuals remitting from a SAD diagnosis between groups was negligible at both the 1-month [IE = 61.04%, VB = 55.09%, diff = −5.95%, 95% CI (−27.29% to 15.39%), p = 0.59] and 6-month [IE = 58.73%, VB = 61.89%, diff = 3.16% (−17.86% to 24.19%), p = 0.77] follow-up.
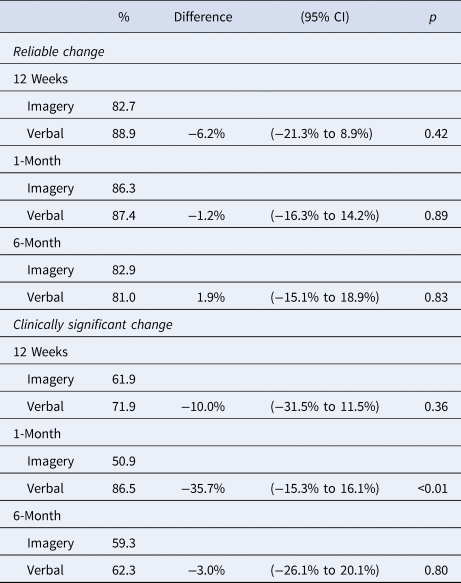
Reliable and clinically significant change
High rates of reliable (>80%) and clinically significant (>50%) change on the SIAS were seen in both treatment conditions, with very small rates of reliable deterioration (<3%, Table 4). The only significant difference was that a higher proportion of individuals in VB-CBT achieved clinically significant change at the 1-month follow-up, but not at post-treatment or 6-month follow-up.
Table 4. Reliable change and clinically significant change proportions and group differences at each time point
Adverse events
One patient reported abusing alcohol and medication at the 6-month follow-up (IE-CBT), and two patients reported a temporary increase in suicidal ideation (one in each condition, with the IE-CBT patient removed following the 1-month follow-up). These events were not attributed to the trial by the patients or therapists.
Discussion
The aim of this study was to compare imagery-enhanced (IE) to verbally-based (VB) CBT for SAD. The hypothesis that IE-CBT would yield larger improvements on self-reported social interaction anxiety, clinician-rated anxiety, and diagnostic-status at the primary (1-month follow-up) and secondary (post-treatment, 6-month follow-up) end points was not supported. The hypothesis that the IE-CBT would yield superior outcomes on secondary outcomes, including performance anxiety, fears of negative and positive evaluation, and general anxiety and depression symptoms, was also not supported.
The within-treatment effects on all outcomes for both conditions were very large and compared favorably to previous studies of the group and individual CBT (McEvoy, Reference McEvoy2007). The within-treatment effects for IE-CBT have been replicated across four studies, including pilot data in our clinic (McEvoy & Saulsman, Reference McEvoy and Saulsman2014; McEvoy et al., Reference McEvoy, Erceg-Hurn, Saulsman and Thibodeau2015), and at an independent site without supervision from the protocol developers (McEvoy et al., Reference McEvoy, Saulsman and Rapee2018), and thus appear to be robust. While the within-treatment effects for IE-CBT were comparable to previous studies, effects from the VB-CBT protocol used in the RCT were substantially larger than historical patients who completed an earlier version of that protocol (McEvoy et al., Reference McEvoy, Erceg-Hurn, Saulsman and Thibodeau2015). The effects from VB-CBT in this trial may have exceeded the previous version because the session content was not identical to that used in the earlier trials. The modifications to VB-CBT (see eTable 2 in the online Supplement), such as commencing several cognitive and behavioral strategies earlier and including an additional within-session behavioral experiment session, may have improved its effectiveness.
One explanation for the comparable findings across conditions is that any beneficial impact of imagery-based approaches may be dwarfed by the potency of other common strategies (e.g. behavioral experiments, video feedback, group interactions over multiple sessions) and theory-driven targets (thoughts/images, avoidance, safety behaviors, self-images from the observer-perspective, self-focused attention, core beliefs) across the comprehensive multi-component interventions. It is noteworthy that previous studies of single-session interventions have also found comparable self-report outcomes when directly comparing imagery-based and verbally-based interventions (Hyett et al., Reference Hyett, Bank, Lipp, Erceg-Hurn, Alvares, Maclaine and McEvoy2018; Norton & Abbott, Reference Norton and Abbott2016), or have only detected differential effects on psychophysiological measures (Hyett et al., Reference Hyett, Bank, Lipp, Erceg-Hurn, Alvares, Maclaine and McEvoy2018). It is therefore important to compare outcomes using multi-method assessments (e.g. self-report, psychophysiological, behavioral observation) rather than rely only on self-report. It is also possible that patients may have naturally used both imagery or verbal modes or their preferred mode regardless of the instructions, thereby neutralizing the protocol differences. Psychotherapy necessarily relies on patients applying the strategies described in the protocol and it is difficult to directly assess verbal- v. imagery-based processing, particularly in group therapy. Future studies could investigate self-reported success with implementing imagery-based processing as a proxy to the mode of processing. It would also be informative to determine whether using patient preference to guide the choice of imagery or verbal techniques improves patient engagement and outcomes.
Both treatments targeted the cognitive maintenance mechanisms of SAD reported in this study (Clarke & Wells, Reference Clarke, Wells, Heimberg, Liebowitz, Hope and Schneier1995; Heimberg et al., Reference Heimberg, Brozovich, Rapee, Hofmann and DiBartolo2014; Moscovitch, Reference Moscovitch2009; Rapee & Heimberg, Reference Rapee and Heimberg1997), and no differential changes were observed on fears of negative or positive evaluation or indeed on comorbid anxiety and depression symptoms. These findings provide evidence that both interventions were associated with reductions in these maintaining factors, which were associated with concurrent improvements on self-report, clinician-reported, and diagnostic outcomes. The main clinical implication of these findings is that group CBT is associated with large reductions in symptoms and these mechanisms regardless of explicit instructions to use the verbal or imagery mode.
This study had a number of strengths that support its internal validity, including pre-registration, blind assessments (i.e. patients unaware of study hypotheses; assessors no better than chance at identifying group allocation), publication of an extensive statistical analysis plan prior to final data collection, independent ratings of treatment fidelity and quality, independent generation of randomization schedules, inter-rater reliability for diagnoses, repeated measures up to 6-month follow-up, blind analyses, and sufficient power to detect the medium effects found in pilot studies. The study was conducted within a community mental health clinic and included only patients referred by health professionals, supporting its external validity (Sherman et al., Reference Sherman, Anderson, Dal Pan, Gray, Gross, Hunter and Califf2016).
The main limitation to external validity is generalizability to individuals excluded from the trial, so effectiveness trials without these restrictions would be informative. The absence of untreated and nonspecific control groups also precluded us accounting for the effects of time (e.g. regression to the mean) or common factors of psychotherapy (e.g. attention, unconditional positive regard, expectations), respectively. However, meta-analyses have demonstrated that waitlisted individuals with SAD do not tend to change over a similar duration of our interventions (g = 0.13 over an average of 10.6 weeks; Steinert et al., Reference Steinert, Stadter, Stark and Leichsenring2017), and within and between effect sizes for CBT are large compared to a range of inert and active control conditions (Barkowski et al., Reference Barkowski, Schwartze, Strauss, Burlingame, Barth and Rosendahl2016; Mayo-Wilson et al., Reference Mayo-Wilson, Dias, Mavranezouli, Kew, Clark, Ades and Pilling2014; Steinert et al., Reference Steinert, Stadter, Stark and Leichsenring2017). We, therefore, consider it reasonable to conclude that the majority of symptom improvement is likely to be attributable to the interventions. It is noteworthy that administering treatment arms known to be inert or that are unlikely to meet established best practice benchmarks is considered unethical by some national funding bodies (e.g. National Health and Medical Research Council, 2007, 2018). Finally, the majority of the sample was of Anglo/European backgrounds, which may pose a threat to generalizability to individuals from other cultures.
Our study found that imagery-enhanced group CBT was not more effective than verbally-based CBT and that both are associated with large symptom reductions. Effect sizes were compared very favorably to previous trials of both group and individual CBT. Group-based CBT requires fewer therapist hours per patient (McEvoy, Reference McEvoy2007) so may be more feasible than individual CBT within health services with limited resources.
Supplementary material
The supplementary material for this article can be found at https://doi.org/10.1017/S0033291720003001.
Acknowledgements
The authors gratefully acknowledge all of the staff at the Centre for Clinical Interventions in Perth, Western Australia for their support for the study, particularly the clinicians who facilitated groups: Mark Summers, Melissa Burgess, Adelln Sng, Olivia Carter, and Louise Pannekoek. The trial clinicians received no compensation for their involvement in the study outside of their paid employment. The authors also acknowledge Robert Kane, Curtin University, for his contribution to the initial statistical plan. This study was supported by a project grant (APP1104007) from the National Health and Medical Research Council of Australia (NHMRC) awarded to McEvoy, Saulsman, Moulds, Grisham, Holmes, Moscovitch, Lipp, and Rapee. The funding body had no role in the design and conduct of the study; collection, management, analysis, and interpretation of the data; preparation, review, or approval of the manuscript; and decision to submit the manuscript for publication
Author contribution
Prof McEvoy, Dr Hyett, Mr Erceg-Hurn, and Dr Johnson had full access to all the data in the study and took the responsibility for the integrity of the data and the accuracy of the data analysis. McEvoy, Saulsman, Moulds, Grisham, Holmes, Moscovitch, Lipp, and Rapee designed the concept. Acquisition, analysis, or interpretation of data were done by McEvoy, Hyett, Bank, Kyron, Erceg-Hurn, Johnson, Campbell. The manuscript was drafted by McEvoy, Hyett, Erceg-Hurn, Johnson. Critical revision of the manuscript for important intellectual content was done by all the authors. Statistical analysis was performed by Erceg-Hurn and Johnson. McEvoy, Moulds, Grisham, Holmes, and Moscovitch obtained funding. McEvoy, Hyett, Bank, Erceg-Hurn, Johnson, Kyron, and Campbell provided administrative, technical, or material support. McEvoy and Campbell supervised the work.
Conflict of interest
McEvoy, Saulsman, and Rapee receive royalties from Guilford Press (Imagery-Enhanced CBT for Social Anxiety Disorder). Holmes receives book royalties from Oxford University Press (Imagery and Cognitive Therapy) and Guilford Press (Imagery-Based Cognitive Therapy for Bipolar Disorder and Mood Instability) and receives occasional consultancy fees from SBU: Statens beredning för medicinsk och social utvärdering (SBU – Swedish Agency for Health Technology Assessment and Assessment of Social Services), Sweden. No other disclosures were reported.
Data sharing statement
All trial data will be shared to an open-access repository hosted by Research Data Australia following the publication of the primary outcomes (see https://researchdata.ands.org.au/).


