


INTRODUCTION
The four major stages that characterize human brain development are: (1) neuronal proliferation, (2) migration of neurons to specific sites throughout the central nervous system (CNS), (3) organization of the neuronal circuitry, and (4) myelination of the neuronal circuitry (Volpe, Reference Volpe1995).
The third stage of human brain development, organization of the neural circuitry, is most active from the sixth month of gestation to young adulthood. The major events associated with neuronal circuitry organization include: (1) proper alignment, orientation, and layering of cortical neurons; (2) dendritic and axonal differentiation; (3) synaptic development; (4) synaptic elimination (cell death and/or selective elimination of neuronal processes); and (5) glial proliferation and differentiation. These processes overlap with the timing of normal development of cognitive function and the onset of neurodevelopmental and psychiatric disorders such as attention deficit disorder, autism, and schizophrenia. Normal synaptic elimination occurs during early adolescence in nonhuman primates (Bourgeois & Rakic, Reference Bourgeois and Rakic1993; Rakic, Bourgeois, Eckenhoff, Zecevic, & Goldman-Rakic, Reference Rakic, Bourgeois, Eckenhoff, Zecevic and Goldman-Rakic1986) and humans (Huttenlocher, Reference Huttenlocher1979, Reference Huttenlocher1990; Huttenlocher & Dabholkar, Reference Huttenlocher and Dabholkar1997; Huttenlocher, de Courtten, Garey, & Van der Loos, Reference Huttenlocher, de Courtten, Garey and Van der Loos1982). Synaptic elimination in nonhuman primates is generally observed to occur synchronously in all regions (i.e., homochronous; Rakic et al., Reference Rakic, Bourgeois, Eckenhoff, Zecevic and Goldman-Rakic1986), but is heterochronous in humans (Huttenlocher & Dabholkar, 1997). Normal synaptic elimination is predominantly of presumptive excitatory asymmetric junctions on dendritic spines (Smiley & Goldman-Rakic, Reference Smiley and Goldman-Rakic1993), which probably utilize amino acids, such as l-glutamate, as the neurotransmitter (Storm-Mathisen & Otterson, Reference Storm-Mathisen and Otterson1990). Perinatal insults, intrauterine disturbances, and perhaps environmental influences in childhood and adolescence can potentially result in disordered neuronal circuitry (Birch & Gussow, Reference Birch and Gussow1970). This study focuses on molecular and structural indices related to synaptic development and elimination and the correlation of these indices with measures of cognitive development.
31P and 1H magnetic resonance spectroscopic imaging (31P-1H MRSI) are well suited to monitor the processes of synaptic development and elimination and neuronal cell death by measuring energy dynamics (phosphocreatine [PCr]), a putative biomarker of neurons and neuronal processes (n-acetylaspartate [NAA]), and measures of membrane phospholipid metabolism, such as phospholipid building blocks (short nuclear magnetic resonance [NMR] correlation time phosphomonoesters [sPME]), and phospholipid breakdown products (short NMR correlation time phosphodiesters [sPDE]). The hypothesis tested in this study is that neuromolecular underpinnings of synaptic development and elimination will be observed by changes in 31P-1H MRSI observed brain metabolites of individuals ages 6–18, and will be associated with changes in percent gray matter by volume (GM) reflecting synaptic development and elimination. Specifically, we investigated in an axial brain slice, cross-sectional age differences in brain levels of PCr, sPME, sPDE, and NAA, which reflect changes in neuronal synaptic activity (PCr), neuronal numbers and integrity (NAA), turnover of membrane phospholipids (sPME and sPDE), and structural changes (GM). We hypothesized that these neurodevelopmental, metabolic, and structural changes would be associated with corresponding development of cognitive function in the domains of language, visual-spatial construction, executive function, and memory abilities. In an age difference study, one should expect to find meaningful correspondences among cognitive growth, the mentioned brain metabolite levels, and GM.
METHODS
Participants
The study was approved by the University of Pittsburgh Institutional Review Board. All subjects (and parents when appropriate) gave informed written consent to participate in the study. Personal interviews, including the subject and family, were conducted by a psychologist, and following the informed consent procedure and execution of the appropriate consent form, procedures were accomplished to assure that recruited participants were healthy, normally developing individuals who met all inclusion/exclusion criteria: These included a review of the study inclusion/exclusion criteria and completion and review of the Devereux Scale for Mental Disorders and a cognitive test battery as described later. This interview was followed by a separate interview in which magnetic resonance (MR) exclusion criteria were reviewed by an MR Center nurse or technician and by subject participation in an MR simulator. A pediatrician conducted the physical examination in an examination room at the MR Center. In addition to the report by the pediatrician, the Devereux scale, the family history-research diagnostic criteria (FH-RDC, Andreasen, Endicott, Spitzer, & Winoker, Reference Andreasen, Endicott, Spitzer and Winoker1977) interview, and other tests from the cognitive neurodevelopmental battery were scored and reviewed with the subject and family. If all entry criteria were met, the full battery was completed, followed by the MRSI/MRI examination within one month after completion of the cognitive neurodevelopmental battery.
The sample consisted of 105 individuals ranging in age from 6 to 17. Fifty-four were females and 51 were males. The age distribution covered the neurodevelopmental stages of childhood (6–10 years), pubescence (10–12 years), and adolescence (12–18 years).
Neurocognitive Testing Procedures
A portion of the cognitive battery consisting of standardized tests with published manuals was administered using standard procedures under the supervision of a licensed psychologist in order to evaluate basic intellectual and academic abilities, and to detect behavioral abnormalities. This preliminary battery included an age appropriate version of the Wechsler Intelligence Scale (abbreviated WISC-R [Wechsler, Reference Wechsler1974] for children; WASI [Wechsler, Reference Wechsler1999] for adults) and the Wechsler Individual Achievement Test Screener (Wechsler, Reference Wechsler2001) to identify individuals functioning within the average range of intellectual ability (IQ 85–119) with commensurate progress in the acquisition of basic academic skills. Testing was typically completed in less than four hours. In addition to satisfying criteria for nonsignificant variance in intellectual ability, individuals demonstrating significant Verbal IQ-Performance IQ (VIQ-PIQ) score discrepancies (greater than 15 points) were eliminated from the study owing to the potential for possible asymmetric cognitive development. Any potential participant manifesting a significant discrepancy between IQ and reading and/or math development also was eliminated owing to the potential of confounds associated with an underlying learning disability. The Devereux Scale for Mental Disorders (Naglieri, LeBuffe, & Pfeiffer, Reference Naglieri, LeBuffe and Pfeiffer1994) was used to assess social and emotional development. A t score ≥ 60 on any of the Devereux Scales (conduct, attention, anxiety, depression, autism, acute problems) eliminated a child from the study owing to potential confounds associated with psychopathology. The FH-RDC (Andreasen et al., Reference Andreasen, Endicott, Spitzer and Winoker1977) interview was given to rule out Diagnostic and Statistical Manual, 4th edition (DSM-IV) psychiatric disorders in first-degree relatives. A pediatrician performed a medical examination, including Tanner staging of physical development, for each child at entry into the study to correspond with the MR examination. All tests included in the battery are appropriate for use across the age span of the study, are developmentally sensitive, and have established age norms. The full neurocognitive battery included measures of cognitive domains, divided here into language, visual-spatial construction, executive function, and memory abilities. The specific tests assigned to each domain are listed in Table 1. A composite score was computed for each domain by adding the scores of the tests and dividing by the number of tests used.
Table 1. Neuropsychological test variables used within each cognitive domain

A set of test variables from the entire battery was selected to assess the cognitive domains of language, visual spatial, executive function, and memory. The cognitive domain scores were used for determination of associations with selected MRSI variables and GM. The first step was determining which of these cognitive measures, if any, were associated with the three MRSI variables, PCr, sPME/sPDE, and NAA. This analysis was followed by determining if synaptic elimination, represented by GM, was associated with the values of PCr, sPME/sPDE, and NAA. It was predicted that changes in one or more of the molecular indices obtained through the use of curve fitting procedures would coincide with or precede evidence of synaptic development and elimination. Cognitive tests were used to evaluate the overall strength of association among cognitive function, the targeted metabolites, and GM.
Magnetic Resonance Procedures
MRI and MRSI procedures were conducted using a doubly tuned transmit/receive volume head coil on a GE LX 1.5-Tesla whole-body MRI system (GE Medical Systems, Milwaukee, Wisconsin). A 3-dimensional volume of T1-weighted images covering the entire brain (spoiled gradient recalled acquisition [SPGR], repetition time [TR] = 25 ms, echo time [TE] = 5 ms, flip angle = 40°, field of view [FOV] = 24 × 18 cm2, slice thickness = 0.15 cm, 124 coronal slices, number of excitations [NEX] = 1, matrix = 256 × 192, scan time = 7 min 44 s) was then collected for tissue-segmentation analysis of the 31P spectroscopy voxels. In addition, a set of T2-weighted/proton density images (2-dimensional fast spin-echo, TR = 3,000 ms, echo times = 17 and 102 ms, echo-train length = 8, FOV = 24 × 24 cm2, approximately 24 axial slices, 5-mm thick and no gap, NEX = 1, matrix = 256 × 192, scan time 5 min 12 s) was used to screen for neuroradiological abnormalities.
31P MRSI acquisition
To prescribe the MRSI slice location, a 3-plane MRI localizer image was first collected, followed by a set of sagittal and axial scout images using the two-dimensional fast spin-echo sequence. Using the mid-sagittal image, the anterior commissure-posterior commissure (AC-PC) line was defined and a 3.0 cm axial slice was positioned parallel to and superior to the AC-PC line for the spectroscopy (Fig. 1A). Prior to the spectroscopy, automatic and manual shimming was applied to the axial slice. A single-slice selective excitation radio frequency (RF) pulse followed by phase-encoding pulses to spatially encode the two dimensions of the slice (termed FIDCSI on a GE system) was used to acquire the multi-voxel in vivo 31P spectroscopy data (Fig. 2). The acquisition parameters were: FOV = 24 × 36 cm2; slice thickness = 3.0 cm; 8 × 8 phase encoding steps (nominal voxel volume = 3.0 × 4.5 × 3.0 cm3); TR = 2,000 ms; complex data points = 1,024; spectral bandwidth = 5.0 kHz; preacquisition delay = 1.7 ms; number of averages = 16; and acquisition time approximately 34 min.

Fig. 1. (A) 31P MRSI voxel grid shifts (outlined in white) superimposed on the middle MRI axial slice (bottom right) for: (a) prefrontal cortex; (b) basal ganglia; (c) superior temporal cortex; (d) inferior parietal cortex; (e) centrum semiovale; and (f) occipital regions. Voxel size is 3.0 × 4.5 × 3.0 cm3. (B) Segmentation images of: (a) gray matter; (b) white matter; and (c) cerebral spinal fluid (CSF) and extra-cortical matter where the intensity is proportional to the tissue type of that image. Both cortical and subcortical gray matter were measured. The matrix size of the images is 256 in the sagittal direction by 124 in the coronal direction, reflecting the 124 slices that were acquired for the 3-dimensional SPGR sequence. Right and left 31P prefrontal voxels (white boxes) are superimposed on the images.

Fig. 2. Quantification of a typical in vivo 31P magnetic resonance spectroscopic imaging spectrum with 5 Hz line broadening from a single voxel (3.0 × 4.5 × 3.0 cm3) of a study subject. The acquired spectrum is modeled in the time domain with Gaussian-damped sinusoids and by omitting both the first 1.75 ms and first 4.95 ms of the free induction decay using the Marquardt-Levenberg algorithm. Both the short (1.75 ms) and long (4.95 ms) delay time (DT) models are shown superimposed on the acquired 31P spectra, and the modeled resonances are identified on the right. The difference between the two time-domain fits results in the bottom trace containing the intermediate correlation time components.
1H MRSI acquisition
This acquisition method combined the point-resolved spectroscopy sequence (PRESS, [Bottomley, Reference Bottomley1987]) with the phase encoding steps of a chemical shift imaging (CSI) sequence, which is termed PRESSCSI, and is part of the GE spectroscopy package. Briefly, the 90° RF pulse followed by two 180° RF pulses, which make up this double-echo sequence, are all slice-selective, and the intersection of the three orthogonal planes defines a large region of interest (ROI). In this study the ROI is positioned in the axial plane, and the left-right and anterior-posterior dimensions will vary accordingly to ensure the ROI covers the brain in the defined axial plane. Surrounding the ROI in the axial plane are four spatially localized saturation slices to suppress the strong lipid signal at the corners of the ROI. Very selective suppression pulses are used for the PRESS localization and the lipid saturation, which provide a much sharper excitation slice profile relative to conventional pulses (Roux, Reference Roux1998). An example of quantified short TE 1H spectroscopy data, which is collected as described earlier, is shown in Figure 3. Experimental parameters for the water-suppressed PRESSCSI measurement were: FOV = 24 × 24 cm2; thickness of the ROI slice = 2.0 cm; phase encoding steps = 16 × 16 (nominal voxel dimension = 1.5 × 1.5 × 2 cm3); TR = 1,500 ms; TE = 30 ms; complex data points = 2,048; spectral bandwidth = 2.5 kHz; and NEX = 2. Using identical experimental parameters, water-unsuppressed PRESSCSI data also were collected for post-processing purposes, except there are 8 × 8 phase encoding steps. The 1H MRSI acquisition time is approximately 30 min.

Fig. 3. An example of quantifying a short echo time (TE) 1H MRSI spectrum of a control subject using the proposed acquisition protocol and LC Model fitting. The acquired spectrum with no line broadening is superimposed on the modeled and baseline spine function and the residual is below. The quantified macromolecule signal is indicated in a separate trace.
MRSI post-processing and quantification
To minimize the partial volume effect for sampled regions, six different voxel grid shift schemes (Fig. 1A) were applied to both 1H and 31P MRSI prior to 2-dimensional inverse Fourier transformation (2D IFT). These grid schemes provided voxels that include left and right: prefrontal cortex (LPFC, RPFC), superior temporal cortex (LSTC, RSTC), inferior parietal cortex (LIPC, RIPC), basal ganglia (LBG, RBG), and centrum semiovale (LCS, RCS).
Spectral fitting of 31P MRSI
For 31P MRSI, a mild spatial apodization was applied in k-space (Fermi window with 90% diameter and 5% transition width), resulting in an effective voxel size of approximately 46.4 cm3, whereas a 5 Hz Gaussian apodization is applied in the chemical shift domain and PME, PDE, PCr, α-, β-, and γ-adenosine-5ʹ-triphosphate (ATP), and inorganic orthophosphate (Pi) were modeled in the time domain with Gaussian-damped sinusoids and by omitting the first 4.95 ms of the free induction decay (FID) using the Marquardt-Levenberg algorithm (Fig. 2). This approach ensured that PME and PDE resonances primarily reflected freely mobile short NMR correlation time components (Stanley & Pettegrew, Reference Stanley and Pettegrew2001). 31P MRSI quantification was expressed in relative mole percent of the observable 31P resonances. The mole percent method of quantification highly correlates with absolute quantification methods (Klunk, Xu, Panchalingam, McClure, & Pettegrew, Reference Klunk, Xu, Panchalingam, McClure and Pettegrew1994).
Spectral fitting of short TE 1H MRSI
The residual of the unsuppressed water signal between 7 ppm and 4.2 ppm was removed by using the (operator-independent) singular value decomposition (SVD)-based fitting algorithm (de Beer & van Ormondt, Reference de Beer, van Ormondt, Diehl and Fluck1992). The linear combination (LC) Model software package was used to quantify the 1H metabolites, which include: NAA, glutamate, glutamine, myo-inositol, trimethylamines (TMA), total creatine (creatine + phosphocreatine; Crt), taurine, alanine, aspartate, γ-aminobutyric acid (GABA), glucose, scyllo-inositol, n-acetylaspartylglutamate (NAAG), and the macromolecule signals. The key in simplifying the fitting of the complex overlapping resonances was to incorporate a priori knowledge into the fitting algorithm (deGraaf & Bovee, Reference deGraaf and Bovee1990; Provencher, Reference Provencher1993; Stanley, Drost, Williamson, & Thompson, Reference Stanley, Drost, Williamson and Thompson1995). This included a priori knowledge of the macromolecule signals as part of the basis of the LC Model (Seeger, Klose, Mader, Grodd, & Nagele, Reference Seeger, Klose, Mader, Grodd and Nagele2003). The LC Model software package, which is commercially available, provided this feature and has been demonstrated by others (Brockmann, Pouwels, Christen, Frahm, & Hanefeld, Reference Brockmann, Pouwels, Christen, Frahm and Hanefeld1996; Ebert, Speck, Konig, Berger, Hennig, & Hohagen, Reference Ebert, Speck, Konig, Berger, Hennig and Hohagen1997; Frahm & Hanefeld, Reference Frahm and Hanefeld1996) to be an accurate and reliable method to quantify short TE 1H MRS data. The post-processing was fully automated. An example of processed in vivo 1H spectrum of a healthy individual using the proposed short TE 1H MRSI technique and the post-processing protocol is shown in Figure 3. Proton MRSI quantification was expressed in mmole.
Morphometry
A fully automated segmentation procedure was used to segment T1- weighted 3D-SPGR images. The functional magnetic resonance imaging of the brain (FMRIB) software Library (FSL; Smith et al., Reference Smith, Jenkinson, Woolrich, Beckmann, Behrens, Johansen-Berg, Bannister, De Luca, Drobnjak, Flitney, Niazy, Saunders, Vickers, Zhang, De Stefano, Brady and Matthews2004; Woolrich et al., Reference Woolrich, Jbabdi, Patenaude, Chappell, Makni, Behrens, Beckmann, Jenkinson and Smith2009; FSL Analysis Group, FMRIB, Oxford, UK) was used to co-register, correct for any B1 field bias, brain extraction, and segmentation. The axial slices from the 3D-SPGR images were co-registered to the axial scout images using FMRIB’s linear image registration tool (FLIRT) of the FSL package. The brain extraction tool (BET) software was used to extract brain by removing nonbrain matter from the image. FMRIB’s automated segmentation tool (FAST) was used to segment the brain into gray, white, and CSF/extra cortical space while also correcting for spatial intensity variations (also known as bias field or B1 field inhomogenity correction). Both cortical and subcortical GM were measured. Tools from the software package FreeSurfer (http://surfer.nmr.mgh.harvard.edu) were used to convert the MRI images from ANALYZE format to neuroimaging informatics technology initiative (NIFTI) format, extract header information, and provide intensity normalization prior to segmentation.
Tissue fractions were then calculated by extracting from segmented images the region of interest matching the coordinates and size of 31P spectroscopy voxels using miscellaneous FSL utilities for converting and processing images (FSLUTILS) tools (FSLROI, FSLSTATS, FSLMATHS). A segmented image and voxel placement are illustrated in Figure 1B.
Data analysis
We evaluated subjects across the age range (6–18 years) that covers the physical developmental stages of childhood (6–10 years), pubescence (10–12 years), and adolescence (12–18 years). Molecular and neuromorphometric findings were obtained from 12 brain regions, 6 in each hemisphere. Values for the targeted metabolites were averaged across the axial slice containing the 12 brain regions, thereby yielding a single axial slice value for each metabolite. Our study’s primary hypothesis is that neuromolecular underpinnings of synaptic development and elimination, major processes in neurodevelopment, will coincide with or precede changes in GM, and will be observed by differences in the targeted brain metabolites among age groups, accompanied by corresponding differences in cognitive function.
To analyze the effect of age, and therefore neurodevelopment, on the targeted metabolites, scatterplots of age versus average axial slice metabolite levels were obtained and fitted with a locally weighted scatterplot smoothing function (LOESS; Cleveland, Reference Cleveland1979; Cleveland & Grosse, Reference Cleveland and Grosse1988). The scatterplots show transition points approximating ages of known neurodevelopment stages, that is, childhood (6–10 years), pubescence (10–12 years), and adolescence (12–18 years). To more clearly show these transition points for targeted metabolites and GM, we calculated Z scores for each. The Z scores for each variable were calculated by subtracting the individual value from mean of the entire dataset of that value, divided by the standard deviation. Based on the findings, it was elected to compare the 6–9.5 and the 12–18 year-old age groups. Comparisons of average metabolite levels between the 6–9.5 and 12–18 year-old age groups were performed using two-sided t tests.
The same graphic approach was taken in which Z values for PCr, composite cognitive test scores, and GM were plotted by age. This step was taken so that cognitive function and metabolite levels could be compared with changes in cerebral cortical GM, which we hypothesized would show an initial growth reflecting synaptic development, followed by a reduction because of synaptic elimination.
Next, strength of association between cognitive function and metabolite levels with age was examined. For this purpose, linear multiple regression analyses were performed relating composite scores for the major cognitive domains, including language, visual spatial, executive function, and memory, to PCr, sPME/sPDE, and NAA levels, as well as GM. Tests and variables used within each domain are listed in Table 1. Because this is an age-difference study, raw scores of cognitive functions were used rather than age-corrected standard scores.
RESULTS
Reliability of MRSI Measures
Reliability results (relative mole percent of observable phosphorus resonances ± SD and the coefficient of variation [CV] in parentheses) for the multi-voxel obtained 31P MRSI metabolites quantification are: sPME, 10.4 ± 2.0 (19%); Pi, 5.4 ± 1.3 (24%); sPDE, 28.5 ± 3.3 (12%); PCr, 11.3 ± 1.4 (13%); αATP, 14.3 ± 2.0 (14%); β−ATP, 16.3 ± 2.1 (13%); and γ−ATP, 13.8 ± 2.6 (19%). Our 1H MRSI studies gave mean absolute levels, relative to the unsuppressed water signal and appropriate correction factors, and CV of the prominent 1H metabolites as: NAA, 7.41 mM (9.4%); Crt, 5.36 mM (13.5%); GPC + PC, 1.44 mM (16.8%); myo-inositol, 4.18 mM (20.8%); glutamate, 6.53 mM (20.4%); glutamine 2.77 mM (51.8%); and combined macromolecule signal 5.94 (33.4%) (scaled to H2O resonance, but uncorrected for relaxation times and total number of observable protons). Quantification of the NAA resonance was most reliable (CV = 9.4%); however, measures of glutamate and myo-inositol were more variable (CV = 20%) and glutamine was highly variable (CV = 52%). The mean absolute metabolite levels and the variance were consistent with prior short TE studies at 1.5T (Bartha, Drost, Menon, & Williamson, Reference Bartha, Drost, Menon and Williamson2000; Brockmann et al., Reference Brockmann, Pouwels, Christen, Frahm and Hanefeld1996; Ebert et al., Reference Ebert, Speck, Konig, Berger, Hennig and Hohagen1997; Frahm & Hanefeld, Reference Frahm and Hanefeld1996; Kreis, Reference Kreis1997; Provencher, Reference Provencher1993; Stanley et al., Reference Stanley, Drost, Williamson and Thompson1995). These CV values demonstrate sufficient reliability, enabling us to conduct 31P-1H MRSI studies for the hypotheses to be tested.
MRSI Metabolite Level Changes With Age
Metabolite and GM levels (Fig. 4) and cognitive scores (Fig. 5) were plotted by age using a LOESS smoothing function. These plots demonstrate age-related transition points at 9.5 and 12 years for PCr, sPME/sPDE, and GM. Figure 6 displays the change of PCr, sPME/sPDE ratio, and GM by converting the metabolite levels and GM to Z scores. Guided by these plots and other neurodevelopmental data, the metabolite and GM data were grouped into ages 6–9.5, 9.5–12, and 12–18 years old in order to analyze changes in the metabolite levels with age.

Fig. 4. Scatterplots of PCr, sPME/sPDE, NAA, and GM versus age fitted with a LOESS curve with 95% confidence intervals.

Fig. 5. Scatterplots of composite scores for cognitive domains (Language, Memory, Visual Spatial, Executive Function) versus age fitted with a LOESS curve with 95% confidence intervals.
Metabolic and GM Differences Among Age Groups
Descriptive statistics for evaluating differences in PCr, sPME/sPDE, GM, and composite cognitive scores among the 6–9.5, 9.5–12, and 12–18 year-old age groups are presented in Table 2. Because there were clear inflections in metabolite levels and GM in the 6–9.5 and 12–18 year-old age groups and a flattening in the 9.5–12 year-old group, we performed the statistical analysis as two group comparisons using two-sided t tests. The results indicated that comparing 6–9.5 year-olds to the 12–18 year-olds, PCr was lower in the younger age group (PCr, p = .0001), and GM (p = .0013) and sPME/sPDE ratio (p = .046) were higher. No significant difference was found for NAA comparing the 6–9.5 year-olds with 12–18 year-olds. The CV for PCr (13%) also is much smaller than those for sPME (19%), but similar to those for sPDE (12%) and NAA (9.4%).

Fig. 6. Z score plots of PCr, sPME/sPDE, NAA, and GM versus age.
Table 2. Descriptive statistics of axial slice MRSI metabolites and GM by age group

Relations Among, PCr Levels, Cognitive Function, and GM With Age
Of the metabolites measured, PCr most directly reflects synaptic activity (see Discussion). For purposes of these graphic analyses, all scores were converted to Z scores, allowing for their comparisons on the same scales. Figure 7 illustrates the profiles of various cognitive domains across the age groups placed on the same graphs as PCr and GM. In general, PCr level tracked the cognitive changes quite closely. The rate of PCr increase in the 6–9.5 year-olds is similar to the rate of increase in GM. Within the 9.5 to 12 year age range the slope of PCr is approximately flat, while GM sharply decreases. GM is characterized by an increase in the 6–9.5 year-old age group, and then a marked decrease in the 9.5–12 year-old age group, with virtually no change from 12 to 18 years. PCr continued to increase in the 12 to 18 year-old age range.

Fig. 7. Z score plots of PCr, GM, and cognitive domain composite scores (Language, Memory, Visual Spatial, Executive Function).
Correlations of Composite Cognitive Scores With MRSI Metabolite Levels and GM
Multiple linear regression analysis of composite cognitive scores with average axial slice metabolite levels and GM (Table 3) demonstrated significant correlations of PCr levels and GM with age and language, visual-spatial construction, and memory domains. NAA showed a significant correlation only with the visual-spatial construction domain. These findings taken together strongly suggest that cognitive function correlates with synaptic activity and not simply with the amount of GM.
Table 3. Multiple linear regression analysis relating composite scores for cognitive domains with MRSI metabolite levels and GM

Note
PCr = phosphocreatine; sPME/sPDE = short NMR correlation time phosphomonoester/phosphodiester ratio; NAA = n-acetylaspartate; GM = percent gray matter by volume.
***p ≤ .001; **p ≤ .01; *p ≤ .05 (2-tailed); r is the Pearson correlation.
DISCUSSION
In this cross-sectional age difference study, we investigated the relationship between a set of 31P-1H MRSI measured metabolites and cognitive development. We did morphological studies for the purpose of evaluating GM across age groups. The major hypothesis was that neuromolecular underpinnings of synaptic development and elimination would reflect age-related cognitive development and coincide or precede change in GM.
The hypothesis would be supported if there were significant correlations in the appropriate direction between the metabolites and cognitive tests of varying abilities. We studied tests of language, visual-spatial construction abilities, executive function, and memory. Multiple correlations were computed to evaluate the strength of association between tests within the domains and the metabolites. In general, there was a significant degree of association between changes in the levels of PCr and age-associated improvement in cognitive ability, but not with GM.
NAA Levels
NAA (470–974 μmoles/100 g; McIlwain & Bachelard, Reference McIlwain and Bachelard1985, p. 155), which is second to glutamate (781–1250 μmoles/100 g; McIlwain & Bachelard, Reference McIlwain and Bachelard1985, p. 155) in terms of total brain concentration of free amino acids, accounts for approximately 85–90% of the proton signal of the N-acetyl methyl group, and NAAG contributes to the remaining 10–15% (Frahm, Michaelis, Merboldt, Hanicke, Gyngell, & Bruhn, Reference Frahm, Michaelis, Merboldt, Hanicke, Gyngell and Bruhn1991; Koller, Zaczek, & Coyle, Reference Koller, Zaczek and Coyle1984; Pouwels & Frahm, Reference Pouwels and Frahm1997). Both NAA and NAAG are localized exclusively in mature neurons and neuronal processes, and not in mature glia (Birken & Oldendorf, Reference Birken and Oldendorf1989; Koller et al., Reference Koller, Zaczek and Coyle1984; Tallan, Moore, & Stein, Reference Tallan, Moore and Stein1956; Urenjak, Williams, Gadian, & Noble, Reference Urenjak, Williams, Gadian and Noble1993). NAA is formed in mitochondria from acetyl-CoA and aspartate by the membrane bound enzyme L-aspartate N-acetyltransferase, an enzyme found in brain but not in other tissue, such as heart, liver, and kidney (Goldstein, Reference Goldstein1959, Reference Goldstein1969; Knizley, Reference Knizley1967; Truckenmiller, Namboodiri, Brownstein, & Neale, Reference Truckenmiller, Namboodiri, Brownstein and Neale1985). Monoclonal antibody studies show NAA to be localized to neurons with intense staining of the perikarya and proximal dendrites and axons (Simmons, Frondoza, & Coyle, Reference Simmons, Frondoza and Coyle1991). The neuronal immunoreactivity does not correspond to primary neurotransmitter characteristics. A recent report of whole brain NAA levels in young adults gave a value of 9.5 ± 1.0 mM in white matter and 14.3 ± 1.1 mM in gray matter (Inglese, Rusinek, George, Babb, Grossman, & Gonen, Reference Inglese, Rusinek, George, Babb, Grossman and Gonen2008).
n-Acetyl moieties with short correlation times, such as found in n-acetyl-sugars (n-acetyl-galactosamine, n-acetyl-glucosamine, n-acetyl-neuraminic acid), and glycosphingolipids, such as gangliosides, also can contribute to the “NAA” resonance. Gangliosides are enriched in gray matter (Agranoff & Hajra, Reference Agranoff, Hajra, Siegel, Agranoff, Albers and Molinoff1994), where they are enriched in synaptic membranes (Whittaker, Reference Whittaker1966; Wiegandt, Reference Wiegandt1967). The levels of gangliosides in human brain cerebral gray matter (1.45–1.68 mmoles/100 g dry weight) and cerebral white matter (0.28–0.37 mmoles/100 g dry weight) have been determined by Eeg-Olofsson, Kristensson, Sourander, & Svennerholm, (Reference Eeg-Olofsson, Kristensson, Sourander and Svennerholm1966). The levels of gangliosides are developmentally regulated (Suzuki, Reference Suzuki1966). Sialoproteins also contain n-acetylneuraminic acid and could contribute up to 15% of the total brain protein (McIlwain & Bachelard, Reference McIlwain and Bachelard1985, p. 316).
sPME/sPDE Ratio
The sPME/sPDE ratio reflects metabolite turnover of membrane phospholipids, such as phosphatidylcholine, phosphatidylethanolamine, and phosphatidylserine. With net synthesis of these phospholipids sPME/sPDE is greater than 1, with net breakdown it is less than 1, and equals 1 when synthesis and breakdown are in equilibrium. Increased sPME are found at the site and time of neuritic sprouting in brain and sPDE are increased at the site and time of membrane breakdown (Geddes, Panchalingam, Keller, & Pettegrew, Reference Geddes, Panchalingam, Keller and Pettegrew1997). sPME and sPDE are not involved in the synthesis or breakdown of glycosphingolipids, such as gangliosides, which are enriched in synaptic membranes (Whittaker, Reference Whittaker1966; Wiegandt, Reference Wiegandt1967). sPME/sPDE increases from age 6 to 9.5 years reflecting active synthesis of membrane phospholipids, followed by decreases until approximately 14 years of age, with evidence for net phospholipid breakdown from age 11 to 14 years. The GM curve also is shown in Figure 6. As observed, GM increases for ages 6 to 9.5 years followed by a steeper decline until approximately 13 years. Changes in GM were consistent with synaptic development, followed by synaptic elimination, and are in keeping with the neuromorphometric findings of Giedd et al. (Reference Giedd, Blumenthal, Jeffries, Castellanos, Liu, Zijdenbos, Paus, Evans and Rapoport1999) and Gogtay et al. (Reference Gogtay, Ordonez, Herman, Hayashi, Greenstein, Vaituzis, Lenane, Clasen, Sharp, Giedd, Jung, Nugent, Toga, Leibenluft, Thompson and Rapoport2007), the molecular findings of Geddes et al. (Reference Geddes, Panchalingam, Keller and Pettegrew1997), and the histological data of Huttenlocher and Dabholkar (Reference Huttenlocher and Dabholkar1997). Note that the rate of increase in GM from 6 to 9.5 years and decrease from 9.5 to 13 years is greater than for sPME/sPDE. The difference in these rates (GM vs. sPME/sPDE) could be a result of ganglioside contributions to the gray matter.
Phosphocreatine
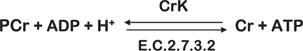
Brain tissue contains approximately 3 μmole·g−1 ATP, which could maximally provide 6 μmoles·g−1 of high-energy phosphate. ATP utilization in rat brain is approximately 0.5 μmoles·g−1 s−1 and therefore available stores of ATP would last approximately 12 s without new ATP production (Siesjo, Reference Siesjo1978, p. 12). However, PCr is a storage form of ATP that can be converted to ATP by the creatine kinase (CrK) enzyme according to the reaction:
This is an equilibrium reaction (ΔG = 0), that is, no net flux in either direction. ATP synthesis is stimulated by a reduction in ATP or increases in ADP or [H+]. In a comprehensive review, Andres, Ducray, Schlattner, Wallimann, & Widmer, (Reference Inglese, Rusinek, George, Babb, Grossman and Gonen2008) describe PCr as a spatial energy “shuttle” or “circuit” that bridges sites of ATP generation and consumption. Brain concentration of PCr is approximately 5 μmole g−1 and therefore the stores of high-energy phosphate (ATP + PCr) will be consumed after about 20 s of continuous utilization (Siesjo, Reference Siesjo1978, p. 12). Several studies have shown that anesthesia causes an elevation of PCr and ATP in parallel to the decrease in neuronal activity (Hein, Krieglstein, & Stock, Reference Hein, Krieglstein and Stock1975; McCandless & Wiggins, Reference McCandless and Wiggins1981). Sokoloff (Reference Sokoloff1991, Reference Sokoloff1993) also has shown that the synapse is the site of highest energy consumption during increased activity and that most of this consumption is in the recovery period, rather than during the activity itself. This is consistent with the studies of Jansson, Harkonen, & Helve, (Reference Jansson, Harkonen and Helve1979) who showed that PCr and ATP levels are lower in isolated cerebral nerve endings than in whole brain. Unlike nerve tissue in general, synaptosomes preferentially utilize endogenous PCr and ATP stores. Jansson et al. (Reference Jansson, Harkonen and Helve1979) concluded that synaptic transmission primarily depends on local stores of high-energy phosphates, rather than on the availability of glucose per se. Results of human 31P fMRS monitoring of brain PCr levels before, during, and following visual cortical activation are in keeping with the presented explanations (Rango, Castelli, & Scarlato, Reference Rango, Castelli and Scarlato1997; Rango, Bozzali, Prelle, Scarlato, & Bresolin, Reference Rango, Bozzali, Prelle, Scarlato and Bresolin2001). Other sources of ATP production, such as oxidative phosphorylation and glycolysis, come into play after the consumption of PCr pools.
PCr levels are low at age 6 and then sharply increase until age 10. From age 10 to 12 years the increase in PCr levels is much less, but from age 12 to 17 years PCr levels again sharply increase. The low levels of PCr at age 6 years are consistent with the active synthesis of membrane phospholipids, which require ATP. For example, one mole of dipalmitoylphosphatidylcholine (DPPC) derived from de novo synthesis requires 295 moles of ATP. The breakdown of DPPC recovers only 258 moles of ATP from the oxidation of both palmitates. Therefore, the complete synthesis and breakdown of 1 mole of DPPC results in an energetic debt of 37 moles of ATP. The acylation/deacylation of DPPC results in an energetic debt of 2 moles of ATP. Likewise, the de novo synthesis of 1 mole of cholesterol, a major membrane constituent, requires 276 moles of ATP, with no ATP recovered from the breakdown of cholesterol (Pettegrew, Keshavan, Stanley, McClure, Johnson, & Panchalingam, Reference Pettegrew, Keshavan, Stanley, McClure, Johnson, Panchalingam, Peet, Glen and Horrobin2003).
The slow increase in PCr levels from ages 9.5 to12 years coincides with a steep decrease in GM and a less rapid decrease in the sPME/sPDE ratio. One might speculate that the membranes being lost are predominantly nonphosphorus-containing glycosphingolipids, such as gangliosides, which are predominantly found in gray matter and are enriched in synaptic membranes. By this reasoning, the decrease in GM is most likely a result of the decrease in synaptic membranes contained in the neuropil.
The decline in GM from 12 to 18 years corresponds to continued increases in PCr. In the brain, ATP is primarily consumed at synaptic membranes for repolarizing synaptic membranes, which have been depolarized, and PCr is the buffer for ATP (Buchli, Martin, Boesiger, & Rumpel, Reference Buchli, Martin, Boesiger and Rumpel1994; Chugani, Phelps, & Mazziotta, Reference Chugani, Phelps and Mazziotta1987; Frey, Reference Frey, Siegel, Agranoff, Albers and Molinoff1994; Hein et al., Reference Hein, Krieglstein and Stock1975; Hess, Reference Hess, Kety and Elkes1961; Jansson et al., Reference Jansson, Harkonen and Helve1979; Kadekaro, Crane, & Sokoloff, Reference Kadekaro, Crane and Sokoloff1985; Kennedy & Sokoloff, Reference Kennedy and Sokoloff1957; McCandless & Wiggins, Reference McCandless and Wiggins1981; Sokoloff, Reference Sokoloff1966, Reference Sokoloff1991). The increase in PCr in the 12–18 year-olds could be caused by synaptic elimination, resulting in fewer synapses or decreased activity of remaining synapses in older subjects.
Correlations Among PCr Levels, GM, and Cognitive Composite Scores
Both PCr and GM in the axial slice are highly correlated with age, but NAA, sPME, sPDE, and sPME/sPDE are not. In addition, both PCr and GM in the axial slice are correlated with language, visual-spatial construction, and memory, but not with executive function. Finally, PCr levels and GM in the axial slice correlate (r = –.304; p = .0026) with each other, but NAA and GM are not correlated (r = –.023; p = .835). These findings taken together and inspection of Figure 6 suggest that axial slice PCr levels, in general, follow a curve similar to curves for the various cognitive domains. However, the curve for GM has qualitative findings dissimilar to the curve for PCr, which is consistent with synaptic elimination (GM curve) and the functional consequence of synaptic elimination or reduced synaptic activity (PCr curve). Finally, given the lack of correlation between NAA and GM, it may be that there are other molecular contributions to the “NAA” resonance signal besides n-acetylaspartate, as discussed earlier.
CONCLUSIONS
Our data demonstrate neurodevelopmentally determined changes in cognition (executive, language, memory, visual-spatial), and brain molecular composition (PCr, sPME/sPDE, NAA), and structure (GM) in humans ages 6–18 years. sPME/sPDE and GM changes coincide and likely reflect synaptogenesis (6–9.5 years), followed by synaptic elimination in gray matter neuropil (9.5–12 years). Neurodevelopmental changes in PCr support this explanation and reflect PCr utilization for both membrane phospholipid synthesis and synaptic repolarization from 6–9.5 years (synaptogenesis), followed by synaptic elimination (ages 9.5–12 years), resulting in reduced PCr utilization for both membrane phospholipid synthesis and synaptic repolarization (12–18 years). PCr levels and GM highly correlate with each other and with acquisition of cognitive abilities across several cognitive domains. This suggests that neuropil synaptic numbers and activity correlate with cognitive development and not simply with the GM. Of interest, is the observation that neurodevelopmental changes in NAA levels occur later than those related to synaptic numbers and function (Fig. 6). Because NAA is considered a marker of neuronal perikaryon and axons, the lack of NAA correlation with age or cognitive domain composite test scores (except visual-spatial, p ≤ .05) suggests there could be other molecular contributors to the “NAA” signal besides n-acetylaspartate.
This study has several limitations. The data are based on cross-sectional analysis, though it is not likely the cross-sectional data were markedly influenced by cohort effects, because all subjects were recruited from the same community over a period of only four years. There is the possibility of gender differences, which we could not evaluate because of small sample sizes. A final consideration is that the data was obtained from an axial slice of brain and different results may be found at different regional locations.
ACKNOWLEDGMENTS
This work was supported in part by an NIHCD/NIH HD-39799 grant (JWP). We thank Terry Bradbury for conducting neuropsychological testing. Indebtedness is also expressed to the Medical Research Service and the VISN-IV Mental Illness, Research, Education, and Clinical Center (MIRECC), Department of Veterans Affairs, for support of this work. We thank Harriet Marshman, Deborah Wetzler, and Dennis McKeag for help in conducting the study. There is no conflict of interest on the part of any of the authors.


