Introduction
Pyrochlore-group minerals, or simply pyrochlores (sensu lato), are complex Nb oxides that occur primarily as accessory minerals in diverse carbonatites, phoscorites and alkaline rocks (e.g. Kapustin, Reference Kapustin1980; Hogarth, Reference Hogarth and Bell1989; Chakhmouradian and Williams, Reference Chakhmouradian, Williams, Wall and Zaitsev2004). The crystal structure of pyrochlore-group minerals (simplified general formula of A 2B 2O6Z) permits accommodation of Ca, Na, U, Th, Sr, Ba and rare earth elements (REE) as the principal cations in the A site; Ti, Ta, Zr and Fe as substituting cations for Nb in the B site; and F, OH group and O anions in the Z site (Hogarth, Reference Hogarth and Bell1989). A wide compositional variability in pyrochlore can be observed on the scale of a single carbonatite locality, a certain rock type, a single hand specimen and even a single crystal, suggesting a complex crystallisation and evolutionary histories. Progressive changes in melt composition, typically in multi-stage carbonatite complexes, magma mixing and assimilation of early crystallised rocks could be responsible for the observed pyrochlore compositions (Chakhmouradian and Zaitsev, Reference Chakhmouradian and Zaitsev1999; Hogarth et al., Reference Hogarth, Williams and Jones2000; Chakhmouradian and Williams, Reference Chakhmouradian, Williams, Wall and Zaitsev2004; Zurevinski and Mitchell, Reference Zurevinski and Mitchell2004; Zaitsev et al., Reference Zaitsev, Williams, Wall and Zolotarev2012; Guarino et al., Reference Guarino, Wu, Melluso, Gomes, Tassinari, Ruberti and Brilli2017; Walter et al., Reference Walter, Parsapoor, Braunger, Marks, Wenzel, Martin and Markl2018). Late-stage hydrothermal alteration is particularly important and weathering of primary pyrochlore-group minerals leads to very significant cation substitution and cation leaching at the A site with the formation of hydrated and cation/anion-deficient minerals (Wall et al., Reference Wall, Williams, Woolley and Nasraoui1996; Nasraoui and Bilal, Reference Nasraoui and Bilal2000; Melgarejo et al., Reference Melgarejo, Costanzo, Bambi, Gonçalves and Neto2012). Another crucial alteration process is mineral decompression (metamictisation) due to the decay of U and/or Th. As a result, primary unaltered and crystalline pyrochlore is extremely rare in carbonatitic rocks (Horarth and Horne, Reference Hogarth and Horne1989). Pyrochlore-group minerals are also considered to be suitable for precision geochronology of carbonatitic rocks (Tappe et al., Reference Tappe, Steenfelt, Heaman and Simonetti2009; Wetzel et al., Reference Wetzel, Schmitt, Kronz and Wörner2010; Belyatsky et al., Reference Belyatsky, Lepekhina, Antonov, Rodionov, Nedosekova, Petrov, Shevchenko and Sergeev2018). Last, but not least, pyrochlore is very important in Nb production with all major deposits being related to carbonatitic rocks (Chakhmouradian et al., Reference Chakhmouradian, Reguir, Kressall, Crozier, Pisiak, Sidhu and Yang2015; Mitchell, Reference Mitchell2015).
In this contribution we present and discuss compositional and structural data for pyrochlore from carbonatites associated with the Quaternary Kerimasi volcano located in the Gregory Rift in northern Tanzania. The young age of Kerimasi means that all the crystals investigated including those with high U content, are crystalline and have little or no subsolidus alteration and low-temperature cation exchange.
Kerimasi volcano
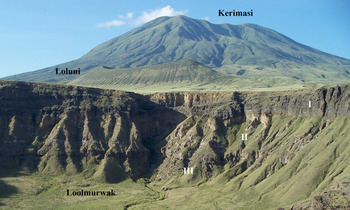
Kerimasi is a large extinct stratovolcano with a diameter of ~14 km rising ~1500 m above the Gregory rift floor. It is located ca. 12.5 km to the south of the currently active Oldoinyo Lengai carbonatite volcano (see figure 1 in Zaitsev et al., Reference Zaitsev, Williams, Britvin, Kuznetsova, Spratt, Petrov and Keller2010). Geological data and K-Ar radiometric age determination of phlogopite from tuffs of Loolmurwak and Kisete craters suggest volcanic activity between 1.2 and 0.4 Ma (Dawson and Powell, Reference Dawson and Powell1969; Macintyre et al., Reference Macintyre, Mitchell and Dawson1974). Kerimasi is extensively vegetated with limited outcrops in erosion gullies on the volcano slopes (Church, Reference Church1995) and in the upper parts of a debris avalanche deposit (Kervyn et al., Reference Kervyn, Ernst, Klaudius, Keller, Mbede and Jacobs2008; Delcamp et al., Reference Delcamp, Delvaux, Kwelwa, Macheyeki and Kervyn2016). The best outcrops with rocks considered to characterise Kerimasi are observed in the internal walls of Loluni, Kisete and Loolmurwak craters (Fig. 1) (Dawson and Powell, Reference Dawson and Powell1969; Hay, Reference Hay1983).

Fig. 1. View of the Kerimasi volcano and the Loluni and Loolmurwak craters. Loolmurwak consists of three units: crystal-rich tuff (I), carbonatite tuff/pyroclastic breccia (II) and nephelinite tuff breccia (III). At the Loluni crater only crystal-rich tuff and carbonatite tuff/pyroclastic breccia are exposed.
The volcano consists of nephelinitic and carbonatitic pyroclastic rocks, tuffs and tuff breccias. No nephelinite and carbonatite lava flows are known at Kerimasi and both rock types are observed as blocks in pyroclastic rocks only. Silicate and carbonate rocks at Kerimasi are represented by both plutonic and volcanic rocks (Dawson, Reference Dawson2008 and references herein). The silicate rocks include rare blocks of afrikandite [described as perovskite-bearing nepheline-melilite rock by Church (Reference Church1995) and perovskite+magnetite+melilite-bearing clinopyroxene–nepheline rock by Guzmics et al. (Reference Guzmics, Mitchell, Szabό, Berkesi, Milke and Ratter2012)], uncomphagrite [clinopyroxene–nepheline-melilite rocks, Church (Reference Church1995)], clinopyroxenite and abundant blocks of texturally and compositionally diverse melteigite and ijolite (Church, Reference Church1995). The volcanic rocks include rare melilite nephelinite (Church, Reference Church1995; Zaitsev et al., Reference Zaitsev, Spratt, Sharygin, Wenzel, Zaitseva and Markl2015) and abundant nephelinite and phonolitic nephelinite (Church, Reference Church1995). Melilite nephelinite is the most primitive volcanic rock at Kerimasi. However, the nephelinite is a relatively low-magnesium rock (3.53 wt.% MgO, Mg# = 38.3); melilite, although classified as åkermanite, contains elevated amounts of Na (4.0–4.9 wt.% Na2O) and Al (5.6–7.1 wt.% Al2O3) (Church, Reference Church1995; Zaitsev et al., Reference Zaitsev, Spratt, Sharygin, Wenzel, Zaitseva and Markl2015) and therefore crystallised from an already evolved melt (Wiedenmann et al., Reference Wiedenmann, Zaitsev, Britvin, Krivovichev and Keller2009, Reference Wiedenmann, Keller and Zaitsev2010).
Carbonatite tuffs, tuff breccias and pyroclastic breccias are widespread at Kerimasi and they contain blocks of both intrusive and effusive carbonatites. Outcrops with in situ carbonatites are extremely rare and they were described from the crater floor as a central plug (intrusive periclase-bearing calcite carbonatite, Mariano and Roeder, Reference Mariano and Roeder1983), the lower eastern volcano flank (intrusive apatite–periclase-bearing calcite carbonatite, Church, Reference Church1995) and the eastern flank near the volcano summit (calcite carbonatite dyke, Church, Reference Church1995).
Samples of both intrusive and effusive carbonatites were collected from tuffs on the northern, eastern and southern slopes of the Kerimasi volcano and from tuff breccias in Kisete, Loluni and Loolmurwak craters. Carbonatite samples from the Natural History Museum (London) collected by A. Church and M. Genge were also used in this investigation.
Blocks of intrusive carbonatite are holocrystalline with textures and mineralogy that are similar to early-stage, high-temperature magmatic carbonatites occurring worldwide (Kapustin, Reference Kapustin1980; Chakhmoradian et al., Reference Chakhmoradian, Reguir and Zaitsev2016 and references herein). Some of the carbonatites can be described as cumulate aggregates of calcite, apatite and magnetite or magnesioferrite; others can be termed as ‘banded’ carbonatites with elongated calcite and apatite+magnetite segregations between calcite crystals (probably corresponding to a flow texture). All the samples investigated contain calcite as the major carbonate mineral; rare dolomite occurs as a secondary mineral along calcite grain boundaries. The carbonatites contain variable amounts of diverse minor and accessory minerals including apatite, magnetite, magnesioferrite, forsterite, spinel, monticellite, phlogopite, perovskite, calzirtite, pyrochlore, kerimasite and baddeleyite (Mariano and Roeder, Reference Mariano and Roeder1983; Church, Reference Church1995; Dawson et al., Reference Dawson, Steele, Smith and Rivers1996; Reguir et al., Reference Reguir, Chakhmouradian, Nalden, Yang and Zaitsev2008; Zaitsev et al., Reference Zaitsev, Williams, Britvin, Kuznetsova, Spratt, Petrov and Keller2010; Guzmics et al., Reference Guzmics, Mitchell, Szabό, Berkesi, Milke and Abart2011; Chakhmouradian et al., Reference Chakhmouradian, Reguir, Zaitsev, Couëslan, Xue, Kynický, Mumin and Yang2017). Particularly interesting are carbonatites containing forsterite. The mineral is represented by two different crystal types, with rare oikocrysts (Fig. 2a) and common euhedral-to-subhedral crystals (Fig. 2b). The latter are now partial-to-full pseudomorphs.

Fig. 2. Back-scattered electron images of intrusive calcite carbonatites consisting of calcite (Cal), apatite (Ap), magnetite (Mag) with (a) forsterite oikocrysts (Fo) and (b) euhedral forsterite (Fo) now fully replaced by hydrous Fe–Mg silicate.
The effusive carbonatites are also holocrystalline with pheno- and microphenocrysts of calcite as the major mineral in two texturally different carbonatite types (Hay, Reference Hay1983; Mariano and Roeder, Reference Mariano and Roeder1983; Church, Reference Church1995; Zaitsev, Reference Zaitsev2010). The first type contains tabular calcite pheno- and microphenocrysts which are single crystals and exhibit well-developed zoning under cathodoluminescence. The second type of calcite occurs as abundant isometric or short tabular porous polycrystalline banded ‘pheno- and microphenocrysts’ (termed as ‘corduroy calcite’ by Church, Reference Church1995). Both calcite varieties are quite different in internal texture, composition and C–O isotope composition (Zaitsev, Reference Zaitsev2010; Zaitsev et al., Reference Zaitsev, Wenzel, Vennemann and Markl2013).
Polycrystalline banded calcite crystals were interpreted as pseudomorphs after primary nyerereite, ideal formula Na2Ca(CO3)2, (Hay, Reference Hay1983) or as relicts of exsolved calcite lamellae from primary dolomite (Church, Reference Church1995). The absence of dolomite is explained by dolomite breakdown during fast magma ascent to the surface and late removal of breakdown products by alkaline-rich meteoric water. The occurrence of nyerereite in melt inclusions in magnesioferrite in carbonatite lava supports Hay's (Reference Hay1983) hypothesis that the formation of banded calcite might be the result of complete nyerereite replacement, however, replacement of gregoryite, ideally Na2(CO3), with exsolved nyerereite cannot be ruled out (Zaitsev, Reference Zaitsev2010). Texturally and mineralogically similar carbonatite lavas have been described from several other localities including Tinderet volcano, Western Kenya (Deans and Roberts, Reference Deans and Roberts1984; Zaitsev et al., Reference Zaitsev, Wenzel, Vennemann and Markl2013). Typical minor and accessory minerals in calcite carbonatite lavas are apatite, magnesioferrite or magnetite; rare accessories are pyrrhotite, forsterite, periclase, baddeleyite and pyrochlore (Hay, Reference Hay1983; Mariano and Roeder, Reference Mariano and Roeder1983; Church, Reference Church1995; Zaitsev et al., Reference Zaitsev, Keller, Spratt, Perova and Kearsley2008; Zaitsev, Reference Zaitsev2010).
Samples and methods
Two samples of eluvial deposits (~10 kg each) on carbonatite tuff breccias were collected inside the Loluni and Kisete craters during 2005 field work and heavy mineral fractions were separated by hand washing. Both samples contain abundant magnetite, perovskite and clinopyroxene of variable composition with minor baddeleyite, calzirtite, kerimasite, pyrochlore and cerianite (Zaitsev et al., Reference Zaitsev, Williams, Britvin, Kuznetsova, Spratt, Petrov and Keller2010, Reference Zaitsev, Chakhmouradian, Siidra, Spratt, Williams, Stanley, Petrov, Britvin and Polyakova2011).
Polished thin sections and blocks with mounted mineral grains were investigated using a JEOL 5900LV scanning electron microscope equipped with an Oxford Instruments X-sight Si(Li) detector (The Natural History Museum, London) and a Hitachi S-3400N scanning electron microscope equipped with an Oxford Instruments X-Max 20 Energy Dispersive spectrometer (St. Petersburg State University, Russia). Electron-microprobe analyses of pyrochlore were obtained using wavelength-dispersive spectrometry (Cameca SX 50 microprobe, The Natural History Museum, London) with an accelerating voltage of 20 kV, beam current of 10 nA and electron-beam diameter of 1 μm (for detailed analytical conditions, including analysis of F, see Supplementary Table 1, details below).
Powder X-ray diffraction data were collected by the Gandolfi method (φ-ω rotation) using a Stoe IPDS II diffractometer (St. Petersburg State University) equipped with an Image Plate detector, MoKα source and graphite monochromator, operating at 50 kV, 40 mA, with a detector-to-crystal distance of 200 mm and an exposure time of 60 min.
For single-crystal investigations, pyrochlore crystals were placed on a STOE IPDS II diffractometer (MoKα radiation, 50 kV, 40 mA) equipped with an Image Plate plane detector. The unit-cell parameters were refined by least-square techniques. The structures have been solved by direct methods using the SHELX program package (Sheldrick, Reference Sheldrick2015) within the Olex2 shell (Dolomanov et al., Reference Dolomanov, Bourhis, Gildea, Howard and Puschmann2009). Correction for absorption was introduced analytically with allowance for crystal shape. The final model included coordinates and anisotropic thermal parameters for all atoms.
Pyrochlore formulae were calculated on the assumption that the cation total in the B site is equal to 2. Nomenclature and classification of pyrochlore is based on Hogarth (Reference Hogarth1977) which is simple, clear and was used for many years in numerous publications related to pyrochlore-group minerals. Application of the current pyrochlore nomenclature and classification (Atencio et al., Reference Atencio, Andrade, Christy, Gieré and Kartashov2010; Christy and Atencio, Reference Christy and Atencio2013) revealed several problems associated with the new mineral names (e.g. Mitchell, Reference Mitchell2015; Kasatkin et al., Reference Kasatkin, Britvin, Peretyazhko and Chukanov2020). For example, all analytical data obtained during this investigation correspond to an ideal pyrochlore formula (CaNa)Nb2O6F (Table 1), which, ironically, is not considered by either Atencio et al. (Reference Atencio, Andrade, Christy, Gieré and Kartashov2010) or Christy and Atencio (Reference Christy and Atencio2013).
Table 1. Representative compositions of pyrochlore.

Blanks in the Table – content of the element is below detection limit. OHcalc and Ocalc – calculated from charge balance.
Statistical methods were applied to analyse oscillatory zoning in the pyrochlore crystals. Fractal dimensions of a strange attractor were calculated using a well-known correlation dimension method (Grassberger and Procaccia, Reference Grassberger and Procaccia1984; Moon, Reference Moon1987; Perugini et al., Reference Perugini, Poli and Valentini2005). A series of pseudo-phase spaces of different embedded dimensions D emb = 1, 2…12 was constructed from a single ‘time series’ (intensity of back-scattered electron image I as a function of spatial variable r – see Fig. 10 below), so that I(D emb,r) = I(r + (D emb–1)Δr). The value of shift Δr was chosen to be 10 points (pixels); variations of this value did not affect the result significantly. The correlation dimensions D were determined for all these pseudo-phase spaces. The higher embedded dimension is used, the higher correlation dimension is obtained, however, starting from some D emb the value of D stops changing, informing on the maximal dimension D max. This value characterises the fractal dimension of a strange attractor under consideration. As the number of points in a profile is small (≤500), it was not obvious if this approach can provide reliable results. Therefore, for samples KS 24 and LL 445 measurements were also made for the same images with lower resolutions (161 instead of 285 and 265 instead of 500 points for the same profiles). The differences in D max did not exceed 0.2 confirming applicability of our approach. The value of D max contains information on the complexity of the system and the value M = 1 + [D max] (brackets denote truncation) represents the minimal number of ordinary differential equations that are necessary to reproduce the pattern observed (Moon, Reference Moon1987).
Pyrochlore morphology, zoning and composition
Pyrochlore is an extremely rare mineral in the calcite carbonatite lavas, and relatively common, although accessory, in samples of intrusive calcite carbonatite. In thin sections, pyrochlore occurs as euhedral-to-subhedral crystals up to 10 μm in diameter (with one crystal of 30 μm) and is typically observed in association with apatite or magnesioferrite/magnetite. A single pyrochlore crystal is present in a nyerereite inclusion in magnesioferrite in carbonatite lava (see figure 13 in Zaitsev et al., Reference Zaitsev, Keller, Spratt, Perova and Kearsley2008). In the heavy mineral fraction from carbonatite eluvial deposits within the Loluni and Kisete craters, pyrochlore occurs as euhedral octahedral (common) to cubo-octahedral (rare) crystals up to 300 μm in size (Fig. 3). The cubo-octahedral crystals were observed in the sample from the Kisete crater only.

Fig. 3. Secondary electron images of pyrochlore crystals. Octahedral pyrochlore from the (a) Loluni and (b) Kisete craters; (c, d) cubo-octahedral pyrochlore from the Kisete crater.
Back-scattered electron (BSE) images show that the majority of crystals are characterised by fine-to-coarse oscillatory (rhythmic) zoning, sometimes combined with sector zoning (Figs 4, 5). A few crystals consist of at least two pyrochlore populations with compositionally different core and rims together with oscillatory zoning (Fig. 4c, Table 1). One crystal contains angular fragments of pyrochlore, which are mantled by homogeneous, but compositionally different pyrochlore (Fig. 4d, Table 1). Any features suggestive of late-stage alteration of pyrochlore (e.g. irregular, patchy zonation, veinlets) are extremely rare and observed only in the outer part of the rim (Fig. 4b).

Fig. 4. Back-scattered electron images showing internal zonation in pyrochlore from the Loluni crater.

Fig. 5. Back-scattered electron images showing internal zonation in pyrochlore from the Kisete crater.
All crystals are compositionally inhomogeneous and characterised by large variations in the contents of major and minor elements; however, all data correspond to an ideal end-member formula (CaNa)Nb2O6F (Table 1). Although, there is a partial overlap of pyrochlore compositions from the Loluni and Kisete craters they are noticeably separated on elemental bivariate plots (Fig. 6). Pyrochlore from Loluni is enriched in Zr, U and REE while pyrochlore from Kisete contains more Ti, Ca, Na and F. One hundred and fifty spot analyses, each for 26 elements, were obtained from 22 pyrochlore crystals.

Fig. 6. Compositional variations of pyrochlore from the Loluni (red) and Kisete (blue) craters.
Niobium is the dominant component of the B site (38.1–67.7 wt.% Nb2O5, 1.22–1.89 atoms per formula unit (apfu)); Ti and Zr are present at elevated levels (from below detection limit (bdl) to 7.3 wt.% TiO2, 0.33 apfu and to 14.4 wt.% ZrO2, 0.50 apfu) and the Ta content is very low (bdl – 0.9 wt.% Ta2O5, 0.02 apfu). Sodium and Ca are dominant cations of the A site (2.9–7.5 wt.% Na2O, 0.36–0.90 apfu and 13.0–20.1 wt.% CaO, 0.94–1.41 apfu), and none of the other cations exceed 20% of total cations. Some of the pyrochlore crystals contain a considerable amount of U (up to 19.4 wt.% UO2, 0.30 apfu) and can be termed ‘U-rich pyrochlore’, while others are characterised by an elevated content of light rare earth elements (La–Sm) (up to 8.3 wt.% LREE2O3, 0.21 apfu) with Ce as the dominant element (Ce-rich pyrochlore). Minor components include Fe (up to 1.9 wt.% Fe2O3), Mg (up to 1.9 wt.% MgO), and Si (up to 2.3 wt.% SiO2). Calculated mineral formulae show that an A-site vacancy (up to 1.5% of the site) is present in 29 examples only (19% of all data).
Individual crystals with oscillatory zoning have variations in all major, and some minor elements, including Ca, Na, Nb, Ti, Zr, U and REE. The largest absolute differences in neighbouring zones correspond to Ca and Na (up to 0.14 apfu), whereas the maximum relative differences correspond to U and Ce (up to 50%). Sector zoned crystals have enrichment of octahedral sectors in Na, U, Ti and Si, whereas cubic sectors are enriched in Ca, Nb and rarely Zr (see detailed discussion below).
The characteristic feature of the pyrochlore from the Loluni crater is enrichment in Zr (Table 1, Fig. 6). It typically contains between 1.0 and 6.9 wt.% ZrO2, and the angular cores in the crystal shown in Fig. 4e contain 12.3–14.4 wt.% ZrO2. An exception is one crystal with well-developed oscillatory zoning (Fig. 4a), which contains little Zr (from bdl to 0.1 wt.% ZrO2).
In extensively zoned crystals, with a distinct core and rim (Fig. 4c), Zr is concentrated in the core (up to 4.6–6.9 wt.% ZrO2); the element content decreases towards the outer part of the core (up to 1.1 wt.% ZrO2) with the rim containing even less Zr (0.5–0.7 wt.% ZrO2). The Zr-rich cores also contain significant U (up to 15.7 wt.% UO2). As expected, Zr has a negative correlation with Nb, together with Ca and F and Zr positively correlates with U (Fig. 6).
Powder X-ray diffraction
X-ray diffraction (XRD) data were obtained for five crystals with different compositions from the Loluni and Kisete craters (Guteneva, Reference Guteneva2012). The powder XRD patterns display well-defined sharp lines which are indexed in the Fd  $\bar{3}$m space group. The powder XRD data (I, d and hkl) for two crystals, one with the highest U and Zr content (LL 444) and another one with the lowest U and Zr (KS 21) are given in Supplementary Table 2. The unit-cell dimension a for the crystals from Loluni and Kisete are 10.4152(1) and 10.3763(1) Å, respectively.
Single-crystal X-ray diffraction analysis
The crystal structures were solved for eight samples from Loluni and Kisete (Guteneva, Reference Guteneva2012) with the best sets of X-ray diffracted intensities collected from the pyrochlore crystals LL 441 and KS 23. The structure refinement yielded R 1 = 0.0206 and 0.0290 for all independent reflections for LL 441 and KS 23, respectively. The pyrochlore crystal structure is typical for pyrochlore-group minerals with the ideal formula A 2B 2O6Z 1, space group Fd  $\bar{3}$m and is based on an octahedral framework of corner-sharing BO6 octahedra that form chains parallel to [110] direction with A cations and Z anions within the interframework space (Rouse et al., Reference Rouse, Dunn, Peacor and Wang1998; Cámara et al., Reference Cámara, Williams, Della Ventura, Oberti and Caprilli2004; Li et al., Reference Li, Yang, Lu, Xiong, Ge, Pan and Fourestier2016; Ivanyuk et al., Reference Ivanyuk, Yakovenchuk, Panikorovskii, Konoplyova, Pakhomovsky, Bazai, Bocharov and Krivovichev2019)
The crystallographic data and parameters of refinement are given in Table 2; atomic coordinates, equivalent displacement parameters and site occupancies are given in Table 3; selected interatomic distances are given in Table 4. Anisotropic displacement parameters are given in Supplementary Table 3. The crystallographic information files have been deposited with the Principal Editor of Mineralogical Magazine and are available as Supplementary material (see below).
Table 2. Crystal data and structure refinement parameters.

Table 3. Atom coordinates, equivalent displacement parameters (Å2) and site occupancies.

* s.s. = refined site scattering; s.s.calc = calculated site scattering
** O/OH/F ratio in O and Z sites is calculated from the charge balance of formulas and amount of F.
Table 4. Selected interatomic distances (Å).

Occupancies of the cation sites were calculated from the experimental site-scattering factors taking into account the empirical elemental composition. The refined site occupancies for the A, B and Z sites are given in Table 3. Refinement of the B site was undertaken using Nb scattering factors for both LL 441 and KS 23 crystals and F scattering factors were used for the Z site. Mixed scattering factors were used for refinement of the A site: Ca-U in the case of LL 441 and Ca-Na in the case of KS 23. These refined site occupancies were used to calculate the number of electrons per formula unit (epfu) for A, B and Z sites, i.e. refined site-scattering factors (Table 3). Simultaneously, the final occupancies for the A, B and Z sites were calculated, taking into account the compositional data. Then the number of electrons per formula unit (epfu) were again calculated for A, B and Z sites, i.e. calculated site-scattering factors (Table 3). We distributed the cations by sites according to the distribution indicated in Table 1: A site: Ca, Na, U, REE, Mn and Sr; B site: Nb, Zr, Ti, Si, Fe, Mg and Al. The O/OH/F ratio in O and Z sites is calculated from the charge balance of formulas and amount of F. It should be noted that the values of refined site-scattering and calculated site-scattering factors are in good agreement, which indicates the reliability of our proposed model of the occupancies of the A, B and Z sites discussed below.
The A (16d) site has 8-fold coordination with 6 O and 2 Z anions with the mean <A–O,Z> bond length of 2.534 Å and 2.532 Å for LL 441 and KS 23, respectively (Table 4). The A site in both crystals is predominantly occupied by Ca and, to a lesser extent, by Na. However, the differences in Ca and Na cannot account for significant observed differences in the occupancy of the A site. The refined site-scattering factors for the A site are 25.0 and 17.1 epfu for LL 441 and KS 23, respectively (Table 3). This difference is explained by the presence of a significant amount of REE and U in sample LL 441 (Table 1). In contrast, sample KS 23 is depleted in these elements compared to LL 441, and the A site is almost completely occupied by Ca and Na (Table 1). The full occupancy of the A site can be given as: (Ca0.515Na0.325U0.08Ce0.06La0.01Nd0.01Pr0.005Mn0.005Sr0.005Y0.005) for the LL 441 sample and (Ca0.58Na0.39U0.015Sr0.01) for the KS 23 sample, respectively.
The B (16c) site is octahedrally coordinated by 6 O with the mean <B–O> bond length of 1.988 Å and 1.975 Å for LL 441 and KS 23, respectively (Table 4). The octahedral B site for both samples is predominantly occupied by Nb atoms. The refined site-scattering factors for the B site are 38.13 and 37.72 epfu for LL 441 and KS 23, respectively (Table 3). However, regardless of the similarity of calculated epfu values, this site is occupied differently. The LL 441 sample is characterised by a significant amount of Zr, Fe and Mg, with an almost complete absence of Ti, while KS 23 contains a significant amount of Ti and practically no Zr. The full occupancy of the B site can be given as: (Nb0.865Zr0.06Mg0.04Fe0.035Al0.005) for the LL 441 sample and (Nb0.835Ti0.11Si0.03Fe0.02Zr0.005) for the KS 23 sample.
The O (48f) site is occupied by oxygen with minor (OH) groups in crystal KS 23. The Z (8b) site is occupied by F and O for sample LL 441 with occupancy F0.54O0.46 and by F and OH in the case of sample KS 23 with occupancy F0.90OH0.10 (Table 3). The O/OH/F ratio in O and Z sites was calculated from the charge balance arguments and F content, which was determined by electron microprobe analysis.
In summary, the crystal chemical formulae of the pyrochlore can be written as (Ca1.03Na0.65U0.16Ce0.12La0.02Nd0.02Pr0.01Mn0.01Sr0.01Y0.01)Σ2.03(Nb1.73Zr0.12Mg0.08Fe0.07Al0.01)Σ2.00O6(F0.54O0.46)Σ1.00for the LL 441 crystal and (Ca1.16Na0.78U0.03Sr0.02)Σ1.99(Nb1.67Ti0.22Si0.06Fe0.04Zr0.01)Σ2.00(O5.89OH0.11)Σ6.00(F0.90OH0.10)Σ1.00 for the KS 23 crystal. Both crystal chemical formulae are in good agreement with the empirical formulae (Table 1).
Discussion
Compositional variations
Pyrochlore-group minerals in carbonatites are recognised as important tracers of geochemical evolution of carbonatite melts, they are key indicators of different subsolidus processes (e.g. recrystallisation, hydrothermal alteration and weathering) and help in an understanding of the processes related to carbonatite formation (fractional crystallisation, liquid immiscibility and magma mixing) together with relationships with associated silicate rocks (e.g. Chakhmouradian and Zaitsev, Reference Chakhmouradian and Zaitsev1999; Hogarth et al., Reference Hogarth, Williams and Jones2000; Chakhmouradian and Williams, Reference Chakhmouradian, Williams, Wall and Zaitsev2004; Zurevinski and Mitchell, Reference Zurevinski and Mitchell2004; Lee et al., Reference Lee, Lee, Garcia, Moutte, Williams, Wall and Kim2006; Zaitsev et al., Reference Zaitsev, Williams, Wall and Zolotarev2012; Walter et al., Reference Walter, Parsapoor, Braunger, Marks, Wenzel, Martin and Markl2018). The major problem in pyrochlore studies seems to be an ‘old’ emplacement age for the majority of carbonatites. Decay of U and Th, common elements in early crystallised pyrochlore, and low-temperature hydrothermal activity lead to the destruction of crystal structure and significant changes in mineral composition, particularly in the A site. Due to this, primary textures and compositions are rarely observed in pyrochlore (Hogarth et al., Reference Hogarth, Williams and Jones2000), though they can be relatively common in pyrochlore from ‘young’ carbonatites, e.g. from the Kaiserstuhl plutono-volcanic complex, SW Germany (Walter et al., Reference Walter, Parsapoor, Braunger, Marks, Wenzel, Martin and Markl2018); Tinderet volcano, Kenya (Zaitsev et al., Reference Zaitsev, Wenzel, Vennemann and Markl2013); Camile dyke at São Vicente island, Cape Verde (Hodgson and Le Bas, Reference Hodgson and Le Bas1992); and Fort Portal volcano, Uganda (Hogarth and Horne, Reference Hogarth and Horne1989). All these processes, which have a strong influence on changes of pyrochlore texture and composition, are lacking at Kerimasi where pyrochlore is crystalline, even with 19.4 wt.% UO2, exhibits well-developed compositional zoning, and has few or no signs of hydrothermal alteration. Lack of hydrothermal overprint could be related to volatile loss during volcanic activity and/or magma rapid ascent and eruption without long-time storage in crustal intermediate chamber(s) under closed-system conditions. Results from a detailed investigation of pyrochlore from the Kaiserstuhl volcanic complex show that hydrothermal alteration could be a common phenomenon in carbonatites crystallised from an evolved melt and also related to the geometry and size of carbonatite bodies (Walter et al., Reference Walter, Parsapoor, Braunger, Marks, Wenzel, Martin and Markl2018).
Compositionally, pyrochlore from Kerimasi differs from pyrochlore-group minerals from many other localities in that it lacks an early-crystallised U–Ta-rich pyrochlore (‘uranopyrochlore’) (e.g. Chakhmouradian and Zaitsev, Reference Chakhmouradian and Zaitsev1999; Subbotin and Subbotina, Reference Subbotin and Subbotina2000; Chakhmouradian and Williams, Reference Chakhmouradian, Williams, Wall and Zaitsev2004; Lee et al., Reference Lee, Lee, Garcia, Moutte, Williams, Wall and Kim2006; Zaitsev et al., Reference Zaitsev, Williams, Wall and Zolotarev2012; Viladkar et al., Reference Viladkar, Bismayer and Ziietlow2017; Walter et al., Reference Walter, Parsapoor, Braunger, Marks, Wenzel, Martin and Markl2018). Although the U content can be as high as 19.4 wt.% UO2, the concentration of Ta is extremely low (≤0.9 wt.% Ta2O5 only). Instead of Ta, the pyrochlore with high U contains elevated levels of Zr and rarely Ti (Table 1, Fig. 6).
Zirconium-rich pyrochlore-group minerals are not common for carbonatites; typically ZrO2 in pyrochlore does not exceed 4–5 wt.% (e.g. Hogarth et al., Reference Hogarth, Williams and Jones2000; Chakhmouradian and Williams, Reference Chakhmouradian, Williams, Wall and Zaitsev2004; Melgarejo et al., Reference Melgarejo, Costanzo, Bambi, Gonçalves and Neto2012; Zaitsev et al., Reference Zaitsev, Williams, Wall and Zolotarev2012, Reference Zaitsev, Williams, Jeffries, Strekopytov, Moutte, Ivashchenkova and Spratt2014). Examples with much higher Zr concentration in pyrochlore-group minerals are rare and include carbonatites from the Oka complex, Canada (up to 16.3 wt.% ZrO2, Zurevinski and Mitchell, Reference Zurevinski and Mitchell2004); Kaiserstuhl (up to 12.5 wt.%, Walter et al., Reference Walter, Parsapoor, Braunger, Marks, Wenzel, Martin and Markl2018); Kovdor, Russia (up to 12.4 wt.%, authors unpublished data); Camile dyke at São Vicente island (up to 10.3 wt.%, Hodgson and Le Bas, Reference Hodgson and Le Bas1992); and Vuoriyarvi, Russia (up to 8.7 wt.%, Chakhmouradian and Williams, Reference Chakhmouradian, Williams, Wall and Zaitsev2004). Zr-rich pyrochlore also occurs in Guaniamo kimberlites, Venezuela (up to 23.7 wt.% ZrO2, Sharygin et al., Reference Sharygin and Sobolev2009) and syenitic ejecta in pyroclastic rocks of the Sabatini volcano, Italy (up to 8.4 wt.%, Caprilli et al., Reference Caprilli, Della Ventura, Williams, Parodi and Tucceimeu2006). Reported high Zr contents in pyrochlore, particularly in studies where wet chemical analysis of bulk samples was used, could be related to the presence of baddeleyite inclusions in pyrochlore (Yaroshevskii and Bagdasarov, Reference Yaroshevskii2008). Indeed, abundant fine grained baddeleyite prismatic crystals are present in some pyrochlore, e.g. in Kovdor carbonatites (Fig. 7a), and their appearance can result from exsolution or simultaneous mineral growth. At Kerimasi the pyrochlore does not contain exsolved baddeleyite, although baddeleyite was observed as rare relics in pyrochlore cores (Fig. 7b).

Fig. 7. Back-scattered electron images showing (a) exsolved baddeleyite (white) in pyrochlore from the Kovdor calcite carbonatite; (b) relict baddeleyite (white) in pyrochlore from the Loluni crater.
Zirconium is obviously present in the B site of the crystals considered here; pyrochlore from the Loluni crater exhibits a negative correlation with Nb, though no positive or negative correlation with Ti is observed (Fig. 6). In addition, the analysed crystals from Loluni have an anion excess in the Z site assuming the site occupancy by (OH) in addition to F for the charge balance; totals for F + (OH) vary between 1.04 and 1.50. This could be an indication of the presence of O instead of (OH) at the Z site as suggested by Sharygin et al. (Reference Sharygin and Sobolev2009). A simplified substitution, involving A, B and Z sites, can be suggested as U4+ + Zr4+ + O2– → Ca2+ + Nb5+ + F–.
The presence of O at the Z site (when the B site is occupied predominantly by pentavalent cations) will depend entirely on A cations. Thus, increasing the amount of U4+ and REE3+ would require increasing O2– at the Z site to maintain the charge balance. This scenario is realised for pyrochlore crystals from the Loluni crater.
Excluding synthetic oxy-compounds with a pyrochlore-type structure, well-studied natural pyrochlore-group minerals with O at the Z site are rare. Examples are ‘stibiobetafite’ from pegmatititic Vežná serpentinite, Czech Republic (Černý et al., Reference Černý, Hawthorne, Laflamme and Hinthorne1979), ‘uranbetafite’ from foid-bearing syenite ejectum in pyroclastic rock, Vico volcanic complex, Italy (Cámara et al., Reference Cámara, Williams, Della Ventura, Oberti and Caprilli2004), pyrochlore from calcite–magnetite–forsterite phoscorite, Kovdor plutonic complex (Ivanyuk et al., Reference Ivanyuk, Konoplyova, Yakovenchuk, Pakhomovsky, Panikorovskii, Kalashnikov, Bocharov, Bazai, Mikhailova and Goryainov2018) and oxybismutomicrolite from granitic pegmatite, Malkhan, Central Transbaikalia, (Kasatkin et al., Reference Kasatkin, Britvin, Peretyazhko and Chukanov2020) where compositional and single-crystal X-ray diffraction data suggest O dominance in the Z site.
The pyrochlore from the Loluni crater is remarkably similar to that of the Camile dyke at São Vicente Island (Hodgson and Le Bas, Reference Hodgson and Le Bas1992). The latter occurs as cubic and cubo-octahedral sector zoned crystals; it is rich in U (up to 16.8 wt.% UO2), Zr (up to 10.3 wt.% ZrO2) and poor in Ta (up to 0.4 wt.% Ta2O5). Moreover, it contains Si (up to 2.4 wt.% SiO2) in an octahedron growth sector (see below).
High concentrations of Zr are a characteristic feature of the Kerimasi intrusive carbonatites, which contain baddeleyite, calzirtite and kerimasite; all Zr minerals sensu stricto (Church, Reference Church1995; Zaitsev et al., Reference Zaitsev, Williams, Britvin, Kuznetsova, Spratt, Petrov and Keller2010). Zirconolite was described by Church (Reference Church1995) but was not found in this investigation. Unfortunately, the relationships between these minerals (e.g. succession of their crystallisation) are poorly known. Limited observations show that baddeleyite was the first mineral to crystallise and was replaced and overgrown by kerimasite (see figure 2d in Zaitsev et al., Reference Zaitsev, Williams, Britvin, Kuznetsova, Spratt, Petrov and Keller2010) or pyrochlore (Fig. 7b). Calzirtite crystals always occur separately from other Zr minerals.
Another compositional feature of the Kerimasi pyrochlore is the variable content of Si (Table 1). The pyrochlore from Loluni contains very low Si that varies from bdl to 0.16 wt.% SiO2; in contrast, pyrochlore from Kisete is enriched in Si with a maximum value of 2.28 wt.% SiO2. The element is present in crystals with sector zoning (Table 1, Fig. 5) and it is concentrated in octahedral growth sectors (0.24–2.28 wt.%, with average 0.86 and 1σ = 0.46 wt.%); cubic growth sectors are depleted in Si and contains from bdl to 0.17 wt.% SiO2 only (average 0.06 with 1σ = 0.04 wt.%).
Silicon is still an enigmatic component of pyrochlore-group minerals, generally its concentration in primary, unaltered minerals is very low, but can reach several wt.% in highly altered crystals, e.g. up to 4.7 wt.% SiO2 in pyrochlore from the Khibina carbonatites (Zaitsev et al., Reference Zaitsev, Williams, Wall and Zolotarev2012). Other examples of Si-enriched pyrochlore-group minerals include pyrochlore from the Meech Lake glimmerite (Hogarth et al., Reference Hogarth, Williams and Jones2000), diverse alkaline rocks from Lovozero, Khibina, Vishnevye Mountains and other localities (Chakhmouradian and Mitchell, Reference Chakhmouradian and Mitchell2002). Single-crystal X-ray diffraction analysis and transmission electron microscopy suggest that Si can be present “in an amorphous or dispersed state” (Voloshin et al., Reference Voloshin, Pakhomovskiy, Pushcharovskiy, Nadezhina, Bakhchisaraitsev and Kobyashev1989, p. 19) or “only a fraction (~30–50%) of the Si… is incorporated within the structure… The remaining 50–70%… is incorporated in the radiation-damaged portions of pyrochlore” (Bonazzi et al., Reference Bonazzi, Bindi, Zoppi, Capitani and Olmi2006, p. 794). In our case, the crystals crystallinity, internal zoning, composition and lack of subsolidus alteration (Table 1, Fig. 5) suggest that Si is present in the B site of the Kisete pyrochlore.
Sector zoning
The pyrochlore crystals from Kisete exhibiting both {100} and {111} growth sectors demonstrate sector zoning in BSE intensity (Fig. 5), i.e. variations in composition. As these crystals possess pronounced concentric zoning, comparison of different sectors was obtained for the chronologically equivalent growth zones. The compositional data of corresponding pairs of points is listed in Table 1, shown on Supplementary Fig. 1 and the intersectorial differences for the most significant elements are listed in Table 5 together with the data from São Vicente (Hodgson and Le Bas, Reference Hodgson and Le Bas1992), to our knowledge the only paper considering pyrochlore sector zoning.
Table 5. Sector zoning in pyrochlore crystals.

First number in each cell denotes the difference Δx = x {111} – x {100} (apfu), and the second one – the average value x av = (x {111} + x {100}) / 2 (apfu), respectively (calculated on the basis of two B-site cations). Sample KS 21 – values averaged over 4 pairs of points, sample KS 24 – over 2 pairs of points (Table 1, Supplementary Fig. 1). bdl – below detection limit. *For the sample KS 22 no morphological observations were possible and {hkl} indices were ascribed to growth sectors using the concentration differences in U.
Table 5 shows that growth sectors of octahedra are always enriched in Ti, Na, U, Fe and Si, whereas growth sectors of cubes are enriched in Nb (with one exception) and Ca. Due to the small concentrations no definitive conclusion can be deduced for other elements. One can expect that K is enriched in the {111} growth sectors in the Kisete crystals and in the {100} growth sectors in crystals from São Vicente (Hodgson and Le Bas, Reference Hodgson and Le Bas1992), however, there is insufficient information to be confident. Similarly, the {100} growth sectors in crystals from São Vicente seem to be enriched in La and depleted in Pb (Hodgson and Le Bas, Reference Hodgson and Le Bas1992). The intersectorial differences Δx = x {111} – x {100} for the major elements (Na, Ca, U, Nb and Ti) can be as high as 0.15; the range of Δx variations is similar for the elements occupying the A and B sites. The values of Δx for the same element vary significantly over individual crystals and zones within one crystal. There is a weak positive correlation between the difference Δx and the average concentration x av = (x {111} + x {100})/2.
Several main mechanisms were proposed to explain the formation of sector zoning: (1) Differences in growth rates of non-equivalent crystal faces define a different diffusion supply of components to the faces (Albarede and Bottinga, Reference Albarede and Bottinga1972; Tiller and Ahn, Reference Tiller and Ahn1980; Tiller, Reference Tiller1986). This mechanism requires significant differences in growth rates of corresponding faces (Shtukenberg et al., Reference Shtukenberg, Punin and Artamonova2009) and, therefore, is inapplicable for isometric pyrochlore crystals, for which cubes and octahedra can coexist in the crystal habit only if their relative growth rates differ by a factor of less than  $\sqrt 3 $ (Fig. 5). (2) Differences in growth rates of non-equivalent crystal faces define different attachment of components to the faces (Tauson, Reference Tauson2005; Shtukenberg et al., Reference Shtukenberg, Punin and Artamonova2009). This mechanism is plausible, and it typically accompanies mechanism (3), though it cannot be verified owing to the lack of information on the growth rate dependence of the distribution coefficient. (3) An additional plausible explanation is the selective adsorption of components to the face due to the differences in atomic structure of crystallographically non-equivalent crystal surfaces (Hollister, Reference Hollister1970; Hollister and Gancarz, Reference Hollister and Gancarz1971; Dowty, Reference Dowty1976; Chakhmouradian et al., Reference Chakhmouradian, Halden, Mitchell and Horváth2007). This mechanism requires different atomic arrangements of proto-sites on different growth faces, a feature that was observed for a series of compounds with sector zoning, e.g. staurolite (Hollister, Reference Hollister1970), clinopyroxene (Hollister and Gancarz, Reference Hollister and Gancarz1971), monazite (Cressey et al., Reference Cressey, Wall and Cressey1999) and perovskite (Chakhmouradian et al., Reference Chakhmouradian, Halden, Mitchell and Horváth2007) among others. Below we explore the latter hypothesis in more detail.
We assume that pyrochlore crystal faces {hkl} grow by elementary steps moving along a smooth face and having the heights of interplanar distance dhkl corrected for the presence of translation normal to the crystal face. Although incorporation occurs at kink sites on growth steps, it is sufficient to analyse the geometrical non-equivalence of sites with respect to the growth face. Indeed, any face is formed by steps of several orientations and moving in different directions. This should provide strong sub-sector or intrasector zoning (Paquette and Reeder, Reference Paquette and Reeder1990; Rakovan and Reeder, Reference Rakovan and Reeder1994), which is infrequent and, if observed, is typically much weaker than sector zoning. The most probable reason for this apparent contradiction is diffusion relaxation, which is fast in the sub-surface layers and which transforms the distribution of atoms corresponding to the growth steps on the face to that corresponding to the face itself (Chernov, Reference Chernov1984; Shtukenberg et al., Reference Shtukenberg, Popov and Punin2005). Additionally, in most cases predictions outlined for the faces remain valid for the steps on these faces.
At the growing face, some sites are geometrically more constrained than the others, allowing preferential incorporation of isomorphic ions into specific sites located on different growth faces and forming a basis for the sector zoning. Dowty (Reference Dowty1976) has suggested that smaller ions with higher charges will easily and strongly adsorb into any sites, while larger ions with lower charge are less likely to adsorb into more geometrically constrained sites. Thus, more geometrically constrained sites will be preferably occupied by smaller ions with higher charges.
The atomic arrangement in the surface layer on the {111} and {100} faces is shown in Fig. 8. On the {111} face there are two types of layers, which create two different arrangements for A sites. The first type (Fig. 8a) features six A–O bonds that are located in the surface layer and two remaining A–F bonds are directed inwards and outwards of the layer, respectively. The second type (Fig. 8b) is characterised by four A–O and two A–F bonds lying in the surface layer with two remaining A–O bonds directed inwards and outwards of the layer, respectively. The atomic surrounding of all A sites on the {100} growth face (Fig. 8c) is very similar to the latter case. As A–O bonds (dA –O = 2.57 Å) are slightly weaker than A–F bonds (dA –F = 2.25 Å) A sites on the {100} faces are slightly more under-bonded compared with A sites on the {111} ones meaning that {100} growth sectors should be preferentially occupied by smaller cations with higher charges in the A site. This is correct for Na+ (1.32 Å) and Ca2+ (1.26 Å), but opposite for U4+ (1.14 Å) (here and below ionic radii from Shannon (Reference Shannon1976) are given in parentheses.)

Fig. 8. Projection of pyrochlore crystal structure on {111} growth faces (a,b); and {100} growth faces (c). Blue octahedra (two types) = BO6 groups; small red spheres = A sites; large green spheres = (OH,F) sites. The edges of the unit cell are depicted in green.
The B sites are located inside growth layers for both {100} and {111} growth surfaces and their first coordination spheres are completed. However, in cases shown in Fig. 8b,c three B–O bonds involve oxygen atoms on the outer surface of the growth layer, while for one layer on the {111} face (Fig. 4a) there is only one such oxygen. As surface oxygens can be removed more easily, B sites on the {111} growth faces are under stronger geometrical constraints and should be considered as less under-bonded, meaning that {111} growth sectors should be occupied preferentially by smaller B cations with higher charges. Indeed, the smaller Ti4+ (0.75 Å) and Si4+ (0.54 Å) prefer the {111} growth sectors, while the larger Nb5+ (0.78 Å) the {100} ones. The charge difference between Nb5+ vs. Ti4+ is apparently not significant enough to counteract the difference in ionic radii. Large Fe3+ (0.79 Å) with low charge, however, also prefer the {111} growth sectors that might mean that preferential incorporation of Fe is controlled by the charge compensation mechanisms rather than the geometrical constraints (Chakhmouradian et al., Reference Chakhmouradian, Halden, Mitchell and Horváth2007).
Perovskite-group minerals are very similar to pyrochlore-group minerals. They have comparable composition ABO3 (A = Ca, Na, Sr, LREE, U…; B = Ti, Nb, Fe…), form cubic crystal structures with BO6 octahedra linked by corners and with the cavities filled by A ions in 12-fold coordination and their crystal shapes are dominated by the cube and octahedron. Therefore, it is worth comparing sector zoning in these minerals. The sector zoning in perovskite was analysed in detail (Chakhmouradian et al., Reference Chakhmouradian, Halden, Mitchell and Horváth2007) and it was found that the {100} sectors were enriched in K, Ce, Ti, Sr, Ba, Y, Th, U, Fe, Si and Zr with respect to the {111} sectors, which had higher levels of Ta, Ca, Nb and sometimes Na. Thus, the elements that reveal strong and consistent sector zoning in both minerals (Ca, Nb, U, Si and Fe), have the opposite preferable incorporation into {100} and {111} growth sectors. The opposite preferable incorporation is well corroborated with the opposite distribution of more and less geometrically constrained sites on the corresponding growth faces (Fig. 9).

Fig. 9. Projection of perovskite crystal structure on {111} growth faces (a); and {100} growth faces (b). Blue octahedra = BO6 groups; red spheres = A sites.
The simple geometrical analysis correctly predicts sector zoning in both, pyrochlore and perovskite, and highlights the importance of structural control in sector zoning formation. The correspondence is not perfect, however. In pyrochlore, the behaviour of U does not obey Dowty's hypothesis and some minor elements including K, Pb, Ce, La and Zr do not show a consistent sector zoning pattern. One possible reason for the discrepancy is the complex nature of element substitutions in pyrochlore that makes the A and B sites interdependent of one another. Whereas, the major components follow the substitution mechanism Na+ + Nb5+ ↔ Ca2+ + Ti4+, the other components such as U4+ or REE3+ require different substitution mechanisms that might only partially comply with the geometrical constraints. Additionally, the analysis above does not consider the effect of growth kinetics on distribution coefficients and sector zoning (mechanism (2)) that might be significant.
Oscillatory zoning
Oscillatory zoning is more common than sector zoning in pyrochlore crystals (Hogarth et al., Reference Hogarth, Williams and Jones2000; Zurevinski and Mitchell, Reference Zurevinski and Mitchell2004; Lee et al., Reference Lee, Lee, Garcia, Moutte, Williams, Wall and Kim2006; Sharygin et al., Reference Sharygin and Sobolev2009; Walter et al., Reference Walter, Parsapoor, Braunger, Marks, Wenzel, Martin and Markl2018; Mitchell et al., Reference Mitchell, Wahl and Cohen2020). Crystals from both Loluni and Kisete are also characterised by a distinct μm-scale oscillatory zoning (Figs 4, 5, 7, 10). The largest absolute differences between neighbouring zones correspond to Ca and Na (up to 0.14 apfu), whereas the maximal relative differences correspond to U and Ce (up to 50%). Concentrations of U, Ce, Ca, Fe and Mg have sympathetic relations with the brightness of BSE images, whereas Nb and Na exhibit an antipathetic relation (Fig. 11). Correlation between individual elements is present, although not very strong, suggesting different evolutionary trends for different elements. Our new and previously published data (Hogarth et al., Reference Hogarth, Williams and Jones2000; Subbotin and Subbotina, Reference Subbotin and Subbotina2000; Zurevinski and Mitchell, Reference Zurevinski and Mitchell2004; Walter et al., Reference Walter, Parsapoor, Braunger, Marks, Wenzel, Martin and Markl2018; Mitchell et al., Reference Mitchell, Wahl and Cohen2020; Lee et al., Reference Lee, Lee, Garcia, Moutte, Williams, Wall and Kim2006) have revealed some common features of pyrochlore oscillatory zoning. The zoning is variable: it can be found throughout the whole crystal or in limited regions; there are also crystals without oscillatory zoning. The oscillatory zoning is observed in crystals of different compositions. Even within one sample it is possible to find crystals of different composition and zoning (Zurevinski and Mitchell, Reference Zurevinski and Mitchell2004). The thickness of zones varies from a few μm up to hundreds of μm. The boundaries between individual zones are sharp and compositional variations within each zone are slight (due to the data averaging normal to the growth direction profiles in Fig. 10 are even slightly smoother than in reality). The zoning pattern is the same within any growth sector and in different growth sectors of the same crystal.

Fig. 10. Brightness of the BSE image (I, grey scale levels) vs. the distance from the crystal core r. (a) sample LL 445, see Fig. 4a; (b) sample LL 437, see Fig. 4b; (c) sample KS 24, see Fig. 5b; and (d) crystal from Fig. 2c from Hogarth et al. (Reference Hogarth, Williams and Jones2000).

Fig. 11. Pyrochlore composition (Na, Nb, Ce, Fe, Ca, Mg and U, apfu) and brightness of BSE image (I, grey scale levels) plotted as a distance from the crystal centre (r, μm) for sample LL 445. Location of points is shown in Supplementary Fig. 1b, the whole BSE profile is shown in Fig. 10a.
A number of mechanisms can form oscillatory zoning in minerals (some of these are reviewed by Shore and Fowler, Reference Shore and Fowler1996), and the applicability of these to pyrochlore is discussed below.
Growth rate variations can affect distribution coefficients and crystal composition, however, because of very large concentration differences between the neighbouring zones such a mechanism would require non-realistic growth rate variations. Other external factors such as sudden temperature variations, pressure release and loss of volatile components due to the system opening should be ruled out because all these catastrophic events are followed by a gradual relaxation of the system that should result in asymmetric zoning profiles. In reality, compositional changes between different zones are typically sharp without asymmetrical gradation (Figs 4, 5, 7, 10).
Periodic magma injections with subsequent magma mixing could be another reason for formation of oscillatory zoning in mineral crystals. Early-stage, high-temperature carbonatites typically form magmatic sheet intrusions, dykes and dykelets, with variable thickness-to-length scale. The low viscosity of a carbonatite melt (Treiman, Reference Treiman and Bell1989) suggests a turbulent flow of magma and the formation of convection cells in dykes. Therefore, unlike basalt and rhyolite magmas (Perugini et al., Reference Perugini, Poli and Mazzuoli2003) a long-term mixing process during carbonatite formation is impossible and cannot be responsible for the appearance of oscillatory zoning in pyrochlore (in contrast to, e.g. plagioclase, Perugini et al., Reference Perugini, Poli and Valentini2005).
Diffusion-attachment instabilities at the growth front (L'Heureux, Fowler, Reference L'Heureux and Fowler1994; L'Heureux, Katsev, Reference L'Heureux and Katsev2006; Kalischewski et al., Reference Kalischewski, Lubashevsky and Heuer2007) can also lead to the compositional oscillations. However, any such mechanism typically produces oscillations in a narrow range of compositional and growth conditions, while oscillatory zoning in pyrochlore features crystals of very different compositions and compositional variations.
Micromorphological instabilities of the growing face (Shtukenberg and Punin, Reference Shtukenberg and Punin2011) are not applicable here, because the zoning patterns are very similar in different parts of the same growth sector and in different growth sectors of the same crystal. Moreover, compositional variations between neighbouring zones of the same crystal are too large to be produced by this mechanism.
Thus, external oscillations, diffusion-attachment instabilities and instabilities of crystal growth cannot significantly contribute to oscillatory zoning in pyrochlore. All the observed features, however, can be explained via convectional instabilities in magma (Fig. 12a). Indeed, magma in the chamber can be stratified chemically. The pyrochlore crystals are small (usually <1 mm, our crystals <0.3 mm) and should be influenced by flows and convection currents with no or slight gravitational settling (Treiman, Reference Treiman and Bell1989). Any particular crystal can follow convection currents for a long time. During this time it would be in contact with the same melt and produce a chemically homogeneous zone. However, due to hydrodynamic instabilities the crystal can migrate into another convection circle or get into stagnant melt between neighbouring currents or near the dyke wall. At this moment the melt composition changes abruptly and a zone of another composition starts forming. The crystal can then migrate either back to the original convection current or into some other area of the growth chamber. As a result, crystals nucleated in the same area can be found in different parts of the chamber. Conversely, crystals with different growth histories can come to the same area at the final stage of crystallisation. This model can explain the occurrence of chemically different crystals (Zurevinski and Mitchell, Reference Zurevinski and Mitchell2004) or crystals with and without oscillatory zoning (Hodgson and Le Bas, Reference Hodgson and Le Bas1992) in samples located not far from one another (spaced less than 1 metre).

Fig. 12. Schematic illustration of convectional currents forming (a) in a dyke (sub-vertical flat layer heated from below) and (b) in a horizontal flat layer heated from below.
Mass transfer in a dyke is similar to mass transfer in a vertical flat layer heated from the bottom. Experimental modelling of hydrothermal crystal growth in such a layer (Popov et al., Reference Popov, Tsivinskaya, Bekker, Kokh and Kokh2006) has confirmed the intuitive arguments formulated above. It was observed that for some time a solution circulated within stratified convective currents. Then, suddenly the liquid was exchanged between upper and lower currents. This event was followed by another period of more organised flow within newly established convective cells.
Statistical analysis of oscillatory zoning (Table 6) has determined that the values of fractal dimension of strange attractor D max for all analysed crystals are essentially the same and slightly smaller than 3 (except for one case where D max = 3.8). This range corresponds to chaotic dynamics of the system, neither deterministic (D max = 1), nor random (D max is high and approaches infinity). The values are close to one another suggesting a similar origin of oscillatory zoning in all crystals studied, including those from the Fen complex, Norway (Hogarth et al., Reference Hogarth, Williams and Jones2000) and from Kovdor (author's unpublished data). This result is not surprising, as visually oscillatory zoning in pyrochlore of differing compositions and from different localities looks very similar, see Figs 4, 5, 7 and also BSE images in Hogarth et al. (Reference Hogarth, Williams and Jones2000), Subbotin and Subbotina (Reference Subbotin and Subbotina2000), Zurevinski and Mitchell (Reference Zurevinski and Mitchell2004) and Walter et al. (Reference Walter, Parsapoor, Braunger, Marks, Wenzel, Martin and Markl2018). As in most cases D max < 3, formation of oscillatory zoning is supposed to be controlled by three ordinary differential equations (Moon, Reference Moon1987). This hypothesis is consistent with the fact that Rayleigh–Bénard convection (Fig. 12b), which is close to the convectional instability discussed here, can be also described by three differential equations (Moon, Reference Moon1987).
Table 6. Fractal dimension of strange attractor D max for pyrochlore crystals.

*Two values of D max reflect presence of two saturation values on D(D emb) plots.
Conclusions
Kerimasi is a rare example of carbonatites containing primary pyrochlore with exceptionally well preserved strong primary zoning. Regardless of an elevated U content, all the crystals investigated are crystalline and suitable for single-crystal X-ray diffraction analysis.
The detailed investigation of pyrochlore from carbonatite tuff breccias and pyroclastic breccias, which are well-exposed in walls of the Loluni and Kisete craters, found the presence of at least two compositional mineral varieties. All the crystals are notably poor in Ta, implying that U–Ta pyrochlore, a common early crystallised mineral in calcite carbonatites from elsewhere, is absent in Kerimasi rocks. Pyrochlore from Loluni is enriched in U and light REE, particularly in Ce, at the A site; elevated amounts of Zr are present in the B site, and the mineral probably contains significant concentrations of O, in addition to F, in the Z site. The mineral variety from Kisete is essentially Na–Ca pyrochlore, although it contains some U in the A site; the B site contains a significant amount of Ti and F is the dominant anion in the Z site with a low concentration of (OH). There is also a difference in the concentration of minor elements such as Mg (present in Loluni pyrochlore) and Si (present in Kisete pyrochlore). These observations suggest that Loluni and Kisete carbonatites were crystallised from compositionally different carbonatitic melts. They could be independent melt batches or related one to another by fractionation. Early baddeleyite crystallisation could be an important process controlling Zr content in a carbonatite melt. However, detailed mineralogical and geochemical investigations are needed to prove a particular model. Zoning patterns and compositional data for Zr-bearing pyrochlore from Loluni indicate melt enrichment in Zr at an early stage of mineral crystallisation, with baddeleyite as the first mineral to crystallise, followed by pyrochlore or kerimasite.
The characteristic feature of the Kerimasi pyrochlore is strong compositional inhomogeneity manifesting itself in oscillatory and sector zoning. While oscillatory zoning is relatively common in pyrochlore, the presence of sector zoning was previously observed only in carbonatites from São Vicente Island (Hodgson and Le Bas, Reference Hodgson and Le Bas1992). A probable reason for the absence of sector zoning in other locations is the absence of coexistent well-developed {111} and {100} growth sectors that are controlled by the composition and growth conditions. In this respect it is worth noting that pyrochlore from Loluni and São Vicente have nearly identical compositions. Formation of sector zoning can be explained by the preferential incorporation of smaller elements with higher charges into more geometrically constrained sites on the growing surfaces (Dowty, Reference Dowty1976). This pattern works well for most of the elements, and some discrepancies are probably associated with complex element substitution schemes simultaneously affecting A and B sites. The oscillatory zoning in pyrochlore from Kerimasi, as well as from other locations, is not consistent with the majority of mechanisms proposed to explain this phenomenon, such as: sudden temperature variations, pressure release, or loss of volatile components; periodic magma injections and magma mixing; or diffusion-attachment instabilities at the growth front. Instead it can be rationalised by considering convectional instabilities of carbonatite magmas during pyrochlore crystallisation in dykes.
Acknowledgements
We thank Structural Editor Peter Leverett, Benjamin Walter, two anonymous reviewers and Principal Editor Roger Mitchell for their critical reviews that improved the manuscript. This study was supported by the Marie Curie Fellowship (FP6) and Alexander von Humbolt Stiftung (field work), St. Petersburg State University (Pure ID 36259478) and The Natural History Museum (London). Technical support by the X-ray Diffraction and Geomodel Resource Centres (St. Petersburg State University) is gratefully acknowledged. Funding from the European Union's Horizon 2020 research and innovation programme under grant agreement No. 689909 to present this paper at the HiTech AlkCarb end of project meeting is gratefully acknowledged. The authors thank Frances Wall for the comments on the final version of the manuscript.
Supplementary material
To view supplementary material for this article, please visit https://doi.org/10.1180/mgm.2020.101