1 Introduction
Due to their importance in both fundamental research and engineering applications, compressible vortex rings generated by unsteady supersonic jets have been investigated extensively, and the best-known applications involve supersonic combustion (Hamzehloo & Aleiferis Reference Hamzehloo and Aleiferis2016), projectile launch (Zhang et al. Reference Zhang, Chen, Jiang and Li2013; Li et al. Reference Li, Jiang, Wang and Guo2015) and propulsion systems (Zhang et al. Reference Zhang, Chen, Jiang and Li2011). Accompanying the development of such compressible vortex rings, there are many other important physical phenomena involved, such as the free shear layer, shock wave diffraction, turbulence transition, shock–vortex interaction and aerodynamic noise. Therefore, the study of the growth, instability and breakdown of compressible vortex rings facilitates the understanding of many types of transient flows and compressible turbulence. Many experimental, numerical and theoretical investigations have been performed to study the evolution of supersonic jets (Arakeri et al. Reference Arakeri, Das, Krothapalli and Lourenco2004; Maeno et al. Reference Maeno, Kaneta, Morioka and Honma2005; Zare-Behtash, Kontis & Gongora-Orozco Reference Zare-Behtash, Kontis and Gongora-Orozco2008a ; Zare-Behtash, Kontis & Takayama Reference Zare-Behtash, Kontis and Takayama2008b ; Kitajima, Iwamoto & Tamura Reference Kitajima, Iwamoto and Tamura2009; Zare-Behtash et al. Reference Zare-Behtash, Kontis, Gongora-Orozco and Takayama2009a ; Zare-Behtash, Gongora-Orozco & Kontis Reference Zare-Behtash, Gongora-Orozco and Kontis2009b ; Murugan & Das Reference Murugan and Das2010; Zare-Behtash et al. Reference Zare-Behtash, Kontis, Gongora-Orozco and Takayama2010; Mariani, Quinn & Kontis Reference Mariani, Quinn and Kontis2013). However, very few works have attempted to reveal the mechanisms of the propagation of compressible vortices and their interaction with shock waves when the effects of turbulence and compressibility are important.
According to previous studies, the flow characteristics of a supersonic jet stemming from a circular nozzle are highly dependent on the Mach number and the ratio of the upstream total pressure
 $(p_{j})$
to the ambient static pressure
$(p_{j})$
to the ambient static pressure
 $(p_{0})$
, specifically the pressure ratio
$(p_{0})$
, specifically the pressure ratio
 $(n=p_{j}/p_{0})$
. The Mach number affects the structures of both the trailing jet shear layer and the compressible vortex ring. For a low Mach number, there is no shock wave, and the vortex ring is conventional and characterized by a thin core. With an increase of the Mach number, flow expansion appears to be more significant at the exit during vortex ring formation. At a high Mach number of approximately 1.4, a pair of vortex-induced shocks appears on the opposite sides of the shear layer of the primary vortex core (Hillier Reference Hillier1991), and a rearward-facing shock with a low pressure upstream and a high pressure downstream embeds inside the axial region of the vortex ring. This embedded shock propagates along with the vortex ring and its end connects with the vortex-induced shock pair (Zare-Behtash et al.
Reference Zare-Behtash, Kontis and Gongora-Orozco2008a
,Reference Zare-Behtash, Kontis and Takayama
b
; Murugan et al.
Reference Murugan, De, Dora, Das and Prem Kumar2013). These unstable waves are entrained into the vortex core, which amplifies and turns the vortex ring from laminar into turbulent flow. The turbulent vortex ring is composed of a vortex core with unstable waves, and this vortex core is filled with turbulent vortices (Minota Reference Minota1998). With an increase of the Mach number to approximately 1.5–1.65 (Brouillette & Hebert Reference Brouillette and Hebert1997; Murugan & Das Reference Murugan and Das2010; Mariani et al.
Reference Mariani, Quinn and Kontis2013), a secondary vortex ring (SVR) with an opposite circulation appears ahead of the primary vortex ring (PVR). It is believed that the embedded facing shock wave results in the formation of a shear layer ahead of the primary vortex loop, which rolls up into an SVR due to the Kelvin–Helmholtz (K–H) instability (Ishii et al.
Reference Ishii, Fujimoto, Hatta and Umeda1999; Zare-Behtash et al.
Reference Zare-Behtash, Kontis and Gongora-Orozco2008a
,Reference Zare-Behtash, Kontis and Takayama
b
; Murugan & Das Reference Murugan and Das2010; Murugan et al.
Reference Murugan, De, Dora, Das and Prem Kumar2013). Then, the SVR merges with the PVR because of the mutual interaction during its evolution and becomes a poorly defined vertical structure at a later stage (Brouillette, Tardif & Gauthier Reference Brouillette, Tardif and Gauthier1995). However, our previous studies (Zhang et al.
Reference Zhang, Chen, Li and Jiang2014) indicated that the generation mechanism of the SVRs by supersonic under-expanded jets at a low pressure ratio (
$(n=p_{j}/p_{0})$
. The Mach number affects the structures of both the trailing jet shear layer and the compressible vortex ring. For a low Mach number, there is no shock wave, and the vortex ring is conventional and characterized by a thin core. With an increase of the Mach number, flow expansion appears to be more significant at the exit during vortex ring formation. At a high Mach number of approximately 1.4, a pair of vortex-induced shocks appears on the opposite sides of the shear layer of the primary vortex core (Hillier Reference Hillier1991), and a rearward-facing shock with a low pressure upstream and a high pressure downstream embeds inside the axial region of the vortex ring. This embedded shock propagates along with the vortex ring and its end connects with the vortex-induced shock pair (Zare-Behtash et al.
Reference Zare-Behtash, Kontis and Gongora-Orozco2008a
,Reference Zare-Behtash, Kontis and Takayama
b
; Murugan et al.
Reference Murugan, De, Dora, Das and Prem Kumar2013). These unstable waves are entrained into the vortex core, which amplifies and turns the vortex ring from laminar into turbulent flow. The turbulent vortex ring is composed of a vortex core with unstable waves, and this vortex core is filled with turbulent vortices (Minota Reference Minota1998). With an increase of the Mach number to approximately 1.5–1.65 (Brouillette & Hebert Reference Brouillette and Hebert1997; Murugan & Das Reference Murugan and Das2010; Mariani et al.
Reference Mariani, Quinn and Kontis2013), a secondary vortex ring (SVR) with an opposite circulation appears ahead of the primary vortex ring (PVR). It is believed that the embedded facing shock wave results in the formation of a shear layer ahead of the primary vortex loop, which rolls up into an SVR due to the Kelvin–Helmholtz (K–H) instability (Ishii et al.
Reference Ishii, Fujimoto, Hatta and Umeda1999; Zare-Behtash et al.
Reference Zare-Behtash, Kontis and Gongora-Orozco2008a
,Reference Zare-Behtash, Kontis and Takayama
b
; Murugan & Das Reference Murugan and Das2010; Murugan et al.
Reference Murugan, De, Dora, Das and Prem Kumar2013). Then, the SVR merges with the PVR because of the mutual interaction during its evolution and becomes a poorly defined vertical structure at a later stage (Brouillette, Tardif & Gauthier Reference Brouillette, Tardif and Gauthier1995). However, our previous studies (Zhang et al.
Reference Zhang, Chen, Li and Jiang2014) indicated that the generation mechanism of the SVRs by supersonic under-expanded jets at a low pressure ratio (
 $n=1.4$
) is the rolling up of the shear layer, which is caused by the combination of two slip lines when the two triple points on the embedded shock wave interact with each other. For an under-expanded jet, the pressure at the nozzle exit is still higher than the ambient pressure, and the pressure ratio is the important parameter for measuring the under-expanded level. After formation, the SVR interacts with the PVR and rolls over the periphery of the PVR and moves upstream. For a higher Mach number of 1.8, multiple SVRs form during the evolution.
$n=1.4$
) is the rolling up of the shear layer, which is caused by the combination of two slip lines when the two triple points on the embedded shock wave interact with each other. For an under-expanded jet, the pressure at the nozzle exit is still higher than the ambient pressure, and the pressure ratio is the important parameter for measuring the under-expanded level. After formation, the SVR interacts with the PVR and rolls over the periphery of the PVR and moves upstream. For a higher Mach number of 1.8, multiple SVRs form during the evolution.
Depending on the nozzle pressure ratio (Donaldson & Snedeker Reference Donaldson and Snedeker1971), the jets can be characterized as follows: (1) subsonic jet,
 $n=1$
; (2) moderately under-expanded jet,
$n=1$
; (2) moderately under-expanded jet,
 $1.1<n\leqslant 2$
; and (3) highly under-expanded jet,
$1.1<n\leqslant 2$
; and (3) highly under-expanded jet,
 $n>2$
. In moderately under-expanded conditions, the trailing jet flow is observed to display the typical oblique shock pattern (shock diamonds). In highly under-expanded conditions, the oblique shock (barrel shock) terminates at a nearly normal shock (often called the Mach disc), where the triple point is their joint. The Mach reflection produces a reflected shock and a slip line. The slip line shows the existence of an annular shear layer with a vorticity of opposite rotation and its magnitude is approximately half of that of the main trailing jet. Due to the K–H instability along the slip lines, SVRs are generated ahead of the PVR and orbit around it (Ishii et al.
Reference Ishii, Fujimoto, Hatta and Umeda1999). Moreover, analysis of the vorticity field has shown that these secondary vortices have an opposite vorticity to that of the PVR and are approximately half its strength (Mariani et al.
Reference Mariani, Quinn and Kontis2013).
$n>2$
. In moderately under-expanded conditions, the trailing jet flow is observed to display the typical oblique shock pattern (shock diamonds). In highly under-expanded conditions, the oblique shock (barrel shock) terminates at a nearly normal shock (often called the Mach disc), where the triple point is their joint. The Mach reflection produces a reflected shock and a slip line. The slip line shows the existence of an annular shear layer with a vorticity of opposite rotation and its magnitude is approximately half of that of the main trailing jet. Due to the K–H instability along the slip lines, SVRs are generated ahead of the PVR and orbit around it (Ishii et al.
Reference Ishii, Fujimoto, Hatta and Umeda1999). Moreover, analysis of the vorticity field has shown that these secondary vortices have an opposite vorticity to that of the PVR and are approximately half its strength (Mariani et al.
Reference Mariani, Quinn and Kontis2013).
For the impulsive under-expanded flow emerging from the open end of a shock tube, the flow structures of the compressible vortex rings and shock expansion wave were observed by Arakeri et al. (Reference Arakeri, Das, Krothapalli and Lourenco2004), Brouillette & Hebert (Reference Brouillette and Hebert1997), Ishii et al. (Reference Ishii, Fujimoto, Hatta and Umeda1999) and Zare-Behtash et al. (Reference Zare-Behtash, Kontis and Gongora-Orozco2008a ,Reference Zare-Behtash, Kontis and Takayama b , Reference Zare-Behtash, Kontis, Gongora-Orozco and Takayama2009a ,Reference Zare-Behtash, Gongora-Orozco and Kontis b , Reference Zare-Behtash, Kontis, Gongora-Orozco and Takayama2010). However, since the integral nature of the visualization techniques (shadowgraph, interferometry and schlieren) is based on the density variation, these experimental visualizations cannot show the flow field in detail; therefore the evolution of the three-dimensional (3-D) flow and turbulence characteristics of the compressible vortex ring cannot be well revealed. In this paper, large-eddy simulation (LES) and high-order hybrid numerical methods are employed to numerically analyse the initiation of the 3-D flow field of a supersonic circular jet for two different pressure ratios of 1.4 (moderately under-expanded jet) and 4.0 (highly under-expanded jet). The characteristics of the generation and the propagation of the compressible vortex rings, as well as their instability and transition to turbulence are evaluated and discussed. Moreover, the radial and azimuthal modes of the flow field are investigated by Fourier analysis (Ran & Colonius Reference Ran and Colonius2009).
2 Numerical method and physical model
2.1 Numerical method
The compressible LES equations can be obtained by Favre filtering the multicomponent compressible Navier–Stokes equations in the Cartesian coordinate system (Zhang et al. Reference Zhang, Chen, Li and Jiang2014, Reference Zhang, Chen, Jiang and Huang2015, Reference Zhang, Chen, Guo and Sun2017). For closing the multicomponent LES equations, the subgrid terms are modelled using the multi-component LES equations. We choose the recently developed stretched-vortex subgrid-scales (SGS) model for the multicomponent, compressible flow to approach the unresolved subgrid terms (Lombardini et al. Reference Lombardini, Hill, Pullin and Meiron2011). The stretched-vortex SGS model was originally proposed for incompressible fluid (Misra & Pullin Reference Misra and Pullin1997) and has been extended to compressible flow (Pullin Reference Pullin2000; Kosovic, Pullin & Samtaney Reference Kosovic, Pullin and Samtaney2002; Hill, Pantano & Pullin Reference Hill, Pantano and Pullin2006). In the stretched-vortex SGS model, the subgrid scales are represented by stretched vortices, and the stretched vortex is a physical model for turbulent fine scales, which are assumed to consist of tube-like structures with concentrated vorticity (Lundgren Reference Lundgren1982). The stretched-vortex SGS model is designed for simulating turbulent fine scales and is capable of predicting subgrid-scale quantities systematically.
For a supersonic jet (Ishii et al. Reference Ishii, Fujimoto, Hatta and Umeda1999), complex phenomena, such as shock–vortex interactions and turbulent shear flow, appear in the flow; therefore, the spatial and temporal resolution requirements vary greatly. The hybrid numerical method of tuned centred difference-weighted essentially non-oscillatory (TCD-WENO) (Berger & Colella Reference Berger and Colella1989; Hill & Pullin Reference Hill and Pullin2004; Deiterding et al. Reference Deiterding, Cirak, Mauch and Meiron2007; Pantano et al. Reference Pantano, Deiterding, Hill and Pullin2007) has been applied successfully for simulating the shock-induced compressible jet flow (Zhang et al. Reference Zhang, Chen, Li and Jiang2014, Reference Zhang, Chen, Jiang and Huang2015, Reference Zhang, Chen, Guo and Sun2017). In this paper, the derivatives of inviscid fluxes are computed using a hybrid numerical method with a seven-point TCD scheme and a seven-point WENO upwind scheme, which leads to fifth-order precision. Time advancement is achieved with the fourth-order Runge–Kutta method.
2.2 Physical model
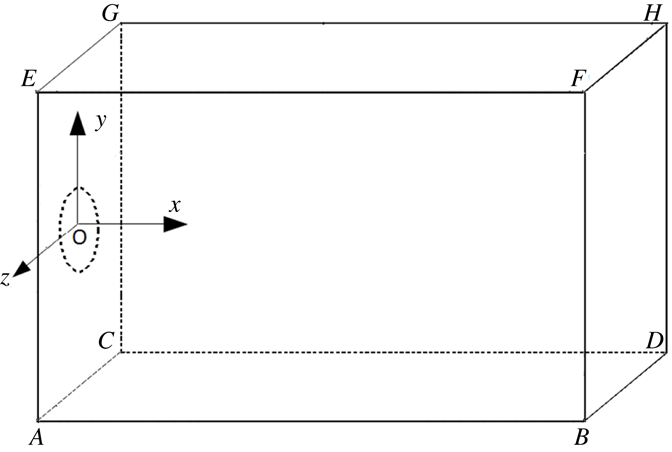
In this paper, a cuboid 3-D computational domain is set up, as shown in figure 1. The length (AB), height (AE) and width (AC) of the computational domain are
 $Lx=7.5D$
,
$Lx=7.5D$
,
 $Ly=5.6D$
and
$Ly=5.6D$
and
 $Lz=5.6D$
, respectively. The circular nozzle, with diameter
$Lz=5.6D$
, respectively. The circular nozzle, with diameter
 $D=0.01~\text{m}$
, is located at the centre of the plane ACGE.
$D=0.01~\text{m}$
, is located at the centre of the plane ACGE.
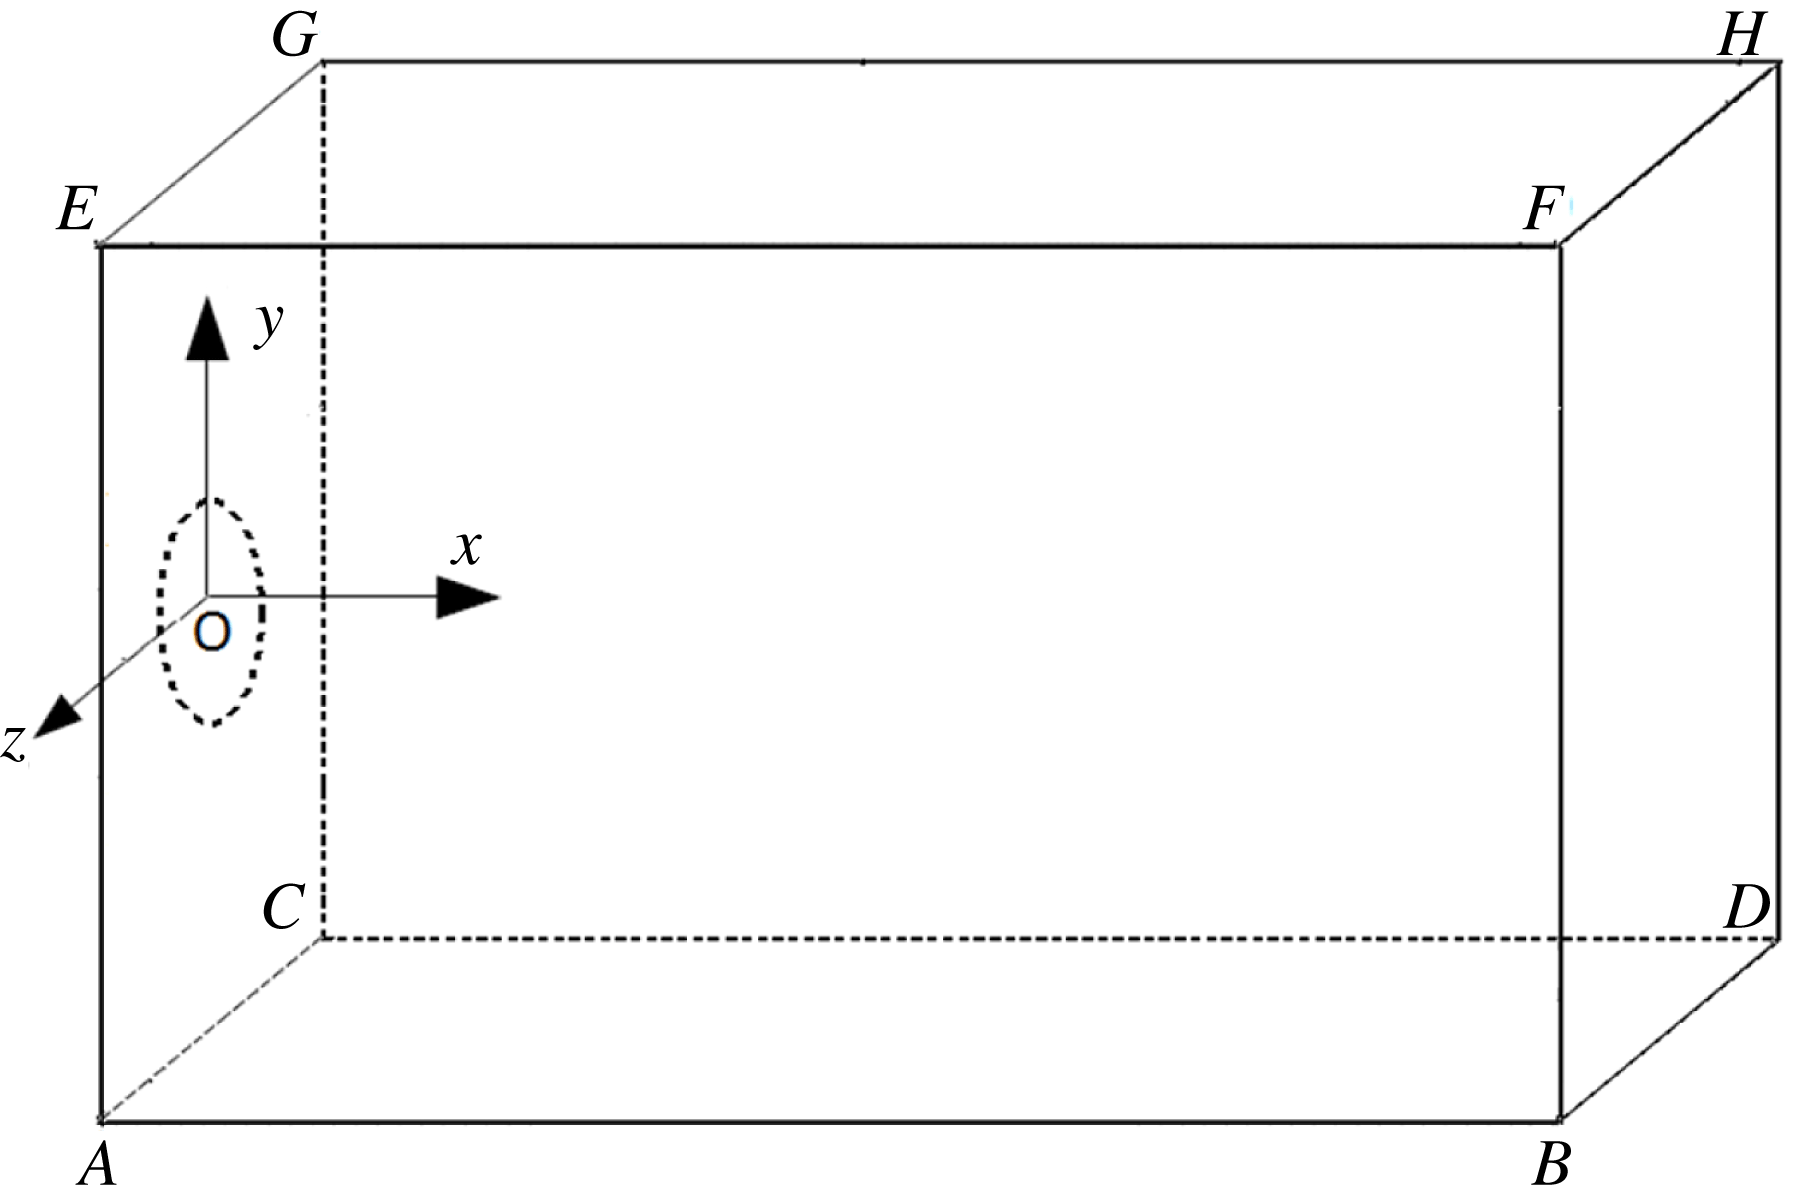
Figure 1. Schematic of the computational model.
Initially, the gas property within the whole computational domain is set to be uniform with the following parameters: heat ratio
 $\unicode[STIX]{x1D6FE}=1.4$
, dynamic viscosity coefficient
$\unicode[STIX]{x1D6FE}=1.4$
, dynamic viscosity coefficient
 $\unicode[STIX]{x1D707}=1.73\times 10^{-5}~\text{Pa}~\text{s}$
, velocity
$\unicode[STIX]{x1D707}=1.73\times 10^{-5}~\text{Pa}~\text{s}$
, velocity
 $u_{0}=0$
(rest), pressure
$u_{0}=0$
(rest), pressure
 $p_{0}=1.0~\text{atm}$
and temperature
$p_{0}=1.0~\text{atm}$
and temperature
 $T=300~\text{K}$
. The high-pressure gas is injected into the computational domain from the circular nozzle exit, with a jet Mach number
$T=300~\text{K}$
. The high-pressure gas is injected into the computational domain from the circular nozzle exit, with a jet Mach number
 $Ma=1.8$
, and two pressure ratios of jet flow, i.e.
$Ma=1.8$
, and two pressure ratios of jet flow, i.e.
 $n=p_{j}/p_{0}=1.4$
or 4.0, are taken as the computational examples. The corresponding Reynolds numbers
$n=p_{j}/p_{0}=1.4$
or 4.0, are taken as the computational examples. The corresponding Reynolds numbers
 $Re=\unicode[STIX]{x1D70C}_{j}UD/\unicode[STIX]{x1D707}$
(
$Re=\unicode[STIX]{x1D70C}_{j}UD/\unicode[STIX]{x1D707}$
(
 $\unicode[STIX]{x1D70C}_{j}$
and
$\unicode[STIX]{x1D70C}_{j}$
and
 $U$
are the jet density
$U$
are the jet density
 $\unicode[STIX]{x1D70C}_{j}=p_{j}/rT$
and velocity
$\unicode[STIX]{x1D70C}_{j}=p_{j}/rT$
and velocity
 $U=Ma\cdot c=Ma\cdot \sqrt{rRT}$
, respectively) are
$U=Ma\cdot c=Ma\cdot \sqrt{rRT}$
, respectively) are
 $3.6\times 10^{5}$
and
$3.6\times 10^{5}$
and
 $10.3\times 10^{5}$
, respectively.
$10.3\times 10^{5}$
, respectively.
To minimize the amplitude of reflective acoustic waves at the boundaries of the computational domain, a combination of non-reflective boundary conditions and sponge outflow is employed at the outflow boundaries (including planes ABFE, CDHG, BDHF, ABDC and EFHG). Moreover, the sponge zone uses spatial low-pass filtering along the
 $x$
-direction to absorb the waves. These boundary conditions and the numerical scheme are discussed in detail by Colonius, Lele & Moin (Reference Colonius, Lele and Moin1994). On the other hand, the viscous wall boundary condition is applied at the inlet wall ACGE.
$x$
-direction to absorb the waves. These boundary conditions and the numerical scheme are discussed in detail by Colonius, Lele & Moin (Reference Colonius, Lele and Moin1994). On the other hand, the viscous wall boundary condition is applied at the inlet wall ACGE.
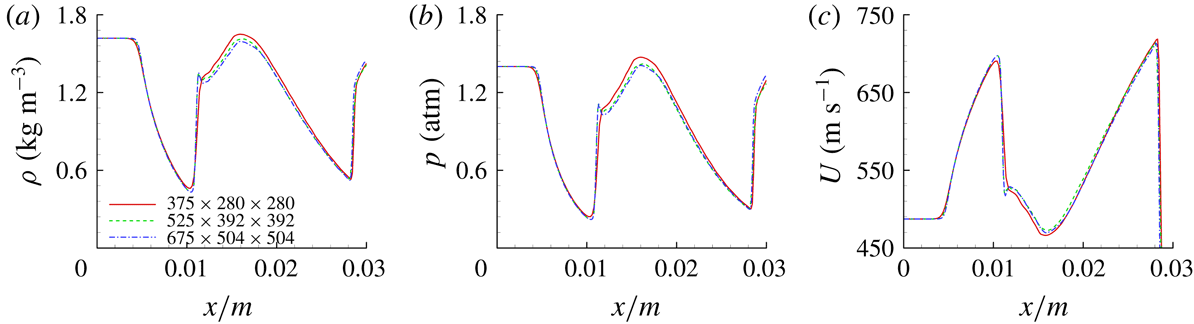
A uniform Cartesian grid without cell stretching is used for meshing the computational domain, which typically provides enhanced numerical accuracy and avoids the singularity linked to polar grids. On the other hand, a mesh independency study is performed using several meshes with different resolutions. Figure 2 presents the numerical schlieren images of a moderately under-expanded jet with different meshes; the density, pressure and velocity profiles along the jet’s centreline are shown in figure 3. It can be seen in figure 2 that the result obtained using grid numbers of
 $525\times 392\times 392$
is almost the same as that using grid numbers of
$525\times 392\times 392$
is almost the same as that using grid numbers of
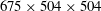 $675\times 504\times 504$
. The maximum relative error of all variables between the studied meshes,
$675\times 504\times 504$
. The maximum relative error of all variables between the studied meshes,
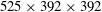 $525\times 392\times 392$
and
$525\times 392\times 392$
and
 $675\times 504\times 504$
, is less than 1 %, and thus we consider the results to be converged. Therefore, in the following, the uniform Cartesian grid number,
$675\times 504\times 504$
, is less than 1 %, and thus we consider the results to be converged. Therefore, in the following, the uniform Cartesian grid number,
 $525\times 392\times 392$
, is applied.
$525\times 392\times 392$
, is applied.
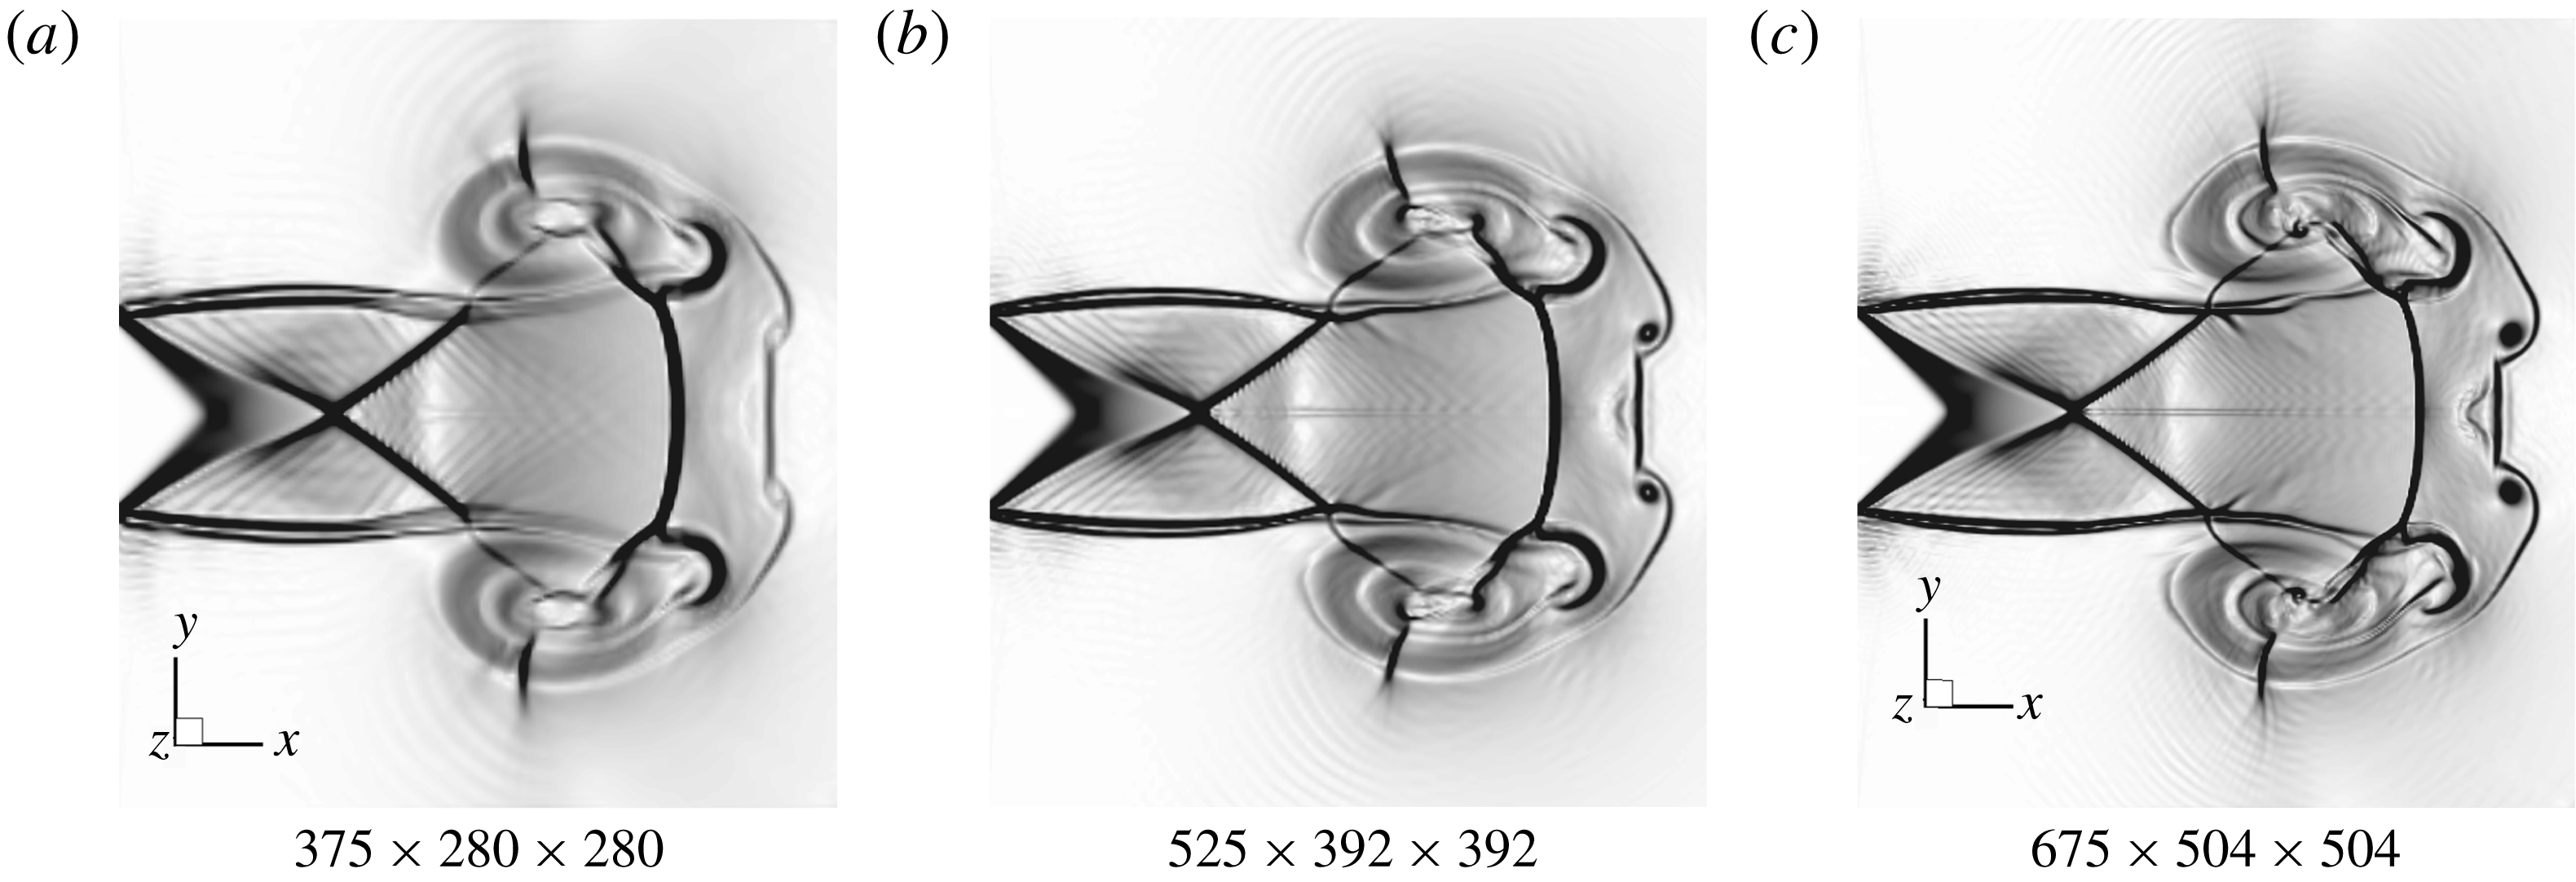
Figure 2. The numerical schlieren images of a supersonic jet with different mesh resolutions.

Figure 3. The density, pressure and velocity profiles along the symmetric centreline at the same time with different mesh resolutions.
3 Numerical results and discussions
3.1 Main flow characteristics
A comparison of the instantaneous numerical schlieren images (
 $n=4.0$
) and the experimental shadowgraphs (
$n=4.0$
) and the experimental shadowgraphs (
 $n=20.0$
) is shown in figure 4. The experimental muzzle flow fields are obtained from our laboratory’s previous publication (Li et al.
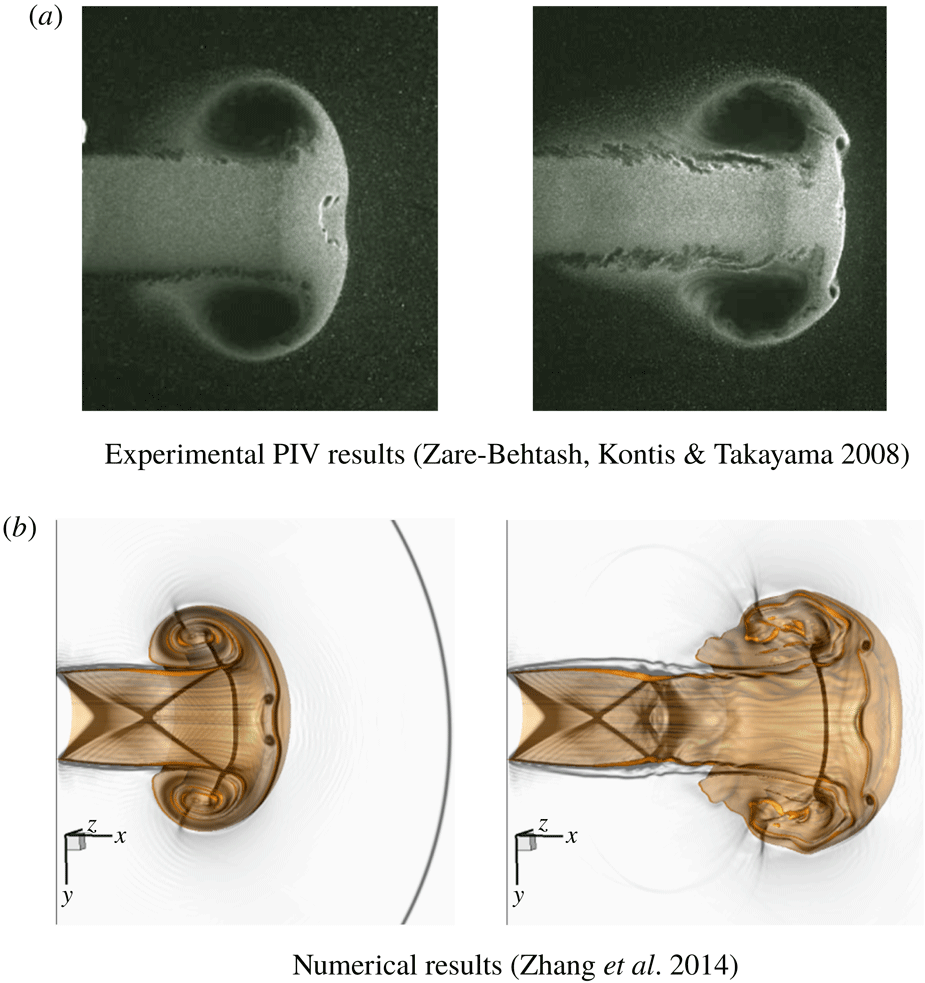
Reference Li, Jiang, Wang and Guo2015). Good agreement between the numerical and experimental results is achieved, and both of them capture the main flow characteristics, such as the Mach disc, vortex-induced shock pair, primary and secondary vortex rings as well as the shock patterns. However, due to different Mach numbers, pressure ratios and environmental perturbations, some particular differences exist. More comparisons between our additional simulation and the corresponding experimental results can be found in Zhang et al. (Reference Zhang, Chen, Li and Jiang2014, Reference Zhang, Chen, Guo and Sun2017) or in the Appendix.
$n=20.0$
) is shown in figure 4. The experimental muzzle flow fields are obtained from our laboratory’s previous publication (Li et al.
Reference Li, Jiang, Wang and Guo2015). Good agreement between the numerical and experimental results is achieved, and both of them capture the main flow characteristics, such as the Mach disc, vortex-induced shock pair, primary and secondary vortex rings as well as the shock patterns. However, due to different Mach numbers, pressure ratios and environmental perturbations, some particular differences exist. More comparisons between our additional simulation and the corresponding experimental results can be found in Zhang et al. (Reference Zhang, Chen, Li and Jiang2014, Reference Zhang, Chen, Guo and Sun2017) or in the Appendix.

Figure 4. Comparison of the instantaneous flow fields of our numerical results with experimental observations (Li et al. Reference Li, Jiang, Wang and Guo2015).
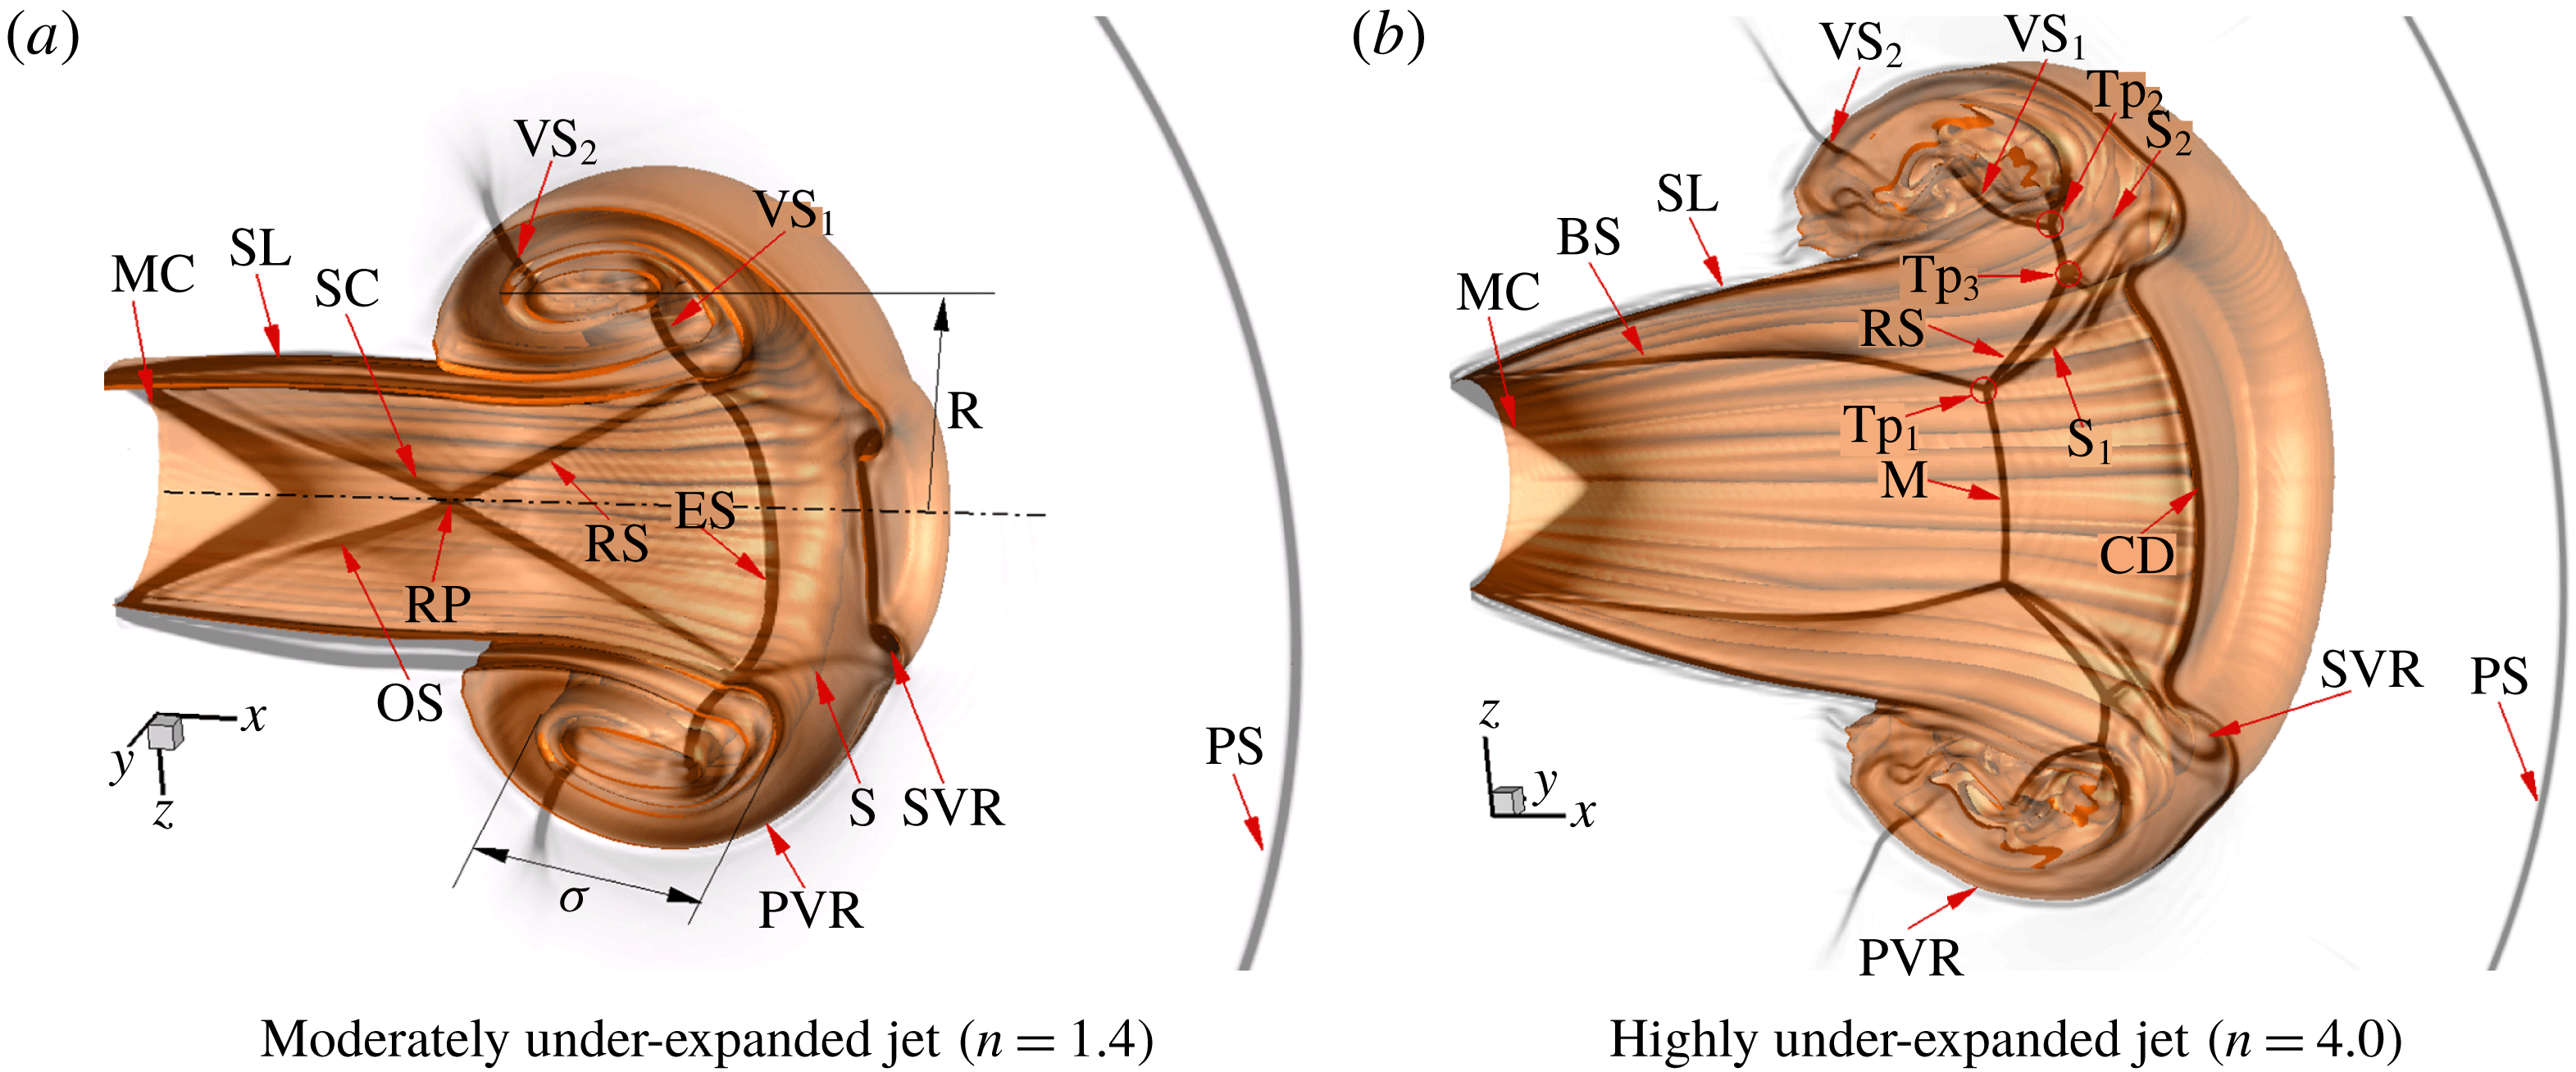
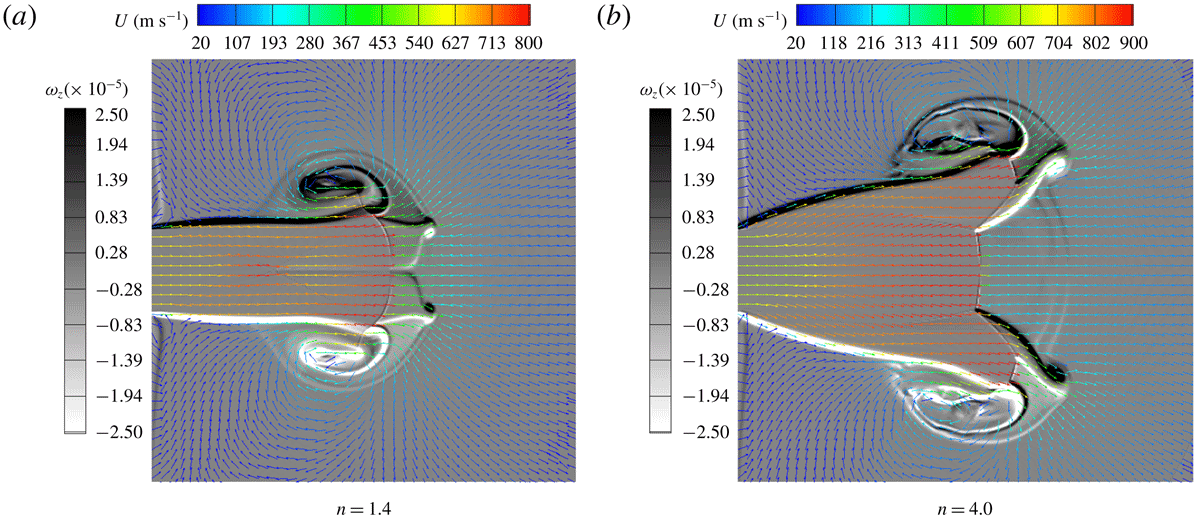
Figure 5. The initial flow structures of the supersonic jets for two flow regimes at
 $t=0.11~\text{ms}$
. (BS, barrel shock; CD, cap flow discontinuity; ES, embedded shock; M, Mach disc; MC, Mach cone; OS, oblique shock wave; PS, precursor shock wave; PVR, primary vortex ring; S,
$t=0.11~\text{ms}$
. (BS, barrel shock; CD, cap flow discontinuity; ES, embedded shock; M, Mach disc; MC, Mach cone; OS, oblique shock wave; PS, precursor shock wave; PVR, primary vortex ring; S,
 $\text{S}_{1}$
,
$\text{S}_{1}$
,
 $\text{S}_{2}$
, slipstream; SC, shock cell; SL, shear layer; SVR, secondary vortex ring; RP, reflection point; RS, reflected shock;
$\text{S}_{2}$
, slipstream; SC, shock cell; SL, shear layer; SVR, secondary vortex ring; RP, reflection point; RS, reflected shock;
 $\text{Tp}_{1}$
,
$\text{Tp}_{1}$
,
 $\text{Tp}_{2}$
,
$\text{Tp}_{2}$
,
 $\text{Tp}_{3}$
, triple point;
$\text{Tp}_{3}$
, triple point;
 $\text{VS}_{1}$
,
$\text{VS}_{1}$
,
 $\text{VS}_{2}$
, vortex-induced shock pair.)
$\text{VS}_{2}$
, vortex-induced shock pair.)
Figure 5 presents the starting flow structures of under-expanded circular jets at
 $n=1.4$
(figure 5
a, moderately under-expanded jet) and 4.0 (figure 5
b, highly under-expanded jet). The depictions are obtained from the superimposition of the computational schlieren results of the symmetric plane with the 3-D isosurface of the mixture fraction (
$n=1.4$
(figure 5
a, moderately under-expanded jet) and 4.0 (figure 5
b, highly under-expanded jet). The depictions are obtained from the superimposition of the computational schlieren results of the symmetric plane with the 3-D isosurface of the mixture fraction (
 $f=0.85$
). It is obvious that the main initial flow structures of both jets include the precursor shock wave, PVR, jet flow (including shear layer), Mach cone, SVR, vortex-induced shock pair, etc. However, due to the different pressure ratios, the shock patterns within the jets are obviously different; therefore, the generation mechanisms of their SVRs are dissimilar.
$f=0.85$
). It is obvious that the main initial flow structures of both jets include the precursor shock wave, PVR, jet flow (including shear layer), Mach cone, SVR, vortex-induced shock pair, etc. However, due to the different pressure ratios, the shock patterns within the jets are obviously different; therefore, the generation mechanisms of their SVRs are dissimilar.
For the moderately under-expanded jet (
 $n=1.4$
, figure 5
a), its pressure ratio is not high enough, and a jet flow with a typical oblique shock pattern (shock cell) is generated behind the PVR. With the growth of the pressure ratio
$n=1.4$
, figure 5
a), its pressure ratio is not high enough, and a jet flow with a typical oblique shock pattern (shock cell) is generated behind the PVR. With the growth of the pressure ratio
 $(n)$
, the jet boundary expands to compensate for the higher pressure gradient with respect to the surrounding gas. When the value of
$(n)$
, the jet boundary expands to compensate for the higher pressure gradient with respect to the surrounding gas. When the value of
 $n$
is above the threshold (
$n$
is above the threshold (
 $n\geqslant 2$
) (Matsuda et al.
Reference Matsuda, Vuorinen, Yu, Tirunagari, Kaario, Larmi, Duwig and Boersma2013), the regular reflection within the trailing jet transits to the Mach reflection. At this moment, the barrel shock appears, it terminates at a triple point
$n\geqslant 2$
) (Matsuda et al.
Reference Matsuda, Vuorinen, Yu, Tirunagari, Kaario, Larmi, Duwig and Boersma2013), the regular reflection within the trailing jet transits to the Mach reflection. At this moment, the barrel shock appears, it terminates at a triple point
 $(\text{Tp}_{1})$
and is followed by the development of a nearly vertical or normal shock known as the Mach disc.
$(\text{Tp}_{1})$
and is followed by the development of a nearly vertical or normal shock known as the Mach disc.
As shown in figure 5(b), the barrel shock acts similar to an incident shock wave and its reflection shock wave connects with the first vortex-induced shock pair (
 $\text{VS}_{1}$
). It is also interesting to observe that the slip line (
$\text{VS}_{1}$
). It is also interesting to observe that the slip line (
 $\text{S}_{1}$
) starts from the triple points at the Mach disc. The present visualization agrees well with previous experimental schlieren images (Ishii et al.
Reference Ishii, Fujimoto, Hatta and Umeda1999; Mariani et al.
Reference Mariani, Quinn and Kontis2013), particularly the shock structures shown in Mariani et al. (Reference Mariani, Quinn and Kontis2013).
$\text{S}_{1}$
) starts from the triple points at the Mach disc. The present visualization agrees well with previous experimental schlieren images (Ishii et al.
Reference Ishii, Fujimoto, Hatta and Umeda1999; Mariani et al.
Reference Mariani, Quinn and Kontis2013), particularly the shock structures shown in Mariani et al. (Reference Mariani, Quinn and Kontis2013).

Figure 6. Normalized transverse (a,c) and axial (b,d) velocity profiles for moderately under-expanded (
 $n=1.4$
) and highly under-expanded (
$n=1.4$
) and highly under-expanded (
 $n=4.0$
) jets at
$n=4.0$
) jets at
 $t=0.11~\text{ms}$
.
$t=0.11~\text{ms}$
.
Figure 6 illustrates the corresponding normalized transverse and axial velocity profiles along the
 $y$
axis at different cross-sections (
$y$
axis at different cross-sections (
 $x/D=1.0$
, 2.0, 3.6 and 4.0). The vorticity and velocity vector fields of the symmetric plane for both jets are shown in figure 7, in which the vector length is proportional to the velocity magnitude.
$x/D=1.0$
, 2.0, 3.6 and 4.0). The vorticity and velocity vector fields of the symmetric plane for both jets are shown in figure 7, in which the vector length is proportional to the velocity magnitude.
Following the precursor shock wave, high-pressure gas at the exit characterizes the rapid flow expansion (or Prandtl–Meyer expansion) around the nozzle lip and generates the cone-shaped flow area at the nozzle exit, often referred as the Mach cone. The flow velocities within the Mach cone are the same as the exit velocities, as shown in figure 7. Due to the expansion effects, the high-pressure supersonic gas is accelerated to be at an even higher Mach number along its symmetric axis. Here, the highest Mach number is close to 3.03 for
 $n=1.4$
at the first shock reflection point and is 4.90 for
$n=1.4$
at the first shock reflection point and is 4.90 for
 $n=4.0$
in the vicinity of the Mach disc (figure 8).
$n=4.0$
in the vicinity of the Mach disc (figure 8).
Based on our simulation results, for
 $n=1.4$
, the locations of shock reflection points are at
$n=1.4$
, the locations of shock reflection points are at
 $x/D=1.4$
(first) and 3.6 (second). While for
$x/D=1.4$
(first) and 3.6 (second). While for
 $n=4.0$
, the Mach disc location is at
$n=4.0$
, the Mach disc location is at
 $x/D=3.0$
. The transverse velocity of figure 6 shows that the flow upstream (
$x/D=3.0$
. The transverse velocity of figure 6 shows that the flow upstream (
 $x/D=1.0$
) of the first reflection point (
$x/D=1.0$
) of the first reflection point (
 $n=1.4$
,
$n=1.4$
,
 $x/D=1.4$
) or Mach disc (
$x/D=1.4$
) or Mach disc (
 $n=4.0$
,
$n=4.0$
,
 $x/D=3.0$
) has a transverse velocity component towards the jet boundary, and the normalized values for
$x/D=3.0$
) has a transverse velocity component towards the jet boundary, and the normalized values for
 $n=4.0$
are higher than those for
$n=4.0$
are higher than those for
 $n=1.4$
. Due to the rapid flow expansion, the value of the transverse velocity increases first with distance away from the jet centreline. However, after a radial distance of
$n=1.4$
. Due to the rapid flow expansion, the value of the transverse velocity increases first with distance away from the jet centreline. However, after a radial distance of
 $y\sim 0.2D$
for
$y\sim 0.2D$
for
 $n=1.4$
and
$n=1.4$
and
 $y\sim 0.5D$
for
$y\sim 0.5D$
for
 $n=4.0$
, the flow expansion decreases, and after
$n=4.0$
, the flow expansion decreases, and after
 $y\sim 0.7D$
for
$y\sim 0.7D$
for
 $n=1.4$
and
$n=1.4$
and
 $y\sim 0.9D$
for
$y\sim 0.9D$
for
 $n=4.0$
, the velocity turns inwards by passing through an oblique shock wave (
$n=4.0$
, the velocity turns inwards by passing through an oblique shock wave (
 $n=1.4$
) or the barrel shock wave (
$n=1.4$
) or the barrel shock wave (
 $n=4.0$
). This results in a small transverse velocity component towards the jet centreline, as shown in figure 7. Additionally, the transverse velocity grasp of figure 6 also shows that the flow has a negative transverse velocity after the reflection point (
$n=4.0$
). This results in a small transverse velocity component towards the jet centreline, as shown in figure 7. Additionally, the transverse velocity grasp of figure 6 also shows that the flow has a negative transverse velocity after the reflection point (
 $n=1.4$
,
$n=1.4$
,
 $x/D=2.0$
and 4.0) or Mach disc (
$x/D=2.0$
and 4.0) or Mach disc (
 $n=4.0$
,
$n=4.0$
,
 $x/D=3.6$
and 4.0).
$x/D=3.6$
and 4.0).

Figure 7. Vorticity
 $(\unicode[STIX]{x1D714}_{z})$
and velocity vector distribution of the symmetric plane for both jets at
$(\unicode[STIX]{x1D714}_{z})$
and velocity vector distribution of the symmetric plane for both jets at
 $t=0.11~\text{ms}$
.
$t=0.11~\text{ms}$
.
Each axial velocity profile of the moderately under-expanded jet has a section with almost vertical lines for
 $u/U>1.0$
, which means that the flow along the centreline is accelerated. In addition, the axial velocity component at
$u/U>1.0$
, which means that the flow along the centreline is accelerated. In addition, the axial velocity component at
 $x/D=1.0$
and 3.6 is larger than that at
$x/D=1.0$
and 3.6 is larger than that at
 $x/D=2.0$
and 4.0; this outcome also indicates that the flow accelerates upstream and decelerates downstream of the reflected point. On the other hand, the thickness of the jet shear layer can be measured by the distance between the highest
$x/D=2.0$
and 4.0; this outcome also indicates that the flow accelerates upstream and decelerates downstream of the reflected point. On the other hand, the thickness of the jet shear layer can be measured by the distance between the highest
 $y/D$
of the aforementioned vertical section of the axial velocity and the position where
$y/D$
of the aforementioned vertical section of the axial velocity and the position where
 $u/U$
becomes almost zero (Hamzehloo & Aleiferis Reference Hamzehloo and Aleiferis2016). It is clear from figure 6(a,c) that the thickness of the jet shear layer for the moderately under-expanded jet is almost constant. For the highly under-expanded jet, the axial velocity accelerates upstream of the Mach disc and decelerates to subsonic downstream of the Mach disc. Moreover, the thickness of the jet shear layer increases from
$u/U$
becomes almost zero (Hamzehloo & Aleiferis Reference Hamzehloo and Aleiferis2016). It is clear from figure 6(a,c) that the thickness of the jet shear layer for the moderately under-expanded jet is almost constant. For the highly under-expanded jet, the axial velocity accelerates upstream of the Mach disc and decelerates to subsonic downstream of the Mach disc. Moreover, the thickness of the jet shear layer increases from
 $x/D=1.0$
to 2.0 (figure 6
b,d).
$x/D=1.0$
to 2.0 (figure 6
b,d).

Figure 8. Variations of the main flow parameters of different under-expanded circular jets along the nozzle centreline.
The pressure, temperature, density and Mach number distributions along the nozzle centreline for different pressure ratios,
 $n=1.0$
, 1.4, 2.7 and 4.0, are presented in figure 8. It is clear that the higher the pressure ratio, the greater the density of jet flow issuing from the nozzle exit (figure 8
a), but the Mach number remains constant at the nozzle exit (figure 8
b,
$n=1.0$
, 1.4, 2.7 and 4.0, are presented in figure 8. It is clear that the higher the pressure ratio, the greater the density of jet flow issuing from the nozzle exit (figure 8
a), but the Mach number remains constant at the nozzle exit (figure 8
b,
 $Ma=1.8$
). Attributed to the rapid expansion, the higher-pressure supersonic gas is accelerated to an even greater Mach number along the nozzle centreline and reaches the maximum value just upstream of the Mach disc. Correspondingly, its pressure, temperature and density decrease and reach the minimum values (figure 8
a,c,d). It can be quantitatively seen that the maximum values of the Mach numbers are equal to 3.03, 4.46 and 4.92 and the minimum temperature values are equal to 173.1, 101.0 and 84.5 K for
$Ma=1.8$
). Attributed to the rapid expansion, the higher-pressure supersonic gas is accelerated to an even greater Mach number along the nozzle centreline and reaches the maximum value just upstream of the Mach disc. Correspondingly, its pressure, temperature and density decrease and reach the minimum values (figure 8
a,c,d). It can be quantitatively seen that the maximum values of the Mach numbers are equal to 3.03, 4.46 and 4.92 and the minimum temperature values are equal to 173.1, 101.0 and 84.5 K for
 $n=1.4$
, 2.7 and 4.0, respectively. According to the quantitative results, the main factor influencing the distribution of the Mach number is the pressure ratio.
$n=1.4$
, 2.7 and 4.0, respectively. According to the quantitative results, the main factor influencing the distribution of the Mach number is the pressure ratio.
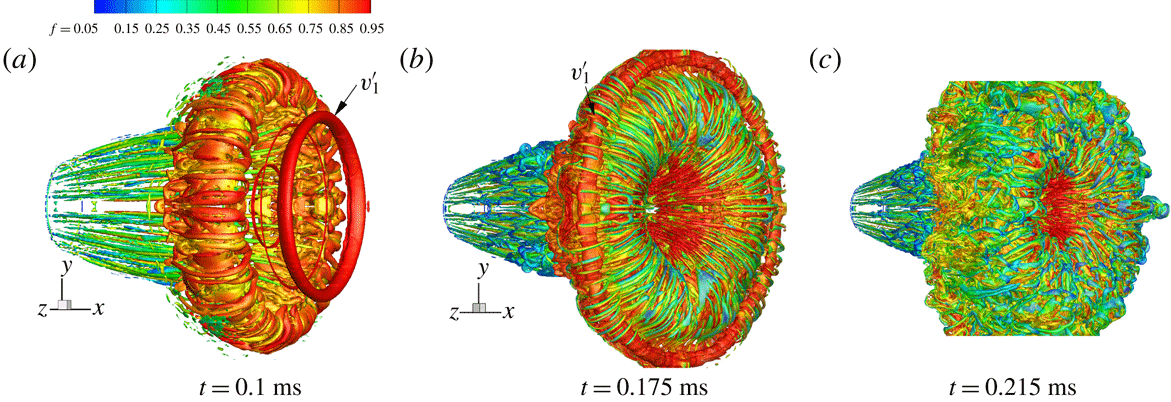
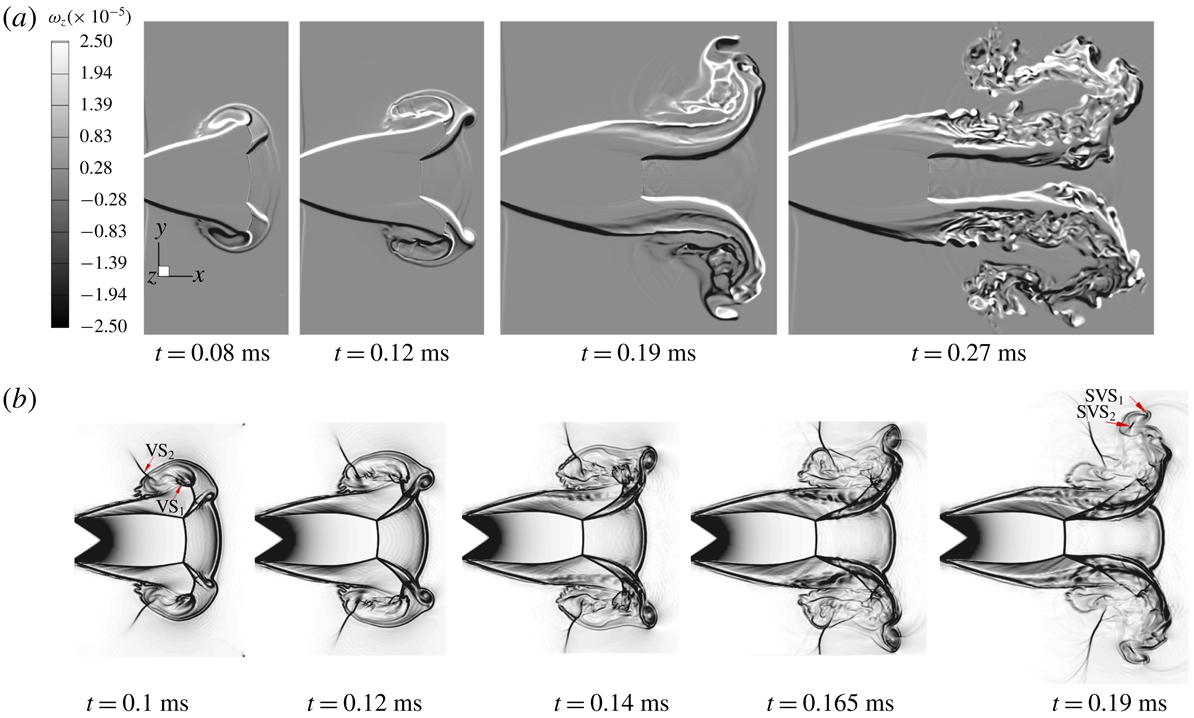
3.2 Evolution of the PVR
To describe the 3-D evolution of the PVR for different flow regimes, the sequential isosurfaces of the mixture fraction (
 $f=0.83$
) for the moderately (
$f=0.83$
) for the moderately (
 $n=1.4$
) and highly (
$n=1.4$
) and highly (
 $n=4.0$
) under-expanded jets are presented in figures 9 and 10, respectively. The images in figures 9 and 10 have the same scales. Due to the constant azimuthal curvature of the circular nozzle, the flow expands uniformly in all directions, and the primary vortex core appears to have a ring-like pattern. At this stage, the shear layer of the vortex ring belongs to laminar flow, as shown in figures 9(a) and 10(a). This large vortex ring moves downstream and expands immediately by entraining the ambient gas into its core, which causes a rapid increase of the diameter. Meanwhile, the interactions of the vortex-induced shock pair (
$n=4.0$
) under-expanded jets are presented in figures 9 and 10, respectively. The images in figures 9 and 10 have the same scales. Due to the constant azimuthal curvature of the circular nozzle, the flow expands uniformly in all directions, and the primary vortex core appears to have a ring-like pattern. At this stage, the shear layer of the vortex ring belongs to laminar flow, as shown in figures 9(a) and 10(a). This large vortex ring moves downstream and expands immediately by entraining the ambient gas into its core, which causes a rapid increase of the diameter. Meanwhile, the interactions of the vortex-induced shock pair (
 $\text{VS}_{1}$
and
$\text{VS}_{1}$
and
 $\text{VS}_{2}$
) with the shear layer of the PVR (figure 5) accelerate the instability of the vortex ring (Zhang et al.
Reference Zhang, Chen, Jiang and Huang2015); thus, waviness occurs on the isomixture fraction surface of the vortex core, as shown in figures 9(c) and 10(b). Then, the vortex core rapidly loses its stability, but the outer interface remains stable (figures 9
d and 10
c). Another interesting phenomenon in figures 9(c) and 10(c) is that the appearance of the coaxial SVR with an opposite circulation presents ahead of the PVR. It interacts with the front interface of the PVR and leads to the deceleration and rolling up of the PVR.
$\text{VS}_{2}$
) with the shear layer of the PVR (figure 5) accelerate the instability of the vortex ring (Zhang et al.
Reference Zhang, Chen, Jiang and Huang2015); thus, waviness occurs on the isomixture fraction surface of the vortex core, as shown in figures 9(c) and 10(b). Then, the vortex core rapidly loses its stability, but the outer interface remains stable (figures 9
d and 10
c). Another interesting phenomenon in figures 9(c) and 10(c) is that the appearance of the coaxial SVR with an opposite circulation presents ahead of the PVR. It interacts with the front interface of the PVR and leads to the deceleration and rolling up of the PVR.
To visualize the small-scale structures, the isosurface of the second invariant Q of the velocity gradient tensor (Hunt, Wray & Moin Reference Hunt, Wray and Moin1988) is shown in figures 11 and 12; the colour refers to the magnitude of the mixture fraction
 $(f)$
. For the moderately under-expanded jet, the first SVR (figure 11
a,
$(f)$
. For the moderately under-expanded jet, the first SVR (figure 11
a,
 $V_{1}$
) remains stable and the identity is distinct after its generation. When
$V_{1}$
) remains stable and the identity is distinct after its generation. When
 $V_{1}$
moves near the shear layer of the PVR, its motion is dominated by the PVR because of the large circulation of the PVR. Then,
$V_{1}$
moves near the shear layer of the PVR, its motion is dominated by the PVR because of the large circulation of the PVR. Then,
 $V_{1}$
begins to lose its stability (figure 9
e and 11
b) and finally transforms into the irregular waviness at the wake (figure 11
c,
$V_{1}$
begins to lose its stability (figure 9
e and 11
b) and finally transforms into the irregular waviness at the wake (figure 11
c,
 $V_{1}$
). During the whole process, the size of the first SVR is almost constant. Later, the subsequent SVRs (figure 11
b,c,
$V_{1}$
). During the whole process, the size of the first SVR is almost constant. Later, the subsequent SVRs (figure 11
b,c,
 $V_{2}$
–
$V_{2}$
–
 $V_{4}$
), which are generated from another slip line (Zhang et al.
Reference Zhang, Chen, Li and Jiang2014), become more unstable since they locate closer to the primary vortex core and the vorticities are smaller. During the process of rolling over the periphery of the PVR, the SVRs break up and generate many fine-scale rib structures in the periphery of the PVR (figure 11
c). These types of structures can be thought of as traces of the rib vortex in the fully developed state. As a result, the SVRs are difficult to identify from the interface of the PVR, as shown in figure 9(f).
$V_{4}$
), which are generated from another slip line (Zhang et al.
Reference Zhang, Chen, Li and Jiang2014), become more unstable since they locate closer to the primary vortex core and the vorticities are smaller. During the process of rolling over the periphery of the PVR, the SVRs break up and generate many fine-scale rib structures in the periphery of the PVR (figure 11
c). These types of structures can be thought of as traces of the rib vortex in the fully developed state. As a result, the SVRs are difficult to identify from the interface of the PVR, as shown in figure 9(f).
Figure 9. Sequential 3-D isosurface of the mixture fraction (
 $f=0.83$
) for
$f=0.83$
) for
 $n=1.4$
.
$n=1.4$
.
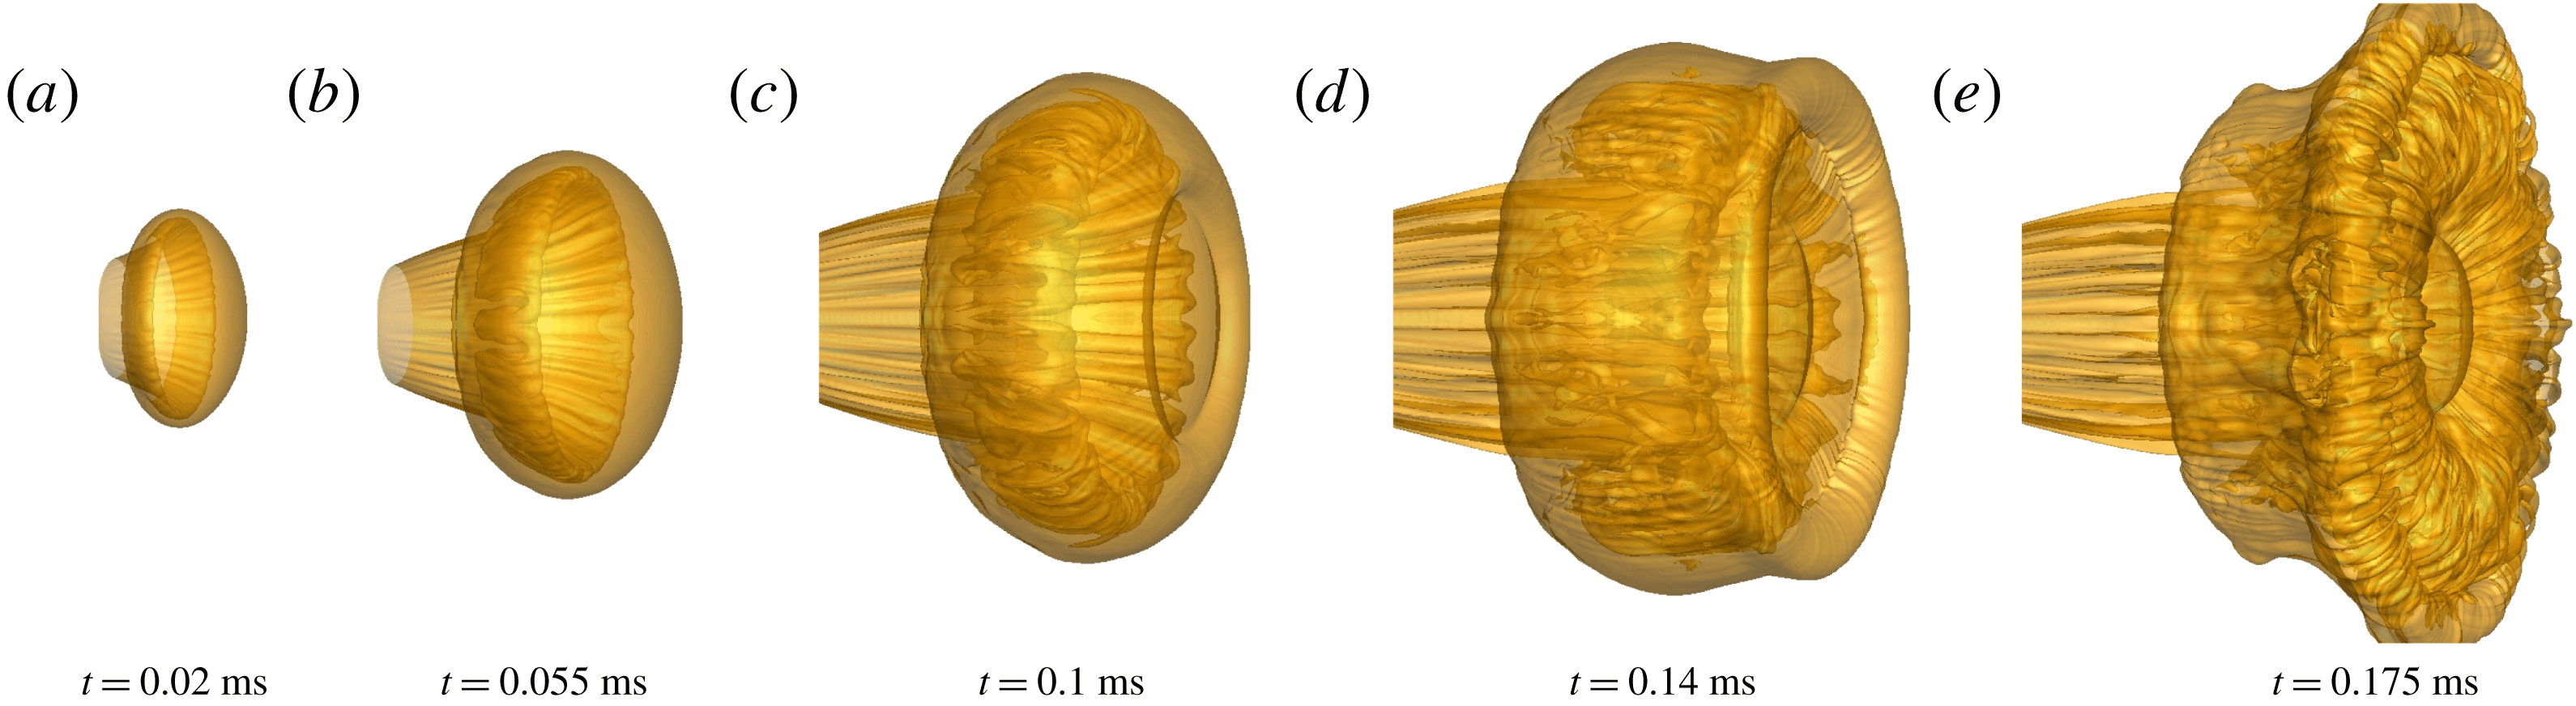
Figure 10. Sequential 3-D isosurface of the mixture fraction (
 $f=0.83$
) for
$f=0.83$
) for
 $n=4.0$
.
$n=4.0$
.
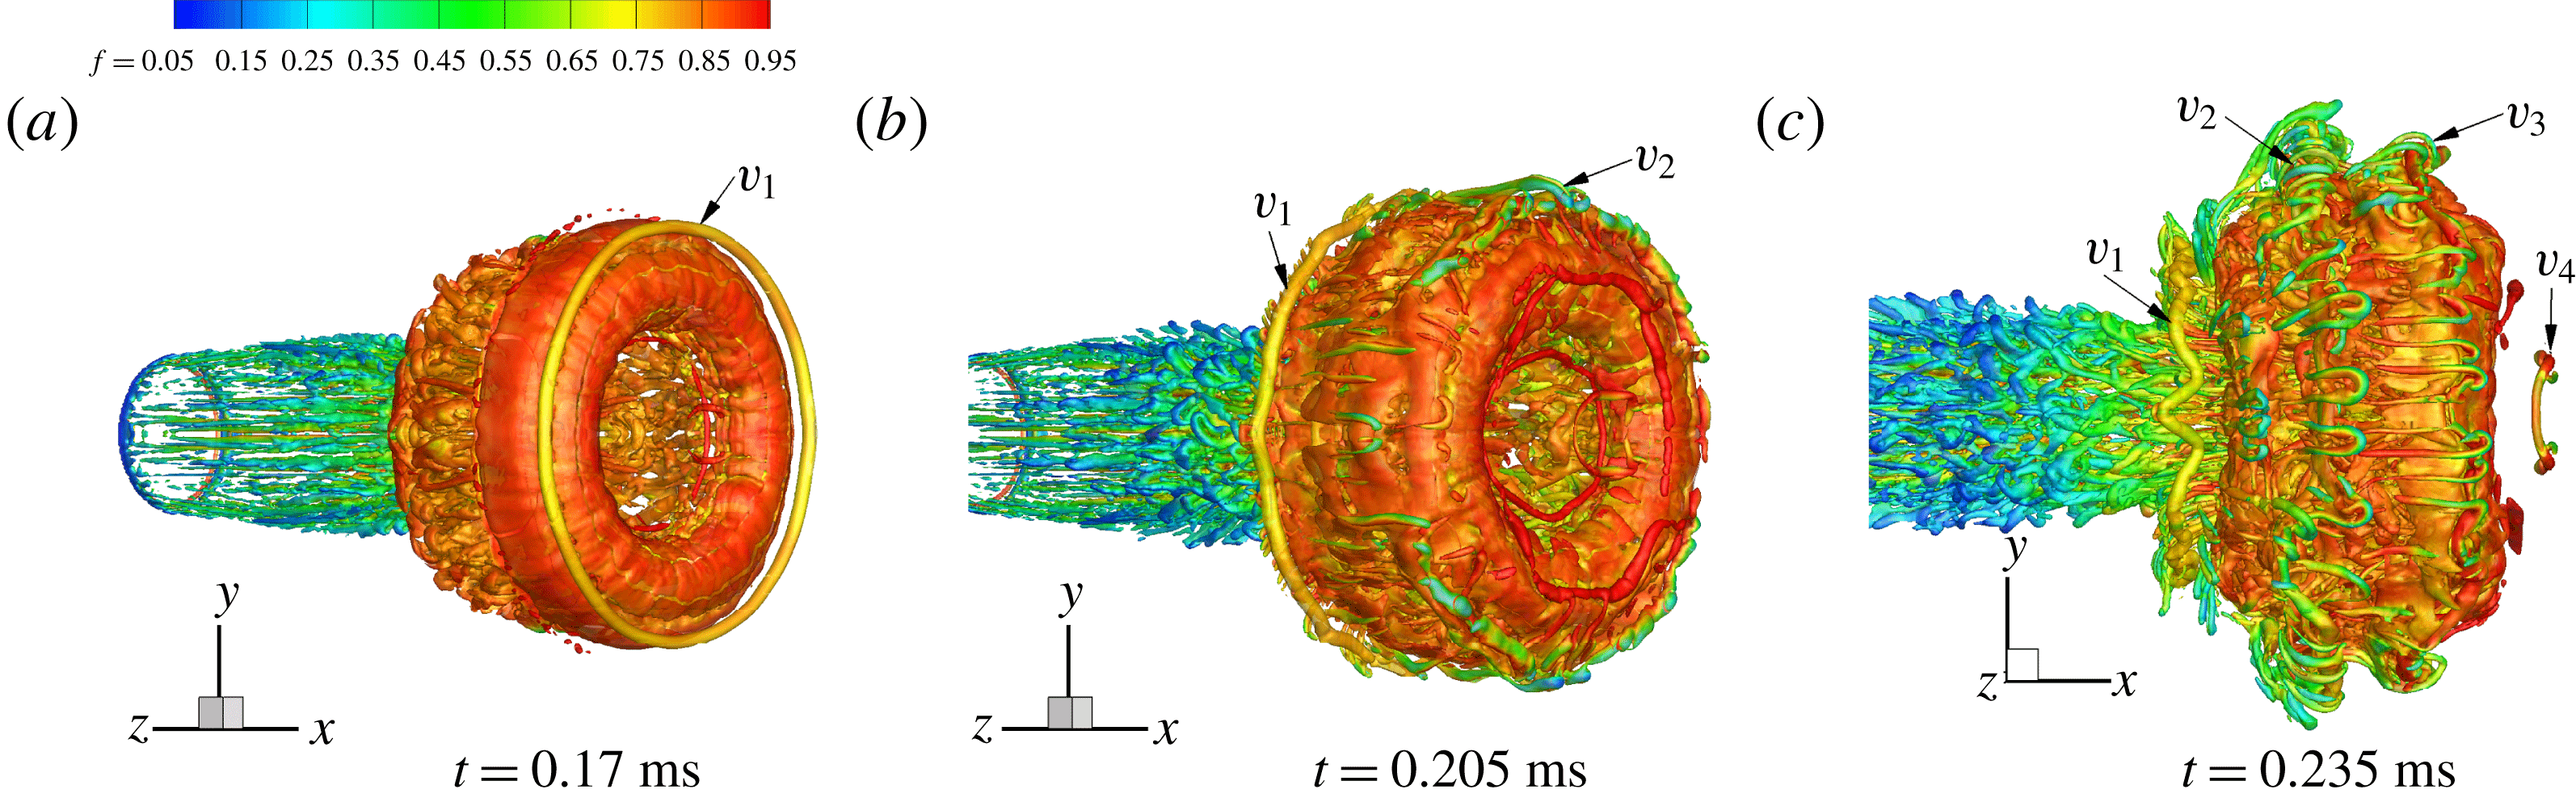
Figure 11. The 3-D isosurface of the second invariant of the velocity gradient tensor for the moderately under-expanded jet.
Since the expansion effect is augmented with an increase of the pressure ratio
 $(n)$
, the higher-pressure gas is accelerated to an even larger Mach number along its symmetric axis. Thus, the shape of the primary vortex core for the highly under-expanded jet is more prolate (figure 10
a), and the waviness on the isomixture fraction surface of the vortex core appears earlier due to the stronger interaction of the vortex-induced shock wave with the vortex shear layer. Therefore, the ‘halo vorticity’ occupies the surrounding outer core region (figure 12
a), which is consistent with the simulations of Archer, Thomas & Coleman (Reference Archer, Thomas and Coleman2008). It is also interesting to observe in figures 10 and 12 that the size and circulation of the secondary vortex core
$(n)$
, the higher-pressure gas is accelerated to an even larger Mach number along its symmetric axis. Thus, the shape of the primary vortex core for the highly under-expanded jet is more prolate (figure 10
a), and the waviness on the isomixture fraction surface of the vortex core appears earlier due to the stronger interaction of the vortex-induced shock wave with the vortex shear layer. Therefore, the ‘halo vorticity’ occupies the surrounding outer core region (figure 12
a), which is consistent with the simulations of Archer, Thomas & Coleman (Reference Archer, Thomas and Coleman2008). It is also interesting to observe in figures 10 and 12 that the size and circulation of the secondary vortex core
 $(V_{1}^{\prime })$
gradually increase during its movement along the periphery of the PVR, which is markedly different from the ones in the moderately under-expanded jet.
$(V_{1}^{\prime })$
gradually increase during its movement along the periphery of the PVR, which is markedly different from the ones in the moderately under-expanded jet.

Figure 12. The 3-D isosurface of the second invariant of the velocity gradient tensor for the highly under-expanded jet.

Figure 13. Isosurface of total vorticity
 $(\unicode[STIX]{x1D6FA}=5.0\times 10^{5})$
showing the generation and evolution of the first SVR (
$(\unicode[STIX]{x1D6FA}=5.0\times 10^{5})$
showing the generation and evolution of the first SVR (
 $V_{1}$
) for
$V_{1}$
) for
 $n=4.0$
.
$n=4.0$
.
The generation mechanism of the SVR for
 $n=1.4$
has been described in Zhang et al. (Reference Zhang, Chen, Li and Jiang2014); this mechanism is caused by the merging and shedding of two slip lines from the embedded shock. To illustrate the generation mechanism and evolution of the SVR for
$n=1.4$
has been described in Zhang et al. (Reference Zhang, Chen, Li and Jiang2014); this mechanism is caused by the merging and shedding of two slip lines from the embedded shock. To illustrate the generation mechanism and evolution of the SVR for
 $n=4.0$
, the 3-D structural characteristics of the PVR during SVR formation are presented in figure 13, and the sequential vorticity
$n=4.0$
, the 3-D structural characteristics of the PVR during SVR formation are presented in figure 13, and the sequential vorticity
 $\unicode[STIX]{x1D714}_{z}$
and schlieren images of the symmetric plane during the evolution are shown in figure 14. The yellow layer in figure 13 shows the isosurface of the total vorticity,
$\unicode[STIX]{x1D714}_{z}$
and schlieren images of the symmetric plane during the evolution are shown in figure 14. The yellow layer in figure 13 shows the isosurface of the total vorticity,
 $\unicode[STIX]{x1D6FA}=(\unicode[STIX]{x1D714}_{x}^{2}+\unicode[STIX]{x1D714}_{y}^{2}+\unicode[STIX]{x1D714}_{z}^{2})^{1/2}$
, and the grey layer is the shock interface. In figure 13(a), it is clear that an annular slip surface
$\unicode[STIX]{x1D6FA}=(\unicode[STIX]{x1D714}_{x}^{2}+\unicode[STIX]{x1D714}_{y}^{2}+\unicode[STIX]{x1D714}_{z}^{2})^{1/2}$
, and the grey layer is the shock interface. In figure 13(a), it is clear that an annular slip surface
 $(\text{S}_{1})$
is formed from the triple point of the Mach disc with a vorticity of opposite rotation to the jet shear layer (figure 14
a), and its magnitude (figure 14
a,
$(\text{S}_{1})$
is formed from the triple point of the Mach disc with a vorticity of opposite rotation to the jet shear layer (figure 14
a), and its magnitude (figure 14
a,
 $|\unicode[STIX]{x1D714}_{z}|_{max}=1.015\times 10^{6}$
) is approximately equal to that of the jet shear layer (
$|\unicode[STIX]{x1D714}_{z}|_{max}=1.015\times 10^{6}$
) is approximately equal to that of the jet shear layer (
 $|\unicode[STIX]{x1D714}_{z}|_{max}=1.09\times 10^{6}$
).
$|\unicode[STIX]{x1D714}_{z}|_{max}=1.09\times 10^{6}$
).
In the initial stage, the slip surface is stable and smooth; however, there is a velocity difference on both its sides (figure 7
b). Thus, the K–H instability exists. The slip surface loses stability under the effect of K–H instability during its spread, which leads to the rolling up of a SVR at its end (figure 13
b,c). After generation, the SVR expands outwards, and the size and circulation of its core rapidly increase (figure 14) through the entrainment of the slip surface
 $(\text{S}_{1})$
and outsider gas, which leads to the generation of a new vortex-induced shock pair (
$(\text{S}_{1})$
and outsider gas, which leads to the generation of a new vortex-induced shock pair (
 $\text{SVS}_{1}$
and
$\text{SVS}_{1}$
and
 $\text{SVS}_{2}$
) on opposite sides of the secondary vortex core, as shown at
$\text{SVS}_{2}$
) on opposite sides of the secondary vortex core, as shown at
 $t=0.19~\text{ms}$
of figure 14(b).
$t=0.19~\text{ms}$
of figure 14(b).
Since the gas velocity at the downstream of the Mach disc is subsonic (figure 7
b), the flow velocity inside the slip surface is smaller than that outside. Hence, the vorticity of the SVR is large and opposite to that of primary vortex core (figure 14
a). When the SVR interacts with the front of the PVR, the opposite induced velocity by the SVR locally decelerates the front interface and makes the convex leading front in the axial region change into the cap profile (figure 5
b, CD). Later, the orbiting of the SVRs and the mutual interactions with the PVR make the flow of the front interface slow down and form a flat-faced structure (figure 10
d,e). Subsequently, the trailing annulus slip surface is perturbed by the fluctuation in the turbulent PVR (figure 14
b,
 $t=0.165~\text{ms}$
; figure 13
c), and finally a series of fine-scale vortex filaments are observed around the azimuth of the PVR (figure 12
b).
$t=0.165~\text{ms}$
; figure 13
c), and finally a series of fine-scale vortex filaments are observed around the azimuth of the PVR (figure 12
b).
As the SVR and trailing slip surface roll over the periphery of the PVR, the primary vortex core is stretched along the longitudinal direction (figure 14,
 $t=0.19~\text{ms}$
), and then compresses upstream and becomes highly turbulent after the SVR passes the vertex of the PVR (figure 14,
$t=0.19~\text{ms}$
), and then compresses upstream and becomes highly turbulent after the SVR passes the vertex of the PVR (figure 14,
 $t=0.27~\text{ms}$
). Meanwhile, the trailing slip surface breaks up and forms coherent structures around the front interface of the PVR (figure 12
c). From the colour distribution, the fine-scale coherent structures generated on the front interface of the PVR can improve the mixing effect.
$t=0.27~\text{ms}$
). Meanwhile, the trailing slip surface breaks up and forms coherent structures around the front interface of the PVR (figure 12
c). From the colour distribution, the fine-scale coherent structures generated on the front interface of the PVR can improve the mixing effect.

Figure 14. Sequential vorticity and schlieren images of the symmetric plane around the highly under-expanded jet (
 $n=4.0$
).
$n=4.0$
).
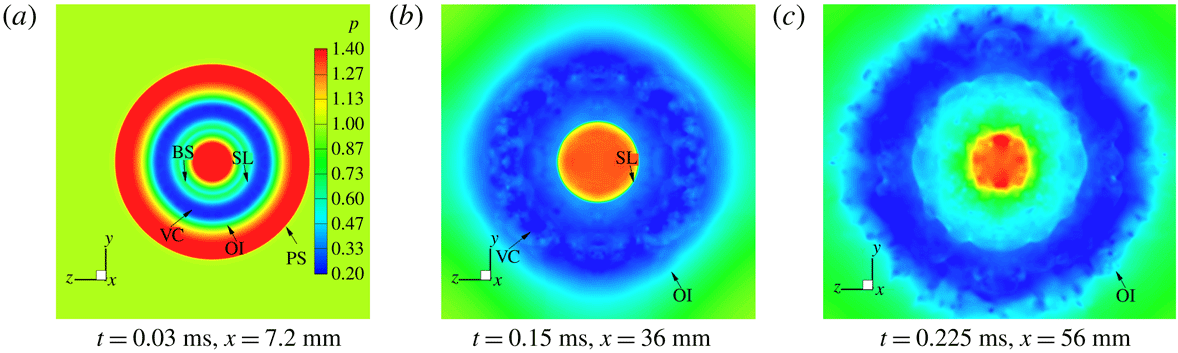
Figures 15 and 16 present the head-on pressure contours of the cross-section of the primary vortex core at three different moments for
 $n=1.4$
and 4.0. Figures 15(a) and 16(a) show that the region with the lowest pressure (blue) refers to the primary vortex core, which divides the flow fields with two high-pressure concentric rings. The exterior boundary of the outer loop denotes the precursor shock wave, while the inner boundary refers to the jet shear layer. At
$n=1.4$
and 4.0. Figures 15(a) and 16(a) show that the region with the lowest pressure (blue) refers to the primary vortex core, which divides the flow fields with two high-pressure concentric rings. The exterior boundary of the outer loop denotes the precursor shock wave, while the inner boundary refers to the jet shear layer. At
 $t=0.03~\text{ms}$
, it is clear that the cross-flow field of the core appears completely symmetric and uniform in a circular shape for both
$t=0.03~\text{ms}$
, it is clear that the cross-flow field of the core appears completely symmetric and uniform in a circular shape for both
 $n=1.4$
and 4.0, and the flow is laminar at this moment. Since the PVR expands and attenuates rapidly, most of the ambient gas is entrained into the core, which makes the diameter of its vortex core increase greatly. Meanwhile, the PVR becomes unstable (figures 15 and 16
b), and the inner region of the core is distorted. At
$n=1.4$
and 4.0, and the flow is laminar at this moment. Since the PVR expands and attenuates rapidly, most of the ambient gas is entrained into the core, which makes the diameter of its vortex core increase greatly. Meanwhile, the PVR becomes unstable (figures 15 and 16
b), and the inner region of the core is distorted. At
 $t=0.225~\text{ms}$
, the radial profile of the pressure becomes random (figures 15 and 16
c).
$t=0.225~\text{ms}$
, the radial profile of the pressure becomes random (figures 15 and 16
c).
On the other hand, the PVR for
 $n=4.0$
expands and attenuates more rapidly. Even the PVR transits from laminar to turbulent flow after
$n=4.0$
expands and attenuates more rapidly. Even the PVR transits from laminar to turbulent flow after
 $t=0.15~\text{ms}$
(figure 16
b,c). Additionally, the pressure within jet centre is still high, and the ring is basically a circle; however, clouds with tiny vortices are included at
$t=0.15~\text{ms}$
(figure 16
b,c). Additionally, the pressure within jet centre is still high, and the ring is basically a circle; however, clouds with tiny vortices are included at
 $t=0.225~\text{ms}$
(figure 16
c).
$t=0.225~\text{ms}$
(figure 16
c).

Figure 15. Head-on pressure contours of the PVR for the moderately under-expanded jet,
 $n=1.4$
. (SL, shear layer; VC, primary vortex core; OI, outer interface; PS, precursor shock wave.)
$n=1.4$
. (SL, shear layer; VC, primary vortex core; OI, outer interface; PS, precursor shock wave.)

Figure 16. Head-on pressure contours of the PVR for the highly under-expanded jet,
 $n=4.0$
. (BS, barrel shock.)
$n=4.0$
. (BS, barrel shock.)
3.3 Instability analysis of the PVR
To investigate the initial instabilities of the compressible vortex ring, the contours of the azimuthal vorticity (
 $\unicode[STIX]{x1D714}_{\unicode[STIX]{x1D703}}$
) on a plane across the primary vortex core with
$\unicode[STIX]{x1D714}_{\unicode[STIX]{x1D703}}$
) on a plane across the primary vortex core with
 $n=1.4$
are shown in figure 17. This indicates that, at the initial stage (
$n=1.4$
are shown in figure 17. This indicates that, at the initial stage (
 $t=0.02~\text{ms}$
), there is no obvious distortion near the inner and outer boundary of the ring. Along the radial direction, there exists one vorticity peak corresponding to the first radial mode, and the thin annulus near the outer boundary is the interface of the PVR; along the azimuthal direction, small distortions have appeared within the vortex core, which is different from the phenomenon observed by Ran & Colonius (Reference Ran and Colonius2009) under a low Mach number, where the distortions appear near both the ring boundaries and the vorticity peak and no obvious small distortion has appeared. The difference can be attributed to the following two factors in our work: one is that there is no initial perturbation added and the other is the appearance of the vortex-induced shock pair at high Mach number, which interacts with the PVR and accelerates the instability of the vortex core (Zhang et al.
Reference Zhang, Chen, Jiang and Huang2015). As time goes on (
$t=0.02~\text{ms}$
), there is no obvious distortion near the inner and outer boundary of the ring. Along the radial direction, there exists one vorticity peak corresponding to the first radial mode, and the thin annulus near the outer boundary is the interface of the PVR; along the azimuthal direction, small distortions have appeared within the vortex core, which is different from the phenomenon observed by Ran & Colonius (Reference Ran and Colonius2009) under a low Mach number, where the distortions appear near both the ring boundaries and the vorticity peak and no obvious small distortion has appeared. The difference can be attributed to the following two factors in our work: one is that there is no initial perturbation added and the other is the appearance of the vortex-induced shock pair at high Mach number, which interacts with the PVR and accelerates the instability of the vortex core (Zhang et al.
Reference Zhang, Chen, Jiang and Huang2015). As time goes on (
 $t=0.055~\text{ms}$
), the instability within the vortex core increases, and the radial vorticity develops two peaks illustrating the second radial mode (figure 17
b). From
$t=0.055~\text{ms}$
), the instability within the vortex core increases, and the radial vorticity develops two peaks illustrating the second radial mode (figure 17
b). From
 $t=0.11~\text{ms}$
, the interface of the PVR starts to distort, and the flow becomes more unstable; finally, at
$t=0.11~\text{ms}$
, the interface of the PVR starts to distort, and the flow becomes more unstable; finally, at
 $t=0.225~\text{ms}$
, the interface breaks into small vortices. In addition, it can also be observed that during the whole process of the morphology change of the vortex ring, the contours in the inner region of the ring remain at an almost constant size due to the continuous incoming flow from the nozzle, while the counters near the outer boundary expand outward.
$t=0.225~\text{ms}$
, the interface breaks into small vortices. In addition, it can also be observed that during the whole process of the morphology change of the vortex ring, the contours in the inner region of the ring remain at an almost constant size due to the continuous incoming flow from the nozzle, while the counters near the outer boundary expand outward.
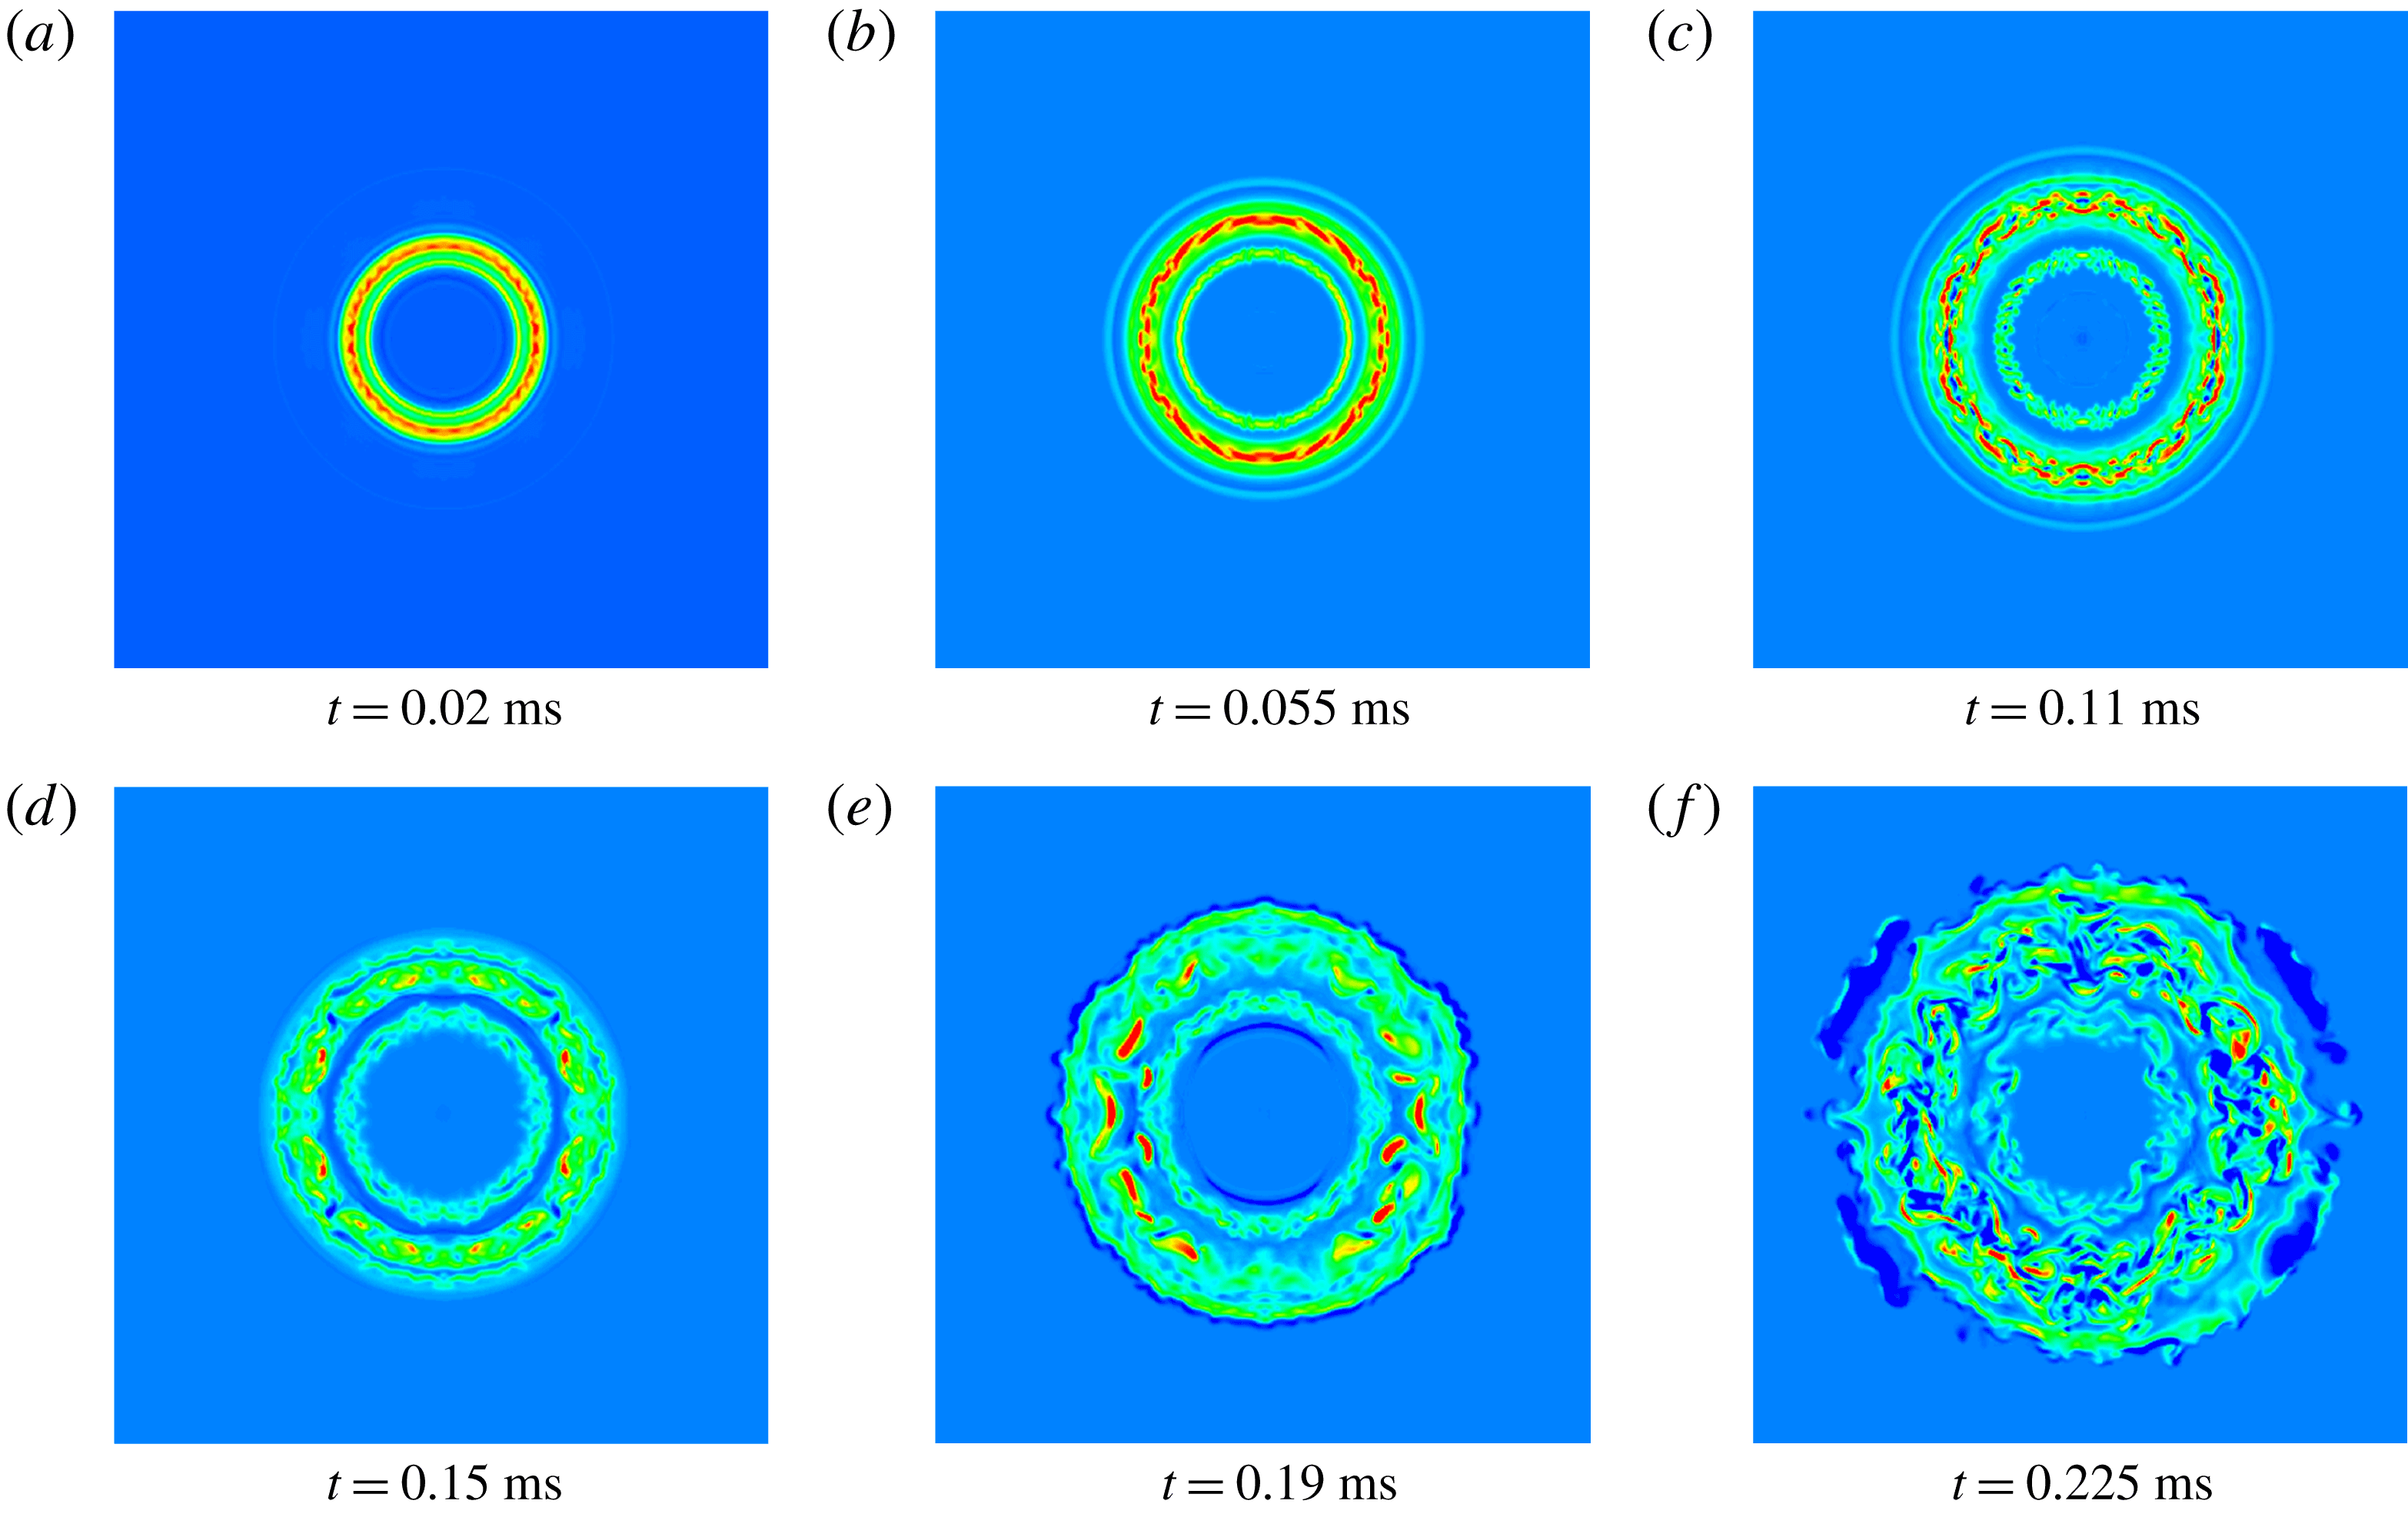
Figure 17. Contours of the azimuthal vorticity (
 $\unicode[STIX]{x1D714}_{\unicode[STIX]{x1D703}}$
,
$\unicode[STIX]{x1D714}_{\unicode[STIX]{x1D703}}$
,
 $\text{S}^{-1}$
) on a plane across the PVR core with contour levels: (a)
$\text{S}^{-1}$
) on a plane across the PVR core with contour levels: (a)
 $\max =10^{6}$
,
$\max =10^{6}$
,
 $\min =-10^{5}$
, level
$\min =-10^{5}$
, level
 $=$
109; (b–f)
$=$
109; (b–f)
 $\max =7\times 10^{5}$
,
$\max =7\times 10^{5}$
,
 $\min =-10^{5}$
, increment
$\min =-10^{5}$
, increment
 $=$
109. The pressure ratio is
$=$
109. The pressure ratio is
 $n=1.4$
.
$n=1.4$
.
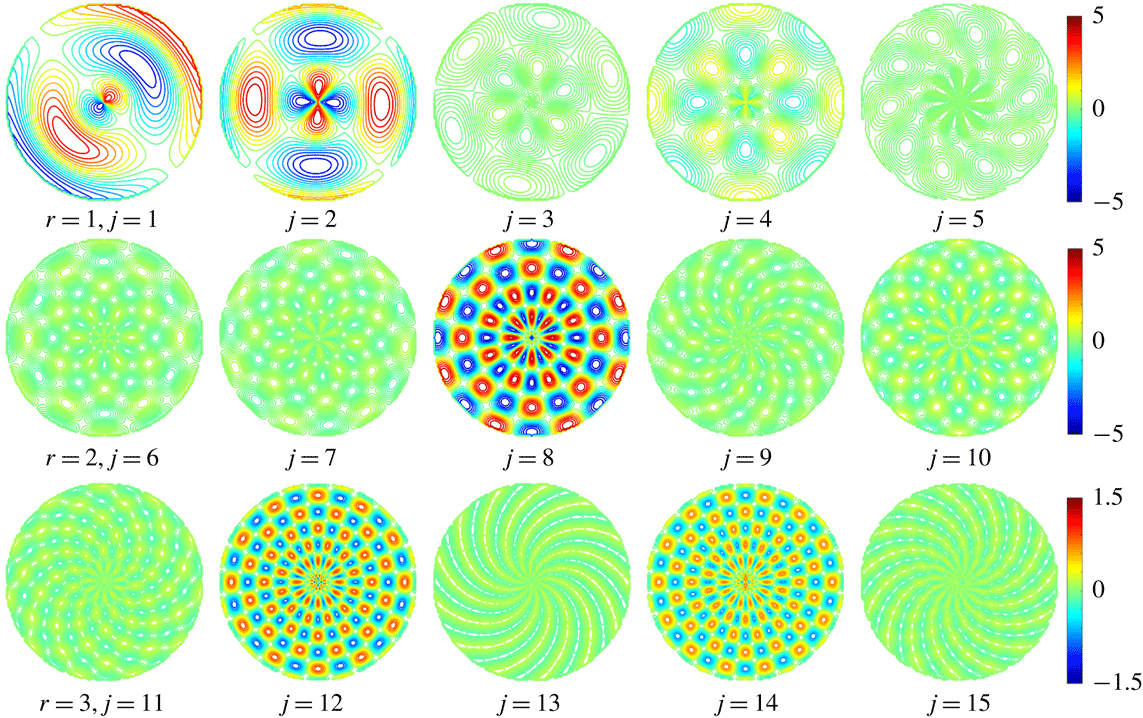
Figure 18 displays the end view of the contours of the azimuthal vorticity with different radial and azimuthal modes at
 $t=0.02~\text{ms}$
, where
$t=0.02~\text{ms}$
, where
 $r$
and
$r$
and
 $j$
represent the number of the radial and azimuthal modes, respectively. Each row shares the same radial mode. It should be noticed that in the current work, a continuous 0.02 ms inflow is equivalent to a stroke length of approximately
$j$
represent the number of the radial and azimuthal modes, respectively. Each row shares the same radial mode. It should be noticed that in the current work, a continuous 0.02 ms inflow is equivalent to a stroke length of approximately
 $L/D=Ma\times c\times t/D=1$
, where
$L/D=Ma\times c\times t/D=1$
, where
 $Ma$
is the Mach number,
$Ma$
is the Mach number,
 $c$
is the speed of sound and
$c$
is the speed of sound and
 $D$
is the radius of the nozzle. Figure 18 indicates that, except for the first azimuthal mode, an even azimuthal mode shows a comparatively higher vortex intensity, which should be related to the harmonic effect of the azimuthal mode. For all the modes shown in figure 18, the radial mode 2 and azimuthal mode 8 show the highest intensity; and for the third radial mode, the azimuthal mode 12 shows the highest intensity. For each radial mode, its dominant azimuthal mode is determined by checking all azimuthal modes with the radial mode fixed. According to the heuristic linear instability model (Widnall & Tsai Reference Widnall and Tsai1977; Saffman Reference Saffman1978; Ran Reference Ran2004), a particular azimuthal number is unstable only for a certain radial mode. The unstable azimuthal mode can be calculated as
$D$
is the radius of the nozzle. Figure 18 indicates that, except for the first azimuthal mode, an even azimuthal mode shows a comparatively higher vortex intensity, which should be related to the harmonic effect of the azimuthal mode. For all the modes shown in figure 18, the radial mode 2 and azimuthal mode 8 show the highest intensity; and for the third radial mode, the azimuthal mode 12 shows the highest intensity. For each radial mode, its dominant azimuthal mode is determined by checking all azimuthal modes with the radial mode fixed. According to the heuristic linear instability model (Widnall & Tsai Reference Widnall and Tsai1977; Saffman Reference Saffman1978; Ran Reference Ran2004), a particular azimuthal number is unstable only for a certain radial mode. The unstable azimuthal mode can be calculated as
 $j=kR/\unicode[STIX]{x1D70E}$
, where
$j=kR/\unicode[STIX]{x1D70E}$
, where
 $k$
is a constant and
$k$
is a constant and
 $R$
and
$R$
and
 $\unicode[STIX]{x1D70E}$
are the radius of the core and the ring (see the definitions of
$\unicode[STIX]{x1D70E}$
are the radius of the core and the ring (see the definitions of
 $R$
and
$R$
and
 $\unicode[STIX]{x1D70E}$
in figure 5). For radial modes 2 and 3, the values of the corresponding
$\unicode[STIX]{x1D70E}$
in figure 5). For radial modes 2 and 3, the values of the corresponding
 $k$
are 2.5 and 4.35 (Widnall & Tsai Reference Widnall and Tsai1977; Saffman Reference Saffman1978; Ran Reference Ran2004). In the current case, for the second radial mode,
$k$
are 2.5 and 4.35 (Widnall & Tsai Reference Widnall and Tsai1977; Saffman Reference Saffman1978; Ran Reference Ran2004). In the current case, for the second radial mode,
 $j=2.5\times 3=7.5$
, which roughly coincides with the dominant mode shown in figure 18; furthermore, for the third radial mode the azimuthal mode 12 shows the highest intensity, which is also close to the calculated dominant mode number,
$j=2.5\times 3=7.5$
, which roughly coincides with the dominant mode shown in figure 18; furthermore, for the third radial mode the azimuthal mode 12 shows the highest intensity, which is also close to the calculated dominant mode number,
 $j=4.35\times 3=13.05$
. It should be pointed out that the linear instability model for calculating the dominant azimuthal mode was developed by considering an inviscid incompressible flow (Widnall & Tsai Reference Widnall and Tsai1977; Saffman Reference Saffman1978).
$j=4.35\times 3=13.05$
. It should be pointed out that the linear instability model for calculating the dominant azimuthal mode was developed by considering an inviscid incompressible flow (Widnall & Tsai Reference Widnall and Tsai1977; Saffman Reference Saffman1978).
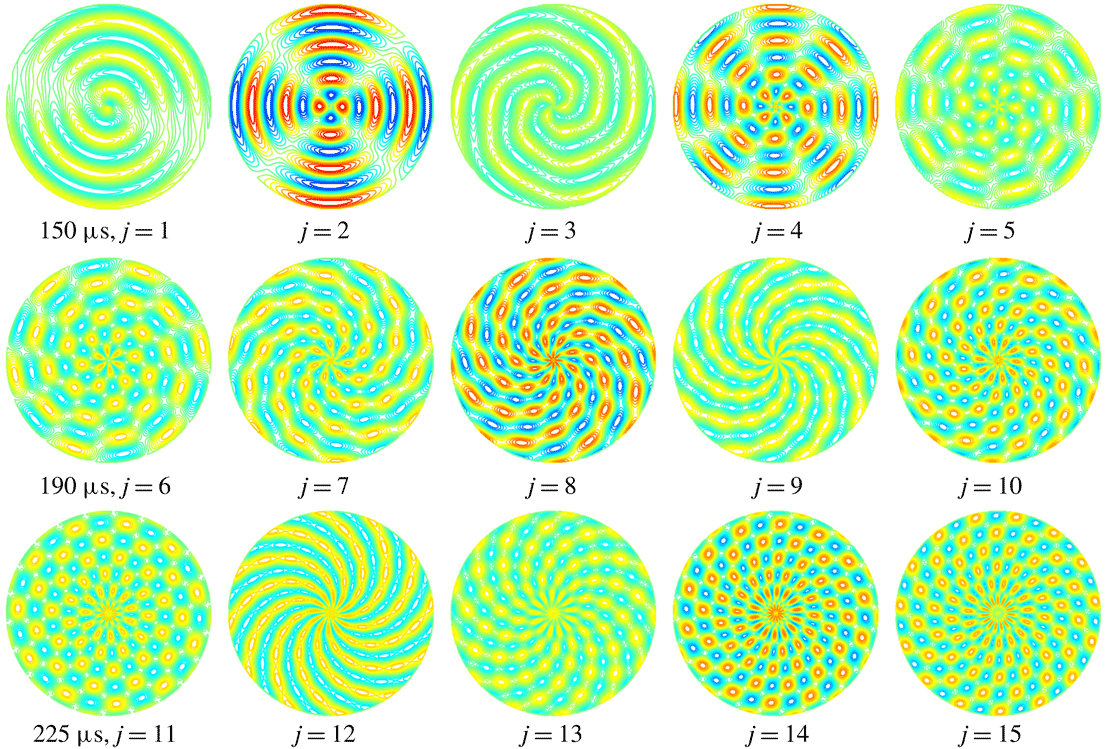
Figure 19 shows the end view of the contours of the azimuthal vorticity under different azimuthal modes with a radial mode of 3, at
 $t=0.225~\text{ms}$
. Different from the situation of 0.02 ms, the intensity of the vorticity of the different azimuthal modes does not show an obvious difference, and an even azimuthal mode no longer always has a higher intensity than an odd one. Such a difference should be attributed to the higher instability at 0.225 ms. Figure 20 displays the end view of the contours of the azimuthal vorticity with different radial and azimuthal modes at
$t=0.225~\text{ms}$
. Different from the situation of 0.02 ms, the intensity of the vorticity of the different azimuthal modes does not show an obvious difference, and an even azimuthal mode no longer always has a higher intensity than an odd one. Such a difference should be attributed to the higher instability at 0.225 ms. Figure 20 displays the end view of the contours of the azimuthal vorticity with different radial and azimuthal modes at
 $t=0.02~\text{ms}$
, when the pressure ratio is 4.0. We found the dominant azimuthal modes are similar to those for the pressure ratio of 1.4. The intensity of the azimuthal mode increases as the pressure ratio becomes larger, but the difference is not significant, especially for the case with a radial number of 2, while the variation of the intensity of the one-dimensional azimuthal energy spectra is very large (see figure 22
b,c). The similarity of the dominant modes may be attributed to the high-Mach-number flow in the current study; the initial instability is mainly caused by the interaction between the shock pair and the shear layer of the PVR. Figure 21 shows the end view of the contours of the azimuthal vorticity with different radial and azimuthal modes at different time steps when the pressure ratio is 4.0. Similar to the case of
$t=0.02~\text{ms}$
, when the pressure ratio is 4.0. We found the dominant azimuthal modes are similar to those for the pressure ratio of 1.4. The intensity of the azimuthal mode increases as the pressure ratio becomes larger, but the difference is not significant, especially for the case with a radial number of 2, while the variation of the intensity of the one-dimensional azimuthal energy spectra is very large (see figure 22
b,c). The similarity of the dominant modes may be attributed to the high-Mach-number flow in the current study; the initial instability is mainly caused by the interaction between the shock pair and the shear layer of the PVR. Figure 21 shows the end view of the contours of the azimuthal vorticity with different radial and azimuthal modes at different time steps when the pressure ratio is 4.0. Similar to the case of
 $n=1.4$
, as time proceeds, the difference of the intensity between different azimuthal modes decreases, and the even mode is no longer dominant compared with the odd mode.
$n=1.4$
, as time proceeds, the difference of the intensity between different azimuthal modes decreases, and the even mode is no longer dominant compared with the odd mode.

Figure 18. End view of the contours of the azimuthal vorticity with different radial and azimuthal modes at
 $t=0.02~\text{ms}$
. Each row has the same radial mode (
$t=0.02~\text{ms}$
. Each row has the same radial mode (
 $r$
), and
$r$
), and
 $j$
represents the number of the azimuthal mode. The pressure ratio is
$j$
represents the number of the azimuthal mode. The pressure ratio is
 $n=1.4$
. The unit of the scale bar is
$n=1.4$
. The unit of the scale bar is
 $10^{3}\,\text{S}^{-1}$
.
$10^{3}\,\text{S}^{-1}$
.

Figure 19. End view of the contours of the azimuthal vorticity with different radial and azimuthal modes at
 $t=0.225~\text{ms}$
. The pressure ratio is
$t=0.225~\text{ms}$
. The pressure ratio is
 $n=1.4$
. The maximum and minimum contour levels are
$n=1.4$
. The maximum and minimum contour levels are
 $2\times 10^{4}$
and
$2\times 10^{4}$
and
 $-2\times 10^{4}\,\text{S}^{-1}$
.
$-2\times 10^{4}\,\text{S}^{-1}$
.

Figure 20. End view of the contours of the azimuthal vorticity with different radial and azimuthal modes at
 $t=0.02~\text{ms}$
. Each row has the same radial mode (
$t=0.02~\text{ms}$
. Each row has the same radial mode (
 $r$
), and
$r$
), and
 $j$
represents the number of the azimuthal mode. The pressure ratio is
$j$
represents the number of the azimuthal mode. The pressure ratio is
 $n=4.0$
. The maximum and minimum contour levels are
$n=4.0$
. The maximum and minimum contour levels are
 $1\times 10^{4}$
and
$1\times 10^{4}$
and
 $-1\times 10^{4}\,\text{S}^{-1}$
.
$-1\times 10^{4}\,\text{S}^{-1}$
.

Figure 21. End view of the contours of the azimuthal vorticity with different radial and azimuthal modes at different time steps. Each row shares the same time. The pressure ratio is
 $n=4.0$
. The maximum and minimum contour levels are
$n=4.0$
. The maximum and minimum contour levels are
 $2\times 10^{4}$
and
$2\times 10^{4}$
and
 $-2\times 10^{4}\,\text{S}^{-1}$
.
$-2\times 10^{4}\,\text{S}^{-1}$
.
To study the turbulent transition of the flow, figure 22 plots the normalized azimuthal kinetic energy and the one-dimensional energy spectra along the
 $\unicode[STIX]{x1D703}$
direction at different times for both
$\unicode[STIX]{x1D703}$
direction at different times for both
 $n=1.4$
and 4.0. The azimuthal energy spectra are integrated (averaged) along the radial direction. As the flow initiates, the azimuthal kinetic energies of both cases have the same increasing tendency until
$n=1.4$
and 4.0. The azimuthal energy spectra are integrated (averaged) along the radial direction. As the flow initiates, the azimuthal kinetic energies of both cases have the same increasing tendency until
 $t=0.02~\text{ms}$
, then the energy almost becomes constant for
$t=0.02~\text{ms}$
, then the energy almost becomes constant for
 $n=1.4$
; after
$n=1.4$
; after
 $t=0.055~\text{ms}$
, its growth becomes rapid, indicating that the flow instability increases. At
$t=0.055~\text{ms}$
, its growth becomes rapid, indicating that the flow instability increases. At
 $t=0.225~\text{ms}$
, the azimuthal kinetic energy maintains an obvious rising trend, which implies a further increase of flow instability and flow transition to turbulence. For the curve of
$t=0.225~\text{ms}$
, the azimuthal kinetic energy maintains an obvious rising trend, which implies a further increase of flow instability and flow transition to turbulence. For the curve of
 $n=4.0$
, after approximately 0.02 ms, the normalized azimuthal kinetic energy becomes obviously higher, implying a higher level of azimuthal instability and turbulent transition; compare figure 22(b,c) for additional information. Furthermore, except in the initial period, the growth rate of
$n=4.0$
, after approximately 0.02 ms, the normalized azimuthal kinetic energy becomes obviously higher, implying a higher level of azimuthal instability and turbulent transition; compare figure 22(b,c) for additional information. Furthermore, except in the initial period, the growth rate of
 $n=4.0$
is higher. Figure 22(b) shows that at the beginning of the flow, the energy concentrates at large-scale modes (small wavenumbers), and the modes with higher wavenumbers contain little energy. As time increases, the energies of all modes increase, indicating energy transfer from the mean flow; additionally, the higher azimuthal modes are excited obviously due to the nonlinear interaction between the lower modes. Corresponding to figure 22(a), at
$n=4.0$
is higher. Figure 22(b) shows that at the beginning of the flow, the energy concentrates at large-scale modes (small wavenumbers), and the modes with higher wavenumbers contain little energy. As time increases, the energies of all modes increase, indicating energy transfer from the mean flow; additionally, the higher azimuthal modes are excited obviously due to the nonlinear interaction between the lower modes. Corresponding to figure 22(a), at
 $t=0.225~\text{ms}$
, the energy of the high azimuthal modes still tends to increase, implying that the flow is undergoing turbulence transition. Figure 22(c) shows that for the case of
$t=0.225~\text{ms}$
, the energy of the high azimuthal modes still tends to increase, implying that the flow is undergoing turbulence transition. Figure 22(c) shows that for the case of
 $n=4.0$
at 0.02 ms, the modes with higher wavenumbers have been excited, and after 0.15 ms, the development of the energy spectra has slowed down; this outcome has also been captured by the curve in figure 22(a). In addition, it can be noticed that figure 22(b) does not show distinct peaks corresponding to the azimuthal modes of 2, 8 and 12 displayed in figure 18, because the azimuthal kinetic energy analysed in figure 22(b,c) is integrated over the radius; thus, it refers to the azimuthal component solely.
$n=4.0$
at 0.02 ms, the modes with higher wavenumbers have been excited, and after 0.15 ms, the development of the energy spectra has slowed down; this outcome has also been captured by the curve in figure 22(a). In addition, it can be noticed that figure 22(b) does not show distinct peaks corresponding to the azimuthal modes of 2, 8 and 12 displayed in figure 18, because the azimuthal kinetic energy analysed in figure 22(b,c) is integrated over the radius; thus, it refers to the azimuthal component solely.

Figure 22. (a) Time evolution of the normalized azimuthal kinetic energy, where
 $(1/2)\unicode[STIX]{x1D70C}v_{\unicode[STIX]{x1D703}}^{2}$
and
$(1/2)\unicode[STIX]{x1D70C}v_{\unicode[STIX]{x1D703}}^{2}$
and
 $E_{0}$
are the azimuthal kinetic energy and total energy, respectively. (b) One-dimensional energy spectra along the
$E_{0}$
are the azimuthal kinetic energy and total energy, respectively. (b) One-dimensional energy spectra along the
 $\unicode[STIX]{x1D703}$
direction at different times for
$\unicode[STIX]{x1D703}$
direction at different times for
 $n=1.4$
. (c) One-dimensional energy spectra along the
$n=1.4$
. (c) One-dimensional energy spectra along the
 $\unicode[STIX]{x1D703}$
direction at different times for
$\unicode[STIX]{x1D703}$
direction at different times for
 $n=4.0$
. Parameter
$n=4.0$
. Parameter
 $k_{\unicode[STIX]{x1D703}}$
is the azimuthal wavenumber along the angular direction and the wavelength is
$k_{\unicode[STIX]{x1D703}}$
is the azimuthal wavenumber along the angular direction and the wavelength is
 $\unicode[STIX]{x1D706}=2\unicode[STIX]{x03C0}/k_{\unicode[STIX]{x1D703}}$
.
$\unicode[STIX]{x1D706}=2\unicode[STIX]{x03C0}/k_{\unicode[STIX]{x1D703}}$
.
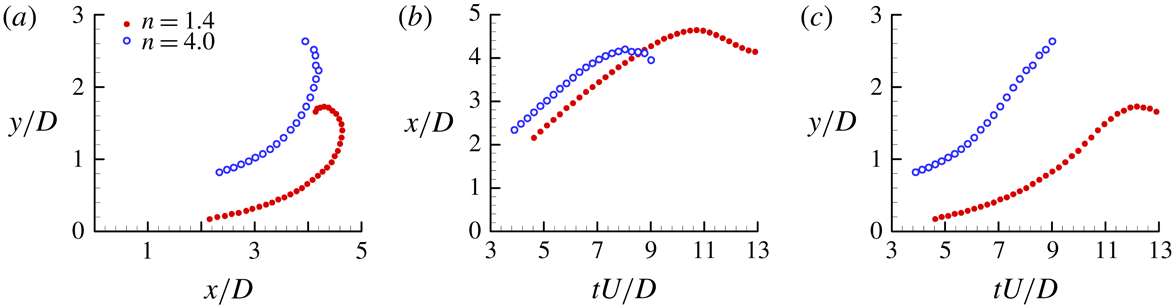
3.4 Geometric and mixing characteristics of the jet
Figure 23 displays the trajectories of the first SVRs for both jets. Since the first SVRs eventually become unstable, the plot only shows their stable propagating process. It is clear that both SVRs have almost the same moving tendency (figure 23
a), but for
 $n=4.0$
there is a stronger transverse expanding effect and larger diameter than for
$n=4.0$
there is a stronger transverse expanding effect and larger diameter than for
 $n=1.4$
due to the higher inner pressure (figure 23
c). After formation, the SVR moves mainly downstream (towards the front of the PVR); the axial distance from the tube exit to the SVR for both jets increases linearly at the early stage (
$n=1.4$
due to the higher inner pressure (figure 23
c). After formation, the SVR moves mainly downstream (towards the front of the PVR); the axial distance from the tube exit to the SVR for both jets increases linearly at the early stage (
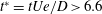 $t^{\ast }=tUe/D>6.6$
) and then becomes slow and reaches the largest value as the SVR passes over the vertex of the PVR. After that, for
$t^{\ast }=tUe/D>6.6$
) and then becomes slow and reaches the largest value as the SVR passes over the vertex of the PVR. After that, for
 $n=1.4$
, its SVR moves upstream and the corresponding axial distance decreases (figure 23
b). On the other hand, the transverse expansions of the secondary vortex core for both jets increase first, and the growth gradient becomes large at the stage of the SVR moving along the head interface of the PVR, but the growth rate for
$n=1.4$
, its SVR moves upstream and the corresponding axial distance decreases (figure 23
b). On the other hand, the transverse expansions of the secondary vortex core for both jets increase first, and the growth gradient becomes large at the stage of the SVR moving along the head interface of the PVR, but the growth rate for
 $n=4.0$
is much higher, and its SVR becomes unstable during the interaction with the PVR. However, for
$n=4.0$
is much higher, and its SVR becomes unstable during the interaction with the PVR. However, for
 $n=1.4$
, the SVR loses its stability after its interaction with the PVR, and the diameter decreases at this time (figure 23
c).
$n=1.4$
, the SVR loses its stability after its interaction with the PVR, and the diameter decreases at this time (figure 23
c).

Figure 23. Trajectories of the first SVRs.
Figure 24 shows the time history of the axial distances of the PVR from the tube exit to its front interface (
 $Lm$
) with different pressure ratios. It is clear that, first,
$Lm$
) with different pressure ratios. It is clear that, first,
 $Lm$
increases linearly and becomes nonlinear later. The linear stage is longer for smaller pressure ratio (
$Lm$
increases linearly and becomes nonlinear later. The linear stage is longer for smaller pressure ratio (
 $n=1.0$
and 1.4) than for higher pressure ratio (
$n=1.0$
and 1.4) than for higher pressure ratio (
 $n=2.7$
and 4.0). While for the highly under-expanded jet (
$n=2.7$
and 4.0). While for the highly under-expanded jet (
 $n=2.7$
and 4.0),
$n=2.7$
and 4.0),
 $Lm$
increases rapidly first, due to the expanding effect of the jet flow, and then becomes slow (after
$Lm$
increases rapidly first, due to the expanding effect of the jet flow, and then becomes slow (after
 $t^{\ast }=tU/D=3.8$
) under the action of the SVR; finally, the value of
$t^{\ast }=tU/D=3.8$
) under the action of the SVR; finally, the value of
 $Lm$
for
$Lm$
for
 $n=1.4$
exceeds that for
$n=1.4$
exceeds that for
 $n=2.7$
and 4.0 at
$n=2.7$
and 4.0 at
 $t^{\ast }=9.1$
and 12.8, respectively.
$t^{\ast }=9.1$
and 12.8, respectively.

Figure 24. Time history of
 $Lm$
for different pressure ratios.
$Lm$
for different pressure ratios.
Figure 25 shows the time history of unsteady jet entrainment rates (Zhang et al. Reference Zhang, Chen, Guo, Zheng and Xue2018). Since the mixing process in the unsteady jet involves bulk mixing driven by a large-scale vortex ring, and smaller-scale mixing is dominated by turbulent coherent structures, the variation of the entrainment rate is actually determined by the stability of the PVR.
From figure 25, it is clear that the variations of the entrainment rates for both jets have the same tendency. They decrease first at the early stage (
 $t\leqslant 0.02~\text{ms}$
) due to the relative stability of the jet flow; at this time, the entrainment gas mass is smaller than the added jet mass from the nozzle. However, with the loss of stability of the PVR, the entrainment mass increases and becomes larger than the added gas mass, making the entrainment rate rise at a relatively small rate during the period of
$t\leqslant 0.02~\text{ms}$
) due to the relative stability of the jet flow; at this time, the entrainment gas mass is smaller than the added jet mass from the nozzle. However, with the loss of stability of the PVR, the entrainment mass increases and becomes larger than the added gas mass, making the entrainment rate rise at a relatively small rate during the period of
 $0.02~\text{ms}\leqslant t\leqslant 0.20~\text{ms}$
for
$0.02~\text{ms}\leqslant t\leqslant 0.20~\text{ms}$
for
 $n=1.4$
and
$n=1.4$
and
 $0.02~\text{ms}\leqslant t\leqslant 0.17~\text{ms}$
for
$0.02~\text{ms}\leqslant t\leqslant 0.17~\text{ms}$
for
 $n=1.4$
. Finally, the increase rates of both jets grow quickly along with the turbulence transition of the PVR (
$n=1.4$
. Finally, the increase rates of both jets grow quickly along with the turbulence transition of the PVR (
 $t\geqslant 0.20~\text{ms}$
for
$t\geqslant 0.20~\text{ms}$
for
 $n=1.4$
, and
$n=1.4$
, and
 $t\geqslant 0.17~\text{ms}$
for
$t\geqslant 0.17~\text{ms}$
for
 $n=4.0$
) due to its interaction with the SVRs.
$n=4.0$
) due to its interaction with the SVRs.
On the other hand, the value of the entrainment rate for
 $n=4.0$
is smaller than that for
$n=4.0$
is smaller than that for
 $n=1.4$
at the initial stage, but its gradient increase is larger. For
$n=1.4$
at the initial stage, but its gradient increase is larger. For
 $n=4.0$
, the vorticity of its SVR is much larger than that for
$n=4.0$
, the vorticity of its SVR is much larger than that for
 $n=1.4$
; therefore, its action with the PVR is stronger. In addition, its trailing slip surface makes the front interface of the PVR change dramatically. Under the action of both the above effects, the entrainment rate increases more rapidly and becomes larger than that for
$n=1.4$
; therefore, its action with the PVR is stronger. In addition, its trailing slip surface makes the front interface of the PVR change dramatically. Under the action of both the above effects, the entrainment rate increases more rapidly and becomes larger than that for
 $n=1.4$
after
$n=1.4$
after
 $t>0.164~\text{ms}$
. This indicates that the development of the SVR for the highly under-expanded jet flow has a great effect on enhancing the mixing effect.
$t>0.164~\text{ms}$
. This indicates that the development of the SVR for the highly under-expanded jet flow has a great effect on enhancing the mixing effect.

Figure 25. Time history of the entrainment rate for both
 $n=1.4$
and 4.0.
$n=1.4$
and 4.0.
4 Conclusions
The initial 3-D flow structures of moderately and highly under-expanded circular jets have been numerically investigated. The main initial flow structures of both jets include the precursor shock wave, PVR, Mach cone, SVR and vortex-induced shock pair, but their shock wave structures are different. For
 $n=1.4$
, the shock wave regular reflection appears within the jet and a typical shock cell generates behind the PVR; for
$n=1.4$
, the shock wave regular reflection appears within the jet and a typical shock cell generates behind the PVR; for
 $n=4.0$
, the reflection transits to Mach reflection and the Mach disc structure emerges, and we find that the outsider end of the annular slip surface originates from the triple point of the Mach disc, which rolls up to generate the SVR under the effect of K–H instability.
$n=4.0$
, the reflection transits to Mach reflection and the Mach disc structure emerges, and we find that the outsider end of the annular slip surface originates from the triple point of the Mach disc, which rolls up to generate the SVR under the effect of K–H instability.
For both jets (
 $n=1.4$
and 4.0), during jet evolution, there are two main factors to accelerate the instability of the PVR: one is the interaction of the shock pair with the vortex core and the other is the interaction of the SVR with the PVR. The former is in action all the time and causes the PVR to lose its stability starting from the vortex core, and the latter operates only when the SVR rolls over the periphery of the PVR, and its effect increases with the growth of the pressure ratio.
$n=1.4$
and 4.0), during jet evolution, there are two main factors to accelerate the instability of the PVR: one is the interaction of the shock pair with the vortex core and the other is the interaction of the SVR with the PVR. The former is in action all the time and causes the PVR to lose its stability starting from the vortex core, and the latter operates only when the SVR rolls over the periphery of the PVR, and its effect increases with the growth of the pressure ratio.
The characteristics of the SVR are also under the influence of the pressure ratio. For
 $n=1.4$
, its size is stable, and the interaction is dominated by the PVR; then, it loses stability after rolling over the periphery of the PVR and turns into irregular waviness at the wake. The subsequent SVRs break up into many fine-scale rib structures on the periphery of the PVR. For
$n=1.4$
, its size is stable, and the interaction is dominated by the PVR; then, it loses stability after rolling over the periphery of the PVR and turns into irregular waviness at the wake. The subsequent SVRs break up into many fine-scale rib structures on the periphery of the PVR. For
 $n=4.0$
, it has a strong transverse expansion, and its size and circulation also increase during the evolution, and the shock pair appears within its core. Furthermore, its action causes the PVR and itself to distort and become unstable immediately.
$n=4.0$
, it has a strong transverse expansion, and its size and circulation also increase during the evolution, and the shock pair appears within its core. Furthermore, its action causes the PVR and itself to distort and become unstable immediately.
The radial and azimuthal modes for
 $n=1.4$
obtained by Fourier analysis indicate that for the second and third radial modes, the dominant azimuthal modes are the eighth and twelfth modes, which are close to the unstable azimuthal modes calculated by the heuristic linear instability model (Widnall & Tsai Reference Widnall and Tsai1977; Saffman Reference Saffman1978; Ran Reference Ran2004); and it is also found that the high and moderate pressure ratios show similar dominant azimuthal modes, implying that for both cases, the initial instability may be attributed to the interaction between the shock pair and the shear layer of the PVR. The azimuthal energy spectra show that at the initial stage, only the small wavenumbers are excited; as flow develops, the higher azimuthal modes are excited obviously, indicating the flow transition to turbulence. Furthermore, as the pressure ratio increases, the development of the energy spectra becomes faster.
$n=1.4$
obtained by Fourier analysis indicate that for the second and third radial modes, the dominant azimuthal modes are the eighth and twelfth modes, which are close to the unstable azimuthal modes calculated by the heuristic linear instability model (Widnall & Tsai Reference Widnall and Tsai1977; Saffman Reference Saffman1978; Ran Reference Ran2004); and it is also found that the high and moderate pressure ratios show similar dominant azimuthal modes, implying that for both cases, the initial instability may be attributed to the interaction between the shock pair and the shear layer of the PVR. The azimuthal energy spectra show that at the initial stage, only the small wavenumbers are excited; as flow develops, the higher azimuthal modes are excited obviously, indicating the flow transition to turbulence. Furthermore, as the pressure ratio increases, the development of the energy spectra becomes faster.
Finally, we compare the axial distances of the PVR
 $(L_{m})$
for both jets and find that they increase linearly and then become nonlinear for both jets, the duration for the linear stage being longer for the small pressure ratio (
$(L_{m})$
for both jets and find that they increase linearly and then become nonlinear for both jets, the duration for the linear stage being longer for the small pressure ratio (
 $n=1.0$
and 1.4). Additionally, since the vorticity of the SVR for
$n=1.0$
and 1.4). Additionally, since the vorticity of the SVR for
 $n=4.0$
is much larger than that for
$n=4.0$
is much larger than that for
 $n=1.4$
, its action and its trailing slip surface cause the front interface of the PVR to change dramatically. As a result, the SVR for the highly under-expanded jet flow has a stronger effect on enhancing the mixing effect.
$n=1.4$
, its action and its trailing slip surface cause the front interface of the PVR to change dramatically. As a result, the SVR for the highly under-expanded jet flow has a stronger effect on enhancing the mixing effect.
Acknowledgements
This work was supported by the National Natural Science Foundation of China (grant nos. 11502117 and 11702005) and the Foundation of Key Laboratory of Transient Physics (614260403041802).
Appendix. Numerical validation by several supersonic jet problems
Here, we show a further validation of our numerical model by simulation and compare the simulation results with the corresponding experimental results, which we have published previously (Zhang et al. Reference Zhang, Chen, Li and Jiang2014, Reference Zhang, Chen, Guo and Sun2017). In addition to the inflow conditions, all of the following simulation cases were using the same numerical method and computational model as this paper.
Figure 26 shows the evolution process of the initial flow field of the moderately under-expanded circular jet with the corresponding experimental results of Murugan & Das (Reference Murugan and Das2010). The experimental sequence images were obtained using a double-pulsed laser and a high-speed CCD camera for
 $Ma=1.7$
, and our numerical results (Zhang et al.
Reference Zhang, Chen, Li and Jiang2014) are the mixture fraction contours for
$Ma=1.7$
, and our numerical results (Zhang et al.
Reference Zhang, Chen, Li and Jiang2014) are the mixture fraction contours for
 $Ma=1.4$
and
$Ma=1.4$
and
 $n=1.4$
. Both types of omages show the detailed evolution of the PVRs and SVRs and agree well with each other; however, due to the different Mach numbers and expanding pressure ratios, some particular differences exist between them.
$n=1.4$
. Both types of omages show the detailed evolution of the PVRs and SVRs and agree well with each other; however, due to the different Mach numbers and expanding pressure ratios, some particular differences exist between them.

Figure 26. Comparison of the vortex ring evolution process of our computational results (
 $Ma=1.4$
) with the corresponding experimental results (
$Ma=1.4$
) with the corresponding experimental results (
 $Ma=1.7$
) of Murugan & Das (Reference Murugan and Das2010).
$Ma=1.7$
) of Murugan & Das (Reference Murugan and Das2010).
Figure 27 compares the instantaneous flow fields of our numerical images (Zhang et al.
Reference Zhang, Chen, Li and Jiang2014) with the experimental images of Zare-Behtash et al. (Reference Zare-Behtash, Kontis and Gongora-Orozco2008a
,Reference Zare-Behtash, Kontis and Takayama
b
). The experimental Mach number is
 $Ma=1.31$
, and our numerical images are obtained from the superimposition of the schlieren results of the symmetric section with the 3-D isosurface of the jet flow mixture fraction. It is obvious that the shape and position of both the SVR and PVR of our computational results (
$Ma=1.31$
, and our numerical images are obtained from the superimposition of the schlieren results of the symmetric section with the 3-D isosurface of the jet flow mixture fraction. It is obvious that the shape and position of both the SVR and PVR of our computational results (
 $Ma=1.4$
) are also in good agreement with experimental images of Zare-Behtash et al. (Reference Zare-Behtash, Kontis and Gongora-Orozco2008a
,Reference Zare-Behtash, Kontis and Takayama
b
). The SVRs are formed even for low Mach numbers of
$Ma=1.4$
) are also in good agreement with experimental images of Zare-Behtash et al. (Reference Zare-Behtash, Kontis and Gongora-Orozco2008a
,Reference Zare-Behtash, Kontis and Takayama
b
). The SVRs are formed even for low Mach numbers of
 $Ma=1.4$
and 1.31 rather than a critical Mach number of
$Ma=1.4$
and 1.31 rather than a critical Mach number of
 $Ma\geqslant 1.6$
mentioned in (Murugan & Das Reference Murugan and Das2010). The roll up of the vortices along the shear layer and their engulfment into the main vortex core can be clearly seen in both the numerical and experimental results, which will be discussed in the following paragraphs.
$Ma\geqslant 1.6$
mentioned in (Murugan & Das Reference Murugan and Das2010). The roll up of the vortices along the shear layer and their engulfment into the main vortex core can be clearly seen in both the numerical and experimental results, which will be discussed in the following paragraphs.

Figure 27. Comparison of the instantaneous flow fields of our numerical images (Zhang et al. Reference Zhang, Chen, Li and Jiang2014) with the experimental images of Zare-Behtash et al. (Reference Zare-Behtash, Kontis and Gongora-Orozco2008a ,Reference Zare-Behtash, Kontis and Takayama b ).
The instantaneous flow structure of an under-expanded elliptic jet on the minor plane (Zhang et al.
Reference Zhang, Chen, Guo and Sun2017), in which the elliptic jet’s axis ratio
 $a/b$
equals 2.5, is compared with the corresponding experimental results of Zare-Behtash et al. (Reference Zare-Behtash, Kontis, Gongora-Orozco and Takayama2009a
,Reference Zare-Behtash, Gongora-Orozco and Kontis
b
), as shown in figure 28. The Mach number and nozzle pressure ratio of our schlieren results are
$a/b$
equals 2.5, is compared with the corresponding experimental results of Zare-Behtash et al. (Reference Zare-Behtash, Kontis, Gongora-Orozco and Takayama2009a
,Reference Zare-Behtash, Gongora-Orozco and Kontis
b
), as shown in figure 28. The Mach number and nozzle pressure ratio of our schlieren results are
 $Ma=1.4$
and
$Ma=1.4$
and
 $n=1.4$
, while the experimental Mach number is
$n=1.4$
, while the experimental Mach number is
 $Ma=1.32$
(figure 28
b). It is shown in figure 28 that both the shock patterns and vortex structures of our numerical results are in good agreement with the corresponding experimental schlieren images (Zare-Behtash et al.
Reference Zare-Behtash, Kontis, Gongora-Orozco and Takayama2009a
,Reference Zare-Behtash, Gongora-Orozco and Kontis
b
).
$Ma=1.32$
(figure 28
b). It is shown in figure 28 that both the shock patterns and vortex structures of our numerical results are in good agreement with the corresponding experimental schlieren images (Zare-Behtash et al.
Reference Zare-Behtash, Kontis, Gongora-Orozco and Takayama2009a
,Reference Zare-Behtash, Gongora-Orozco and Kontis
b
).

Figure 28. Comparison of the experimental and numerical schlieren images of an unsteady elliptic jet with an axis ratio of
 $a/b=0.4$
.
$a/b=0.4$
.

Figure 29. Comparison of the instantaneous flow field of our numerical images (Zhang et al. Reference Zhang, Chen, Guo and Sun2017) with the pseudo-schlieren CT images of Maeno et al. (Reference Maeno, Kaneta, Morioka and Honma2005). (CS, contact surface; EXH, expansion head; PSW, primary shock wave; SS, slip surface; SSW, secondary shock wave; TR, triple ring.)
Figure 29 presents the instantaneous flow structures of a highly under-expanded square jet (Zhang et al.
Reference Zhang, Chen, Guo and Sun2017) with the corresponding experimental results of Maeno et al. (Reference Maeno, Kaneta, Morioka and Honma2005). The jet Mach number and nozzle pressure ratio of our schlieren results are
 $Ma=1.4$
and
$Ma=1.4$
and
 $n=4.4$
, while the incident shock Mach number of the experimental results is
$n=4.4$
, while the incident shock Mach number of the experimental results is
 $Ma=2.2$
. It is obvious that the shock wave structures, contact surface and other shape density fronts on both symmetry and diagonal planes in our computational results agree well with experimental images in Maeno et al. (Reference Maeno, Kaneta, Morioka and Honma2005). Additionally, the 3-D shape of the Mach disc is also in accordance with the experimental images of Maeno et al. (Reference Maeno, Kaneta, Morioka and Honma2005).
$Ma=2.2$
. It is obvious that the shock wave structures, contact surface and other shape density fronts on both symmetry and diagonal planes in our computational results agree well with experimental images in Maeno et al. (Reference Maeno, Kaneta, Morioka and Honma2005). Additionally, the 3-D shape of the Mach disc is also in accordance with the experimental images of Maeno et al. (Reference Maeno, Kaneta, Morioka and Honma2005).