

The electoral system determines the way individual politicians represent constituent preferences.Footnote 1 So far, much of the literature has focused on the differences between majoritarian and proportional representation (PR) systems. It suggests that centripetal forces tend to dominate under majoritarian systems, while centrifugal forces are more relevant under PR systems.Footnote 2 The relative strength of these forces affects the level of congruence between politicians and the median voter of their constituency, as well as the role that party affiliations play in the respective electoral system.
In this article, we empirically identify the differential effects of politicians’ party affiliations in the two electoral systems using a direct measure of congruence. Centrifugal forces, which result in voters selecting off-center politicians and those who pursue their own or party ideology, are expected to play a larger role in PR systems,Footnote 3 and politicians may take positions at variance with the center of the distribution of their geographic constituency. In contrast, centripetal forces can be expected to drive the behavior of representatives in a majoritarian system. Since they have to gain a majority in order to be elected, they deviate from their parties’ ideological positions and move to the center of their district.Footnote 4 We empirically test the hypothesis that politicians’ personal party affiliations are of minor importance when explaining the extent of congruence with the median voter in majoritarian systems compared to politicians from the same parties who are elected in PR systems.
Our empirical test is relevant for political science and public policy for at least two reasons. First, political representatives diverge from the preferences of their geographical constituency in both types of systems.Footnote 5 If congruence with the median voter is higher for politicians elected in a majoritarian system than under PR, this could result from differential party effectsFootnote 6 as well as from the share of politicians from center parties being higher in majoritarian electoral systems. We disentangle the effects by controlling for individual party affiliation, which is only possible in a setting with a common party system – that is, in a rare setting such as ours.
Secondly, rigorous empirical evidence for the above hypothesis is scarce.Footnote 7 Our contribution provides a stringent empirical test to identify the influence of party affiliations on preference representation in majoritarian vs. proportional systems. Such an empirical test has to fulfill at least four requirements. First, it must rely on a direct measure of congruence between the voting behavior of members of parliament (MPs) and the revealed preferences of the majority in their electoral constituencies. Secondly, it needs to include politicians elected under a proportional system and politicians elected under a majoritarian system, but both should be elected in identical districts such that district preferences and prerogatives to be elected are equal. Thirdly, both groups of politicians must decide on identical political issues, which should entail real policy consequences for their constituencies. Fourthly, as parties may mediate the positions of their politicians in majoritarian as well as proportional systems relative to the median voter,Footnote 8 the two groups of politicians have to affiliate with identical political parties despite being elected under different electoral rules. These requirements are almost impossible to fulfill, and we do not know of any other empirical study that does so.Footnote 9 In Switzerland, these requirements are largely met within a single country and a common party system.
Swiss MPs vote on new laws, changes of laws and constitutional amendments like parliamentarians in all democracies around the world. But Swiss direct democracy allows us to directly measure congruence between politicians and voters. The proposals accepted by parliament do not turn directly into law: parliamentary decisions on laws can be challenged by voters demanding a referendum. Constitutional amendments by parliament are subject to a mandatory referendum. Moreover, voters can advance propositions to amend the constitution by demanding a referendum on their proposal. Referenda permit voters in electoral districts to judge different policies with real-life consequences and rank them against the status quo.Footnote 10 Congruence between parliamentarians and the majority of their constituents naturally occurs in our setting if MPs’ decisions are in line with the latter in the corresponding referendum. As the behavior of voters and politicians is compared based on identical legislative proposals, we avoid difficulties that arise when the two are measured using different scales, as is common in the literature.Footnote 11 While the members of the lower house are elected under a proportional system, the members of the upper house are elected under a two-round majority-plurality rule. MPs from the same parties are present in both houses. The electoral districts for both chambers coincide such that politicians in both houses represent identical geographical constituencies. All these conditions allow for a quasi-experimental test of the influence of party affiliations on congruence in different electoral systems. As our research focuses on differences within a single country, we avoid problems common to cross-country research. Our results are politically relevant, as different electoral systems coexist in numerous countriesFootnote 12 and because reforms of electoral systems are frequently discussed.
Our empirical results based on all referenda from 2008 to 2013 are consistent with the literature’s arguments and allow additional insight into the actual representation of constituents’ preferences. First, under a proportional system, MPs of left and right parties deviate significantly more from their constituencies’ preferences than those from the center. Secondly, under a majoritarian system, the individual party affiliations of representative congruence levels are influenced to a significantly lower degree by individual party affiliations. Thirdly, within all parties, politicians elected under the majoritarian system are more closely aligned to the preferences of their geographical constituency than their counterparts from the same parties in the proportionally elected chamber. This is true even when analyzing the congruence of representatives with national voter preferences, and numerous robustness analyses confirm the findings. Our evidence also contributes to the literature’s discussion on the representation of the majority in the respective electoral systems, and allows new insights regarding the aims of proportional versus majoritarian systems.Footnote 13
The remainder of this article is structured as follows. The next section describes our direct measure of congruence between legislators’ behavior in parliament and constituents’ preferences in referenda, and details the identification strategy. Empirical results for the influence of party affiliations from both parliamentary chambers are then presented. The final section concludes.
MEASURING CONSTITUENT PREFERENCES AND IDENTIFICATION
Matching Decisions of Representatives with Constituent Preferences
Two electoral systems – identical constituencies, parties and political decisions
Switzerland’s 1848 federal constitution established a bicameral parliament. Its twenty-six cantons (sub-national jurisdictions) form the national parliament’s electoral districts. The parliament consists of two houses, the National Council (Nationalrat) and the Council of States (Ständerat). The National Council has 200 members who are elected under a PR system in districts from one to up to thirty-four seats, depending on population size. The Council of States has forty-six senators elected in a two-round majority-plurality system in the same districts as the National Council.Footnote 14
For historical reasons, there are twenty full cantons and six half cantons, making a total of twenty-three so-called Stände. The full cantons delegate two representatives to the Council of States, while each of the six half cantons is represented by one member. In two-member districts, voters can cast two votes, which cannot be cumulated. In the first round, successful election requires an absolute majority (for both candidates in two-member districts), whereas a relative majority is sufficient in the second round.Footnote 15 The system is therefore broadly comparable to that of the US Senate. Swiss party structures and decisions are also decentralized. Party sections at the district level traditionally select candidates largely independently of the national party.Footnote 16
Members of the upper and lower houses both serve four-year terms and are simultaneously elected. The formal requirements and prerogatives to be elected in the two houses are identical, apart from the electoral system. As in other countries, mixed systems have the potential for voters to split their votes.Footnote 17 Theoretically, voters may split their ticket and vote for parties in order to pull the overall policy outcome in their desired direction.Footnote 18 But vote splitting may also strengthen centripetal forces in the Swiss Council of States and centrifugal ones in the National Council, as voters may elect a more ideologically minded candidate from the party list. Many other vote-splitting strategies of voters and parties are conceivable. Analyses of split-ticket voting in Switzerland find inconclusive evidence in support of different theories when comparing votes for the two houses, apart from the result that voters tend to defect from their preferred party if it is unlikely to win a seat.Footnote 19
Altogether, we expect the relevant centripetal forces of a majoritarian system and the centrifugal forces of a proportional system to hold in Switzerland: the main characteristics of the Council of States are reasonably close to the particular set of assumptions required for theoretically centripetal forces to come into play. Members of the Council of States have an incentive to move to the electoral center, voters have an incentive to select candidates who represent the center and parties demand less ideological discipline from candidates. The proportional system in the National Council, by contrast, tends to induce representatives to adopt positions that match the position of their party affiliates – and are thus at variance with the center of the distribution of their geographic constituency, such that party affiliations can affect congruence levels to a larger extent.
Both the National Council and the Council of States have identical competences and decide on the same laws and constitutional amendments. The major parties are the Social Democrats (SP – left), Christian Democrats (CVP – center),Footnote 20 Liberals (FDP – center), Swiss People’s Party (SVP – right), as well as smaller parties such as the Greens (left), Green Liberals (center) and Conservative Democratic Party (center-right). Importantly, all of these major parties are present in both houses and can be grouped into common left, center and right party categories. We follow the classification into left, center and right parties that is usually performed in the Swiss context. Of course, we assess the robustness of our results to this classification (see Appendix A1).
The two houses have equal rights and the same weight and power within the legislative process. Each parliamentary proposal has to be approved by majorities in both houses in order to be adopted as a new law or constitutional amendment. Parliament holds four sessions a year. There is a constant exchange of opinions between the members of the two houses, both within and between parties. If the two houses do not agree on a proposal, it passes between them for up to three times with modifications until a joint consensus conference (Einigungskonferenz) with delegates from both houses sets out to design a compromise. If this compromise is not accepted in both houses, the proposal is not adopted.
Final roll-call votes take place at the end of a parliamentary session. The National Council and the Council of States then decide on exactly the same laws and constitutional amendments – usually on the same day. There is no systematic order in the sequence of final roll calls of the two houses – that is, the National Council does not systematically vote before or after the Council of States. Whether the final debate and the final roll call in one house precede the final debate and final roll call in the other house depends on the specific workload of each council. Final roll-call votes are held in the same rooms as all other discussions and votes.Footnote 21
Final roll calls are most proximate to the adoption of governmental policies. While the votes of National Council members are recorded using an electronic voting system, there was no such system in the Council of States at the time of our investigation. Since winter 2006, however, a camera records the council’s sessions such that voting behavior is observable. We have collected and analyzed the video streams and identified the individual voting behavior of members of the Council of States. In a few cases, the video stream’s quality does not allow the identification of all individual votes. We scrutinize these cases in robustness analyses (see Appendix A2). Our collected data based on video streams yield aggregate voting results, which are consistent with the officially published aggregate results of the Council of States.
Members of both chambers of parliament may be absent or abstain from voting due to sickness, travel, political duties, professional bias or other responsibilities, as well as early resignation or death, which reduces the number of observations from a possible 11,808 by approximately 11.4 per cent to 10,460. The president of the Council of States often does not cast a vote, and the scrutineers can usually not be seen on the video footage. In some cases, their decisions can be derived from the aggregate result. We found no systematic relationship between absenteeism and congruence levels, personal characteristics or party affiliations in the data. Nevertheless, we control for abstentions and politicians whose voting behavior is not always discernable from the video streams.
To summarize, our setting allows us to hold party affiliation and constituency preferences constant across two different electoral systems. Therefore, we are able to identify the differential effects of individual party affiliation under PR and majoritarian systems for politicians of identical parties with respect to congruence.
Measuring congruence between representatives and the majority of their constituents
Switzerland features a system of direct democracy in which citizens may challenge parliamentary decisions by referenda. Proposals adopted by parliament do not directly become law. After parliament’s adoption of a new law, citizens can demand a referendum by collecting at least 50,000 signatures out of approximately 4.9 million registered voters within 100 days. Such facultative referenda are a steady threat for legislators, thereby assuring that the potential selection bias of issues can be expected to be low. Any new law or law change proposed by parliament is rejected if 50 per cent of the voters decide against it. Any constitutional amendment by parliament is always subject to a mandatory referendum, which permits us to avoid any potential selection problems for a full category of high-profile legislative issues. Acceptance requires a majority of voters nationwide, as well as a majority of the so-called Stände (11.5 cantons), which means that a majority of voters in 50 per cent of all cantons is required, though some cantons count as half cantons, as described above. Finally, by collecting 100,000 signatures, citizen action groups may initiate a referendum on their own constitutional amendment. Although MPs cannot change the wording of an initiative, they are required to vote on the proposal after the necessary signatures have been successfully collected, but before the popular vote. Their vote serves as a parliamentary recommendation to voters.Footnote 22 Parliament can formulate an alternative amendment to the constitution as a ‘counter-proposal’ to an initiative, which is subject to a popular vote together with the initiative. This institutional setting ensures that none of the referenda being voted upon depends on differences in the bicameral structure or the electoral system.
We analyze the full available sample of forty-eight referenda from 2008 to 2013 covering social, economic, demographic, regional and defense policy issues, among others. Referendum results determine policy outcomes, and reveal citizens’ preferences regarding these outcomes. More precisely, referenda permit constituents to rank policy outcomes induced by the proposed laws against the status quo.Footnote 23
The law or constitutional texts presented to the voters in the referendum are identical to the proposals on which MPs decided in their roll-call votes. Thus we obtain a natural measure of representation of a constituency’s preferences by matching MPs’ roll-call votes with referendum results from their electoral districts: either an MP matches the majority decision of her constituents or she does not.Footnote 24 Thematically different contributions discuss potential selection effects and how this congruence measure generalizes.Footnote 25 This congruence measure and our dataset have also been used to analyze congruence and interest group influence for politicians elected under a PR system.Footnote 26
A controversy surrounding electoral systems and voter congruence has attracted much attention over the last few years. The debate focuses on the potential merits of each system regarding ideological congruence.Footnote 27 The general consensus is that there is a greater dispersion of parties across the policy space in PR than in majoritarian systems. However, the debate focuses more on overall legislative or government congruence than on the effects of party affiliation. Our measure of congruence corresponds to a many-to-one relationship,Footnote 28 as individual legislators from both houses are compared with their specific geographical constituency. With this measure we empirically contribute two additional aspects to the ideological congruence controversy. First, we can analyze the congruence of individual politicians under majoritarian and PR systems. Secondly, we examine how individual party affiliations differently affect congruence in the two systems.Footnote 29
Our measure of congruence obtains external validity, as representatives do not know in advance what their constituency wants: they must use standard methods to predict constituents’ preferences when voting in parliament.Footnote 30 This makes the setting comparable to the situation in representative democracies. However, we recognize that we cannot provide direct evidence of the generalizability of results for other countries or issues that are not subject to a referendum. Nevertheless, similar to the literature described above, we expect inferences based on this measure and our quasi-experimental setting to be reliable and to provide further insights into the workings of democracies and the factors influencing political representation.
Identification Strategy
We test for differential effects of personal party affiliations on congruence in PR and majoritarian systems. Our observed congruence measure directly identifies whether MPs from both chambers match the preferences of their geographical constituency. Thus we employ an indicator variable, MP=Constituents, as our dependent variable. The indicator takes a value of 1 if an MP votes in line with the majority of her/his constituency in the respective referendum, and 0 otherwise. The electoral system itself is exogenous to the congruence levels of individual politicians and their personal party affiliations.
The fact that the same parties are represented in both the National Council and the Council of States allows us to identify the differential effects of personal party affiliations. Left, center and right party affiliations make up 30.3 per cent, 42.2 per cent and 27.6 per cent of the total number of observations, respectively (see Appendix A3). Center party affiliation is, on average, 1.524 times more common in the Council of States than in the National Council, while left and right party affiliation is more prevalent in the proportionally elected National Council. Such an observation tends to be in line with classical theory,Footnote 31 even though there are more than two parties competing for the Council of States. It is, however, of no consequence for our empirical identification strategy as we observe individual politicians form left, center and right parties in both chambers. Therefore, our setting not only allows us to compare the overall extent of centripetal and centrifugal forces in proportional versus majoritarian systems. We can also empirically investigate whether individual MPs from the same parties represent their geographical constituency differently when elected under different electoral systems, and whether proportionally elected politicians are more at variance with the median voter. Additionally, our setting allows us to determine whether different levels of congruence with the majority of constituents emerge because more politicians from center parties are present in the majoritarian chamber or because majority-elected politicians in general, independently of their party affiliation, are more strongly oriented toward the median voter than politicians from left, center and right parties elected in a PR system.
We use the following logistic specification to estimate the effects of party affiliation on representation in the two electoral systems within a single framework:
 $$\eqalignno{ P(MP\,{\equals}\,Constituents)\,{\equals}\, & \Lambda (\alpha (Member\,Council\,of\,States) \cr & {\plus}\beta _{1} (Left\,Party){\plus}\beta _{2} (Right\,Party) \cr & {\plus}\gamma _{1} (Member\,Council\,of\,States \,\ast\, Left\,Party) \cr & {\plus}\gamma _{2} (Member\,Council\,of\,States \,\ast\, Right\,Party) \cr & {\plus}\mathop{\sum}\limits_j {\delta _{j} x_{j} } ) $$
Λ denotes the logistic function Λ(X)=e X /(1+e X ) (X is a design matrix).
Member Council of States is a binary variable indicating whether a representative belongs to the Council of States instead of the National Council. α captures the difference in congruence for members (from center parties) of the National Council and the Council of States. We expect α>0 if MPs (from center parties) elected under a majoritarian system are more congruent with their constituents’ preferences than when elected under a proportional system. β 1 and β 2 indicate the influence of left and right party affiliation within the proportionally elected National Council, that is, when the variable Member Council of States is 0. Center party affiliation forms the omitted category. We expect β 1, β 2≠0, more specifically, β 1<0, β 2<0, if party affiliation matters for congruence under a proportional electoral system and if left or right party affiliations induce lower congruence levels – that is, if proportionality induces politicians to take positions that are at variance with the median. The coefficients for the bare interaction terms γ 1 and γ 2 measure the differential effect of left and right party affiliations under a proportional compared to a majoritarian system, that is, when Member Council of States equals 1. Party affiliations are expected to play a less important role for politicians elected under a majoritarian system compared to a proportional system. Thus, we expect γ 1>0, γ 2>0 (that is, they have the opposite sign than β 1, β 2).
The total effects of party affiliation under a majoritarian system are given by β 1+γ 1 for left party affiliation and β 2+γ 2 for right party affiliation with respect to center party affiliation. If β 1<0, β 2<0 and γ 1>0, γ 2>0 then the total effects of party affiliations are lower under a majoritarian than a proportional system. If parties play no role in a majoritarian system, then β 1+γ 1=0 and β 2+γ 2=0, which would indicate that majority-elected politicians from left or right parties do not represent the majority of constituents differently than those from center parties; this would indicate a Downsian convergence with respect to positions. In practice, party affiliations may still have some influence in a majoritarian system, as the politicians have some leeway and may not converge fully on the district median. We expect that party affiliations will at least matter to a lesser extent in a majoritarian system. Indeed, we will show that all theoretical predictions hold true, such that individual party affiliations matter strongly in a proportional system (β 1, β 2≠0) but to a lesser extent in a majoritarian system (γ 1>0, γ 2>0), and that majority-elected politicians more closely represent their constituents’ preferences (α>0).
The x j indicates control variables and fixed effects. While we do not expect that other factors influence congruence through individual party affiliations, we introduce characteristics of politicians, referenda and districts as further controls in robustness tests. Appendix Table A3 offers descriptive statistics on all variables.
EMPIRICAL ANALYSIS
Baseline Results
Table 1 groups individual MPs according to their party affiliation from left to right for the National Council (proportional system) and the Council of States (majoritarian system), and shows average congruence levels for the respective electoral systems. It provides the central motivation and main results of our article in a descriptive way.
Table 1 Congruence between Politicians and Constituents according to Party Affiliation and Electoral System

Note: The table presents congruence between politicians and constituents – that is, the probability that a politician’s decision in parliament matches the constituents’ decisions in the corresponding referendum. Congruence by party affiliation and council is given for 352 distinct members of the proportionally elected National Council and eighty-four distinct members of the majority elected Council of States. t-values in parenthesis. * Significance level at 5%–10%. ** Significance level at 1%–5%. *** Significance level at <1%.
Sources: Swiss Federal Statistical Office for referenda data; Swiss Official Bulletin video footage for individual senators’ voting records.
We make three observations that are all consistent with the literature and the above-stated theoretical considerations. First, congruence levels for the proportionally elected National Councilors from left (59.0 per cent) and right (57.0 per cent) parties are significantly lower than those for proportionally elected politicians from center parties (69.3 per cent). Politicians from the left and right deviate from their constituency’s preferences by 10.3 percentage points and 12.2 percentage points, respectively, significantly more than politicians from the center.Footnote 32
Secondly, for the majority-elected Council of States, we also observe differences in congruence between members of different parties (67.2 per cent, 72.5 per cent and 66.1 per cent for left, center and right parties, respectively). However, the differences from left to center and right to center are only 5.2 and 6.4 percentage points, respectively. More importantly, the differences-in-differences presented in the third row are statistically significant – that is, the difference from left (right) to center in the upper house compared to the difference from left (right) to center in the lower house amounts to a politically relevant 5.0 percentage points (5.9 percentage points), and is statistically significant. The influence of party affiliations for majority-elected politicians is approximately half as high as for proportionally elected politicians. Thus, party affiliations matter strongly for representation in a proportional system, while they play a relatively less important role in a majoritarian system with respect to the representation of the geographical constituency’s preferences.
Thirdly, average individual congruence with the constituency’s preferences is lower for all members of the National Council (62.3 per cent) than for members of the Council of States (70.3 per cent). On average, majority-elected legislators more closely match the preferences of the majority of their constituents. Consistent with the literature on congruence,Footnote 33 legislators diverge from constituents’ preferences and full convergence is not observed. However, the level of congruence is relatively higher for politicians elected in a majoritarian system than for those elected in a PR system, independently of their party affiliation. Thus we observe higher congruence not only due to a higher number of center party politicians in the upper house. Representatives of left, center and right parties in the proportionally elected chamber have lower congruence levels than their counterparts from the same parties in the majoritarian chamber.
Table 2 addresses the differential influence of individual party affiliations in different electoral systems on representation of the majority’s preferences econometrically. First, we estimate the influence of party affiliation in separate samples for the National Council and the Council of States in Specifications 1 and 2. We then estimate the interaction model outlined above in Specifications 3 and 4. Our specifications always include fixed effects for referendum types and an intercept.Footnote 34
Table 2 Influence of Party Affiliation on Congruence between Politicians and Constituents under Proportional and Majoritarian Systems
Note: The dependent variable is congruence between politicians and the constituent majority. * Significance level at 5%–10%. ** Significance level at 1%–5%. *** Significance level at <1%. Center party affiliation forms the omitted category. Robust clustered standard error estimates are given in parentheses below the coefficient. ‘Discrete effects’ denote the change in the probability of congruence if the respective independent variable changes from 0 to 1 while all other variables are held constant at their median values.
Specification 1 focuses on members of the National Council. National Councilors from left and right parties represent their constituents’ preferences significantly differently than members from center parties. Party affiliation plays a significant role in explaining whether the decisions of individual representatives match those of the majority of their constituents in a proportional system. Members from left and right parties deviate more from the preferences of the majority of their constituents than members from center parties. There is no significant difference between left and right party affiliation on congruence. However, in a majoritarian system party affiliations tend to exert a lesser effect on representation of the majority’s preferences. This is confirmed in Specification 2. Members of the Council of States with left or right party affiliations still deviate more from their constituents than majority-elected politicians with center party affiliations, yet the coefficients are smaller than in Specification 1. We will next test whether the coefficients are also statistically significantly different.
Specification 3 reports the results of an interaction model that combines data from both houses. We introduce an identifier of the Council of States. The majority-elected members of the Council of States from center parties tend to correspond more to the majority’s preferences than proportionally elected politicians from center politics, that is, α>0. We interact party affiliation with the identifier for the Member Council of States.Footnote 35 The coefficients for the non-interacted party affiliation variables (β 1, β 2) reflect the base effect of different party affiliations for members of the PR-based National Council. Corresponding to theoretical predictions, we observe that members of the National Council from left and right parties represent their geographical constituency differently than members from center parties, as both coefficients are significantly different from 0, β 1, β 2≠0. The negative signs (β 1<0, β 2<0) indicate that they match the majority less often because they pander specifically to citizens with off-center or even extreme preferences. Thus under a proportional system, we observe a differential influence of party affiliations on representation by individual members of the National Council. Statistically significant and positive coefficients for the interaction terms (γ 1>0, γ 2>0) indicate that the influence of party affiliations is lower for majority-elected politicians – that is, party affiliations play a less important role in majoritarian than in PR systems. Specification 4 presents a linear probability model and shows that our logit regressions do not suffer from the incidental parameter problem.
Figure 1 presents a summary of all discrete effects expressed as percentage point changes calculated from Table 2, Column 3. Panel A depicts the influence of party affiliation on congruence in the two electoral systems. Panel B reports the effect on congruence of changing from a proportional system to a majoritarian system (holding individual party affiliation constant), thus comparing congruence levels between majority- and proportionally elected representatives from the same parties.
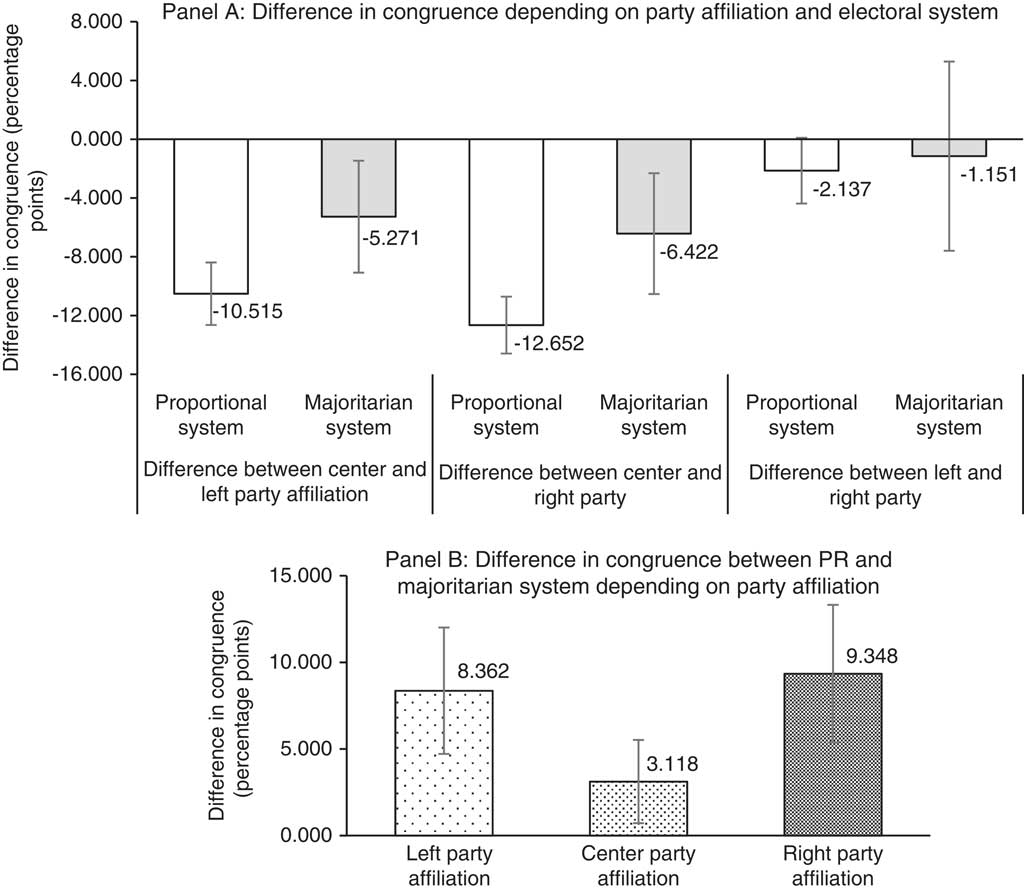
Fig. 1 Predicted changes in congruence levels for different party affiliations and different electoral systems Note: Panel A represents predicted changes in congruence levels for changes in the party affiliations of individual representatives depending on the electoral system. Panel B represents predicted changes in congruence levels for changes from a proportional system to a majoritarian system, depending on party affiliation. All reported changes in congruence for individual representatives are predictions based on coefficients of Table 2 (Model 3) and are expressed in percentage points. Error bars represent 10 per cent confidence intervals for the prediction.
All evidence is supportive of traditional theory. First, parties matter in PR systems, as changing from center to left or right party affiliation has a negative and significant effect on congruence, respectively. Within the proportional chamber, representatives with left party affiliation have 10.5-percentage-point lower congruence levels than those from center parties, right politicians have 12.7-percentage-point lower congruence levels than center politicians, and left and right politicians are not statistically different.
Secondly, party affiliation has systematically smaller effects in a majoritarian system. Changing from center to left decreases congruence by only 5.3 percentage points, or roughly half of the effect found for proportionally elected politicians. Similarly, changing from center to right party affiliation decreases congruence by 6.4 percentage points, which is also roughly half the effect found in PR systems.
Thirdly, within party blocks, majority-elected politicians have systematically higher levels of congruence than their party counterparts elected in a PR system, as shown in Panel B. Majority-elected representatives from left parties have 8.4-percentage-point higher congruence levels than proportionally elected representatives from right parties, majority-elected representatives from center parties have 3.1-percentage-point higher congruence levels than proportionally elected representatives from center parties, and majority-elected representatives from right parties have 9.3-percentage-point higher congruence levels than proportionally elected representatives from right parties. All these effects are statistically significant and politically relevant.Footnote 36
Although we focus on the congruence of individual politicians, our baseline results also contribute to the controversial debate on ideological congruence. The proportional vision of democracy is to represent many different groups, while the majoritarian vision is that politicians respond to the majority of the voters.Footnote 37 For our direct measure of congruence, we observe that the majority of constituents is more closely represented by individual politicians elected under a majoritarian system, irrespective of their party affiliation. Party affiliation more strongly affects congruence for proportionally elected politicians. This is consistent with the view that they represent different groups across the electoral spectrum – including, most probably, their partisan voters.
Robustness and Refinements
Robustness: characteristics of politicians, parties, districts and referendums
Table 3 reports a number of robustness tests. To directly and intuitively evaluate the quantitative effects in percentage points, the table presents discrete effects. Discrete effects for β 1 and β 2 indicate, for National Councilors, the effect of a change in party affiliation from center to either left or right on the probability of matching the majority’s preferences. The discrete effect for γ 1 (γ 2) represents the differential effect on the probability of matching the majority of congruence for a left (right) party politician in the Council of States compared to a left (right) party politician in the National Council. Finally, we also present the total effect of left and right party affiliation in a majoritarian system β 1+γ 1 and β 2+γ 2 at the bottom of the table. Discrete effects are calculated using the delta method, and take robust clustered standard errors into account.
Table 3 Robustness – Influence of Party Affiliation on Congruence under Proportional and Majoritarian Systems
Note: The dependent variable is congruence between politicians and the constituent majority. * Significance level at 5%–10%. ** Significance level at 1%–5%. *** Significance level at <1%. Center party affiliation forms the omitted category. Logit models are estimated and logit coefficients are presented in Appendix A4. We present discrete effects that denote the change in the probability of congruence if the respective independent variable changes from 0 to 1 while all other variables are held constant at their median values. The discrete effect of the interaction terms represent the differential effect on the probability of congruence of left and right party politicians in the Council of States in comparison to a left party politician in the National Council.
In Specification 1 we include two control variables that account for the frequency of Council of States members’ rare non-observability in the video streams as well as for the average frequency of abstention due to sickness or other reasons. The first variable ensures that our results are not biased due to the small number of politicians who are, in a few instances, not observable on the video stream, while the second variable takes account of potentially systematic abstentions.
Our results remain robust: the probability that proportionally elected National Councilors from center parties correspond to the majority of their constituents’ preferences is 10.6 and 12.9 percentage points higher than for members of left and right parties, respectively. Left and right party affiliations exert a significantly lower influence on politicians elected in a majoritarian system compared to a proportional system, with magnitudes corresponding to 5.6 percentage points and 7.1 percentage points, respectively. Party affiliation has some remaining influence for a majoritarian system, as left (right) party politicians in the Council of States have a 5.6-percentage-point (5.5-percentage-point) lower probability of corresponding to the preferences of the median in their district than center party politicians. Specification 2 excludes members of the Council of States who are not frequently observable, which slightly reduces the size of the dataset but does not affect the results.
The above-employed classification of parties into groups of left, center and right is in line with expert opinions as well as parties’ self-declarations. However, for robustness checks we present a reclassification of parties solely based on NOMINATE scores for the National Council, which are produced by the Swiss Sotomo institute and published on an annual base.Footnote 38 The results in Column 3 show that this reclassification does not change the qualitative or quantitative effects to a relevant degree. Specification 4 goes a step further and represents a subsample in which we only include observations of politicians whose parties are in both houses. A number of small parties are only present in the National Council; excluding these politicians does not affect our results, which remain entirely robust.
A growing literature shows the importance of a politician’s personality for political outcomes and behavior.Footnote 39 We therefore control for a politician’s gender, age, family situation, education, identification with constituency and time in office in Specification 5. These additional controls do not influence the existing and significant effect of party affiliation in a proportional system, β 1≠0 and β 2≠0. Similarly, we observe that party affiliation plays a less important role in majoritarian systems, as γ 1>0, γ 2>0. Majority-elected politicians from all parties have higher congruence levels than their proportionally elected counterparts from the same parties. These results are also robust to the magnitudes of the discrete effects.
Specification 6 takes into account constituency fixed effects to capture social, cultural, economic and other potential differences between constituencies that might influence congruence either directly or indirectly through the selection of politicians and support for parties. This test ensures that the identified differences between the electoral systems are not driven by districts that are ideologically skewed or have different numbers of competing candidates or districts with different magnitudes, etc. Again, all results remain robust for each electoral system, with respect to statistical significance and the magnitude of the effect. Thus, independent of differences between electoral districts and the selection strategies used by constituents, party affiliations matter to a lesser extent for congruence when politicians are elected in a majoritarian rather than a proportional system. Moreover, majority-elected politicians have higher congruence levels independent of their party affiliation.
Polarization, the salience of legislative topics and popularity vary across Swiss referenda and may be advanced by certain party groups. By employing referendum-specific fixed effects in Specification 7, we ensure that the effects identified for differences in congruence are only due to differences in the electoral system. The central differential effects of individual party affiliation on congruence induced by the electoral systems remain entirely robust.
In the same vein, Appendix Table A5 provides further robustness analyses for a relevant choice of different subsamples as well as different weighting strategies to take into account competing interests and polarization in parliament or in the respective referendum. Again, all results remain robust.
Refinements: national voters, district size, loyalty and parties
In Tables 4 and 5, we provide refinements and differential tests for the literature’s hypotheses regarding electoral systems and congruence. So far, our measure of congruence compares the revealed will of the district majority with individual politicians’ decisions. Thus, it tends to correspond to the majoritarian concept of representation.Footnote 40 Our evidence so far shows that party affiliations affect this measure of congruence, which supports the interpretation that in a proportional system, parties demand more discipline and politicians represent citizens who are ideologically off-center. Moreover, majority-elected politicians more closely represent the district majority.
Table 4 Refinement – Congruence with National Voters, District Sizes and Party Loyalty
Note: Center party affiliation forms the omitted category. * Significance level at 5%–10%. ** Significance level at 1%–5%. *** Significance level at <1%. Logit models are estimated and logit coefficients are presented in Appendix A6. We present discrete effects that denote the change in the probability of congruence if the respective independent variable changes from 0 to 1 while all other variables are held constant at their median values. The discrete effect of the interaction terms represents the differential effect on the probability of congruence of left and right party politicians in the Council of States in comparison to a left party politician in the National Council.
Table 5 Refinements – Controlling for Political Parties
Note: The dependent variable is congruence between politicians and the constituent majority. The SVP forms the omitted category and abbreviations for parties are explained in the Appendix A3. Logit models are estimated and logit coefficients are presented in Appendix A7. We present discrete effects that denote the change in the probability of congruence if the respective independent variable changes from 0 to 1 while all other variables are held constant at their median values. * Significance level at 5%–10%. ** Significance level at 1%–5%. *** Significance level at <1%.
We can take the analysis one step further and change the congruence measure to focus on the national electorate. Although all Swiss MPs are elected in subnational districts, the national electorate might be considered the most important constituency in a collective view of representation. Since we know the revealed preferences of the national electorate as a whole (that is, how the national majority voted), we can analyze whether individual politicians match those preferences more closely when elected in a majoritarian instead of a proportional system. By construction and by data availability, this type of congruence measure is still majoritarian but with a broader spectrum of voters. Specifications 1 and 2 in Table 4 show that all our previous results still hold, and that parties become even more relevant for representation in a proportional system. Proportionally elected politicians of left (right) parties have 17.8-percentage-point (16.8-percentage-point) lower congruence levels than those from the center. Party affiliations play a significantly smaller role for majority-elected politicians. Thus there are clear and substantial differences in representation between proportional and majoritarian systems. As government in Switzerland consists of representatives from left, center and right parties, our results tend to be in line with previous studies that suggest proportional representation does not necessarily produce more consistent representation at the governmental level.Footnote 41 In any case, when looking at congruence with the national majority and our empirical results, politicians elected in a proportional system tend to be at even greater variance with the national median than with their district median voter.
Specifications 3 to 5 refine the analysis in another direction. The twenty-six Swiss electoral districts differ in population size, and proportionality in the lower house differs from one to thirty-four seats. Thus district magnitudes are different, and these differences can be exploited.Footnote 42 For small districts with two seats or less, the main centripetal forces of a majoritarian system should be at play – that is, we should not observe significant differences in levels of congruence for politicians of different parties, even when politicians are elected in a proportional system compared to majority-elected politicians, as long as district magnitude is sufficiently low. This is what we tend to find in Specification 3 for a small sample of observations. All coefficients are insignificant, such that from a purely statistical point of view, there are no differences between left, center and right party affiliations in proportional and majoritarian systems.Footnote 43 When analyzing larger districts in Specification 4, we directly revert to our main results: party affiliations matter more in proportional than in majoritarian systems. In Specification 5 we analyze congruence around the ‘sweet spot’,Footnote 44 which is districts with four to nine seats. For this subsample we still observe that parties play a significant role in a proportional system. The interaction terms are again relatively large, indicating that parties play a smaller role in a majoritarian system and that we cannot even reject the hypothesis that parties play no role at all for majority-elected politicians. Thus, Specifications 3 to 5 support the view that as soon as districts are large enough (essentially larger than two), parties systematically start to affect how individual politicians represent the majority of their constituents.
In a final refinement, we look at party discipline. For essentially all referenda, parties offer voting recommendations. We analyze whether politicians vote according to their party’s recommendations. This allows us to evaluate whether proportionally or majority-elected politicians tend to follow the party line more often, which is in turn an indicator of the power that parties (and potentially partisan voters) levy. We would expect politicians elected in a majoritarian system to be less likely to follow their party line, as they need to appease their district median and their party demands less discipline from them. The negative and significant discrete effect in Specification 6 shows that this indeed applies over the whole sample. Specification 7 analyzes a full interaction model with this new dependent variable. Under proportional representation, left politicians are more congruent with their party than center politicians, who are, in turn, more congruent than right politicians. Importantly, the interaction terms are always negative, such that majority-elected politicians from left and right parties are less congruent with their party than their proportionally elected counterparts. For center politicians, we do not find significant differences between majority-elected and proportionally elected politicians. This evidence is broadly consistent with the view that party discipline is lower in majoritarian than proportional systems.
In Table 5, we present the results for individual parties instead of three aggregated party blocs. Specification 1 indicates that party affiliation plays a significant role in congruence for individual National Councilors, while Specification 2 shows that they play no significant role for majority-elected members of the Council of States. We only include large parties; the right-wing SVP party and smaller parties form the ‘omitted’ category. Proportionally elected members from the CVP also match their constituency better than members of other parties, including the FDP and the left SP. SP members do not show statistically significant levels of congruence compared to members from the right SVP and other smaller parties.
In Specifications 3 and 4 we employ a separate indicator for smaller parties (approximately 16.7 per cent of the total sample). Our main results do not change. We observe that party affiliation has a significant effect in a proportional system, but has no significant effect (and coefficients generally relatively close to 0) in a majoritarian system. Finally, we split up all smaller parties and control for them separately, keeping in mind that the remaining smaller parties have few (or even only one) member in the National Council and are not present in the Council of States. Again, our main message remains robust, as evidenced in Specifications 5 and 6. Thus the effects are not only due to a single party and there is heterogeneity between parties. In other words, personal party affiliation systematically influences the representation of a constituency’s preferences in a proportional electoral system, but there is no discernible differential effect in a majoritarian system on how politicians represent their constituency’s preferences.
CONCLUSIONS
Summary
While party affiliation can be expected to affect levels of congruence in PR systems, it should do so to a lesser extent in majoritarian systems. This is because, independently of their party affiliation, majority-elected politicians need to appease the majority of their constituents to increase their election prospects. They also tend to be selected from the center, and parties demand less discipline from them. Thus centripetal forces are expected to be stronger for majority-elected politicians. In a PR electoral system, politicians usually represent a specific portion of the electoral spectrum, get elected even if they hold less moderate positions and are more dependent on their respective parties.Footnote 45 Thus they may take positions that are at variance with the center of the distribution of their geographic constituency.
We provide empirical evidence confirming these theoretical predictions. The data employed fulfill central requirements for a thorough test of the influence of party affiliation on the representation of constituents’ preferences. First, we draw on the fact that constituents in Switzerland regularly reveal their preferences for legislative proposals in referenda. MPs vote on exactly the same legislative proposals that constituents vote on in referenda. Thus, by matching MPs’ roll-call votes with district referendum results, we can directly determine how politicians represent their geographical constituency. Secondly, the Swiss Parliament has two houses, one elected in a PR system and the other by majority rule. The electoral districts are the same for members of both houses and the prerogatives to be elected are equal, too. Consequently, we can observe politicians from two different electoral systems who represent the same constituencies. Thirdly, members of both houses as well as voters decide on identical legislative proposals. Finally, and most importantly, MPs from identical political parties and districts are present in both houses such that we can compare politicians from the same parties who are elected in different electoral systems.
The setting allows us to provide direct evidence that MPs’ individual party affiliations exert a statistically significant and politically relevant influence on congruence if politicians are elected in a proportional system. The influence of party affiliations is, however, significantly smaller for majority-elected politicians, which supports the view that centripetal forces are far stronger under that system. Thus, the results indicate that a change from a majoritarian system to a proportional system, holding party positions and constituents’ preferences constant, induces politicians’ party affiliations to exert a differential impact on congruence with their constituency’s preferences. We also show that, independent of individual party affiliations, MPs elected in a majoritarian system have higher levels of congruence with the majority of their constituents than those elected in a proportional system, again pointing to relevant differences in representation between electoral systems. Numerous robustness tests and further refinements also confirm and substantiate these findings.
Policy Consequences
Our results show that even politicians elected under majority rule may diverge from the preferences of the majority of their constituents, but their party affiliations play a systematically less important role for representation than for politicians elected in a proportional system. Politicians from left, center and right parties elected in a majoritarian system have higher levels of congruence with the majorities of their geographic districts than proportionally elected politicians. The results also support the view that party discipline is less binding for majority-elected politicians than for proportionally elected representatives. Thus, changing from a majoritarian system to a more proportional one for a given level of party leadership strength makes party discipline more binding, even if the level of party leadership strength remains constant.
Moreover, our evidence contributes to the interpretation of other empirical studies on congruence: while a large literature suggests that PR may facilitate better representation,Footnote 46 recent empirical studies argue that there is no consistent difference between proportional and majoritarian systems.Footnote 47 The majoritarian vision of democracy seeks to gain congruence with the majority of constituents, while the consensus vision of democracy instead focuses on congruence with the distribution of citizen preferences.Footnote 48 Using a natural measure of congruence from a majoritarian view, we highlight that an important difference between the two electoral systems concerns the way representatives’ individual party affiliations affect congruence. If the aim of political representation is to foster congruence with the majority of voters, then a majoritarian system is associated with systematically higher levels of congruence of individual politicians than a proportional system.


