Adverse experiences in childhood can influence individuals’ affective development. Indeed, early life stress (ELS) has been associated with various forms of emotion dysregulation (reviewed in Koss & Gunnar, Reference Koss and Gunnar2018; Raymond, Marin, Majeur, & Lupien, Reference Raymond, Marin, Majeur and Lupien2018)—affective experience and/or expression that hinders adaptive, goal-directed behavior (Beauchaine, Reference Beauchaine2015; Beauchaine & Gatze-Kopp, Reference Beauchaine and Gatzke-Kopp2012). It is not surprising, therefore, that ELS is a risk factor for the development of depression, a disorder characterized by emotion dysregulation, in adolescence (McLaughlin et al., Reference McLaughlin, Green, Gruber, Sampson, Zaslavsky and Kessler2012) and into adulthood (Green et al., Reference Green, Mclaughlin, Berglund, Gruber, Sampson, Zaslavsky and Kessler2010). A growing body of interdisciplinary research is investigating the ways in which ELS influences brain circuits implicated in the control of the hypothalamic–pituitary–adrenal (HPA) axis and in the generation and regulation of affect (reviewed in Lupien, McEwen, Gunnar, & Heim, Reference Lupien, McEwen, Gunnar, Heim and Pfaff2009). It is clear from this research that a deeper understanding of ELS, emotion dysregulation, and risk for depression will require integration among different levels of analysis (e.g., genetic, endocrine, and neurobiological; Adrian, Zeman, & Veits, Reference Adrian, Zeman and Veits2011; Beauchaine, Reference Beauchaine2015; Doom & Gunnar, Reference Doom and Gunnar2013). Moreover, given that the pubertal transition is characterized by both neuroendocrinological recalibration (DePasquale, Donzella, & Gunnar, Reference DePasquale, Donzella and Gunnarin press; Quevedo, Johnson, Loman, Lafavor, & Gunnar, Reference Quevedo, Johnson, Loman, Lafavor and Gunnar2012) and an increased incidence of depressive symptoms (reviewed in Kessler, Reference Kessler2003), focusing on neurobiological and endocrine systems during the pubertal transition should help to elucidate ELS-related processes involved in emotion dysregulation. In the current study, we examined in early pubertal youth the associations among childhood stress exposure, HPA axis responses to social stress, and white matter microstructure of frontolimbic tracts that support emotion regulation. We also investigated whether and how individual differences at these levels of analysis in early puberty predict symptoms of depression in later puberty. In discussing our findings, we advance future directions focused on neurobiological mediation and moderation of the impact of ELS on emotion dysregulation and the development of psychopathology in large-scale samples.
Dysregulation of the HPA axis has been posited to be one mechanism that underlies the effects of ELS on emotion dysregulation broadly (reviewed in Doom & Gunnar, Reference Doom and Gunnar2013; Messman-Moore & Bhuptani, Reference Messman-Moore and Bhuptani2017; Palacios-Barrios & Hanson, Reference Palacios-Barrios and Hanson2019) and depression specifically (reviewed in Koss & Gunnar, Reference Koss and Gunnar2018; Raymond et al., Reference Raymond, Marin, Majeur and Lupien2018). The HPA axis coordinates hormonal stress responses, including the production of cortisol needed for energy mobilization (McEwen, Reference McEwen1998). Whereas activation of the HPA axis is normative in response to acute stressors, chronic or severe ELS has been associated with deviations in stress cortisol production that are likely dependent on developmental stage. For example, in a study of children ages 6 to 12 years, those with higher parent-reported life stress exhibited reduced cortisol levels in a lab-based assessment. Lower socioeconomic status in this sample was also associated with reduced cortisol production, but only in the older children, highlighting the importance of considering pubertal status in this research (Ursache, Noble, & Blair, Reference Ursache, Noble and Blair2015). In another study of 9- to 12-year-old youth, history of childhood maltreatment was associated with decreased cortisol reactivity to a lab-based social stressor (Trickett, Gordis, Peckins, & Susman, Reference Trickett, Gordis, Peckins and Susman2014). A recent meta-analysis indicated that higher ELS was related to reduced cortisol responses to stressors across development (Bunea, Szentágotai-Tǎtar, & Miu, Reference Bunea, Szentágotai-Tǎtar and Miu2017). ELS-related aberrant cortisol regulation, in turn, has been associated with emotion dysregulation in youth, including elevated negative affect and social withdrawal (e.g., Alink, Cicchetti, Kim, & Rogosch, Reference Alink, Cicchetti, Kim and Rogosch2012; Cicchetti, Rogosch, Gunnar, & Toth, Reference Cicchetti, Rogosch, Gunnar and Toth2010). The decreased cortisol pattern linked to ELS parallels findings in adolescents with higher depressive symptoms (e.g., Morris, Kouros, Meilock, & Rao, Reference Morris, Kouros, Mielock and Rao2017). Harkness, Stewart, and Wynne-Edwards (Reference Harkness, Stewart and Wynne-Edwards2011) reported that a history of maltreatment interacted with subsequent high levels of depressive symptoms to predict decreased cortisol responses to a psychosocial stressor in adolescents. The evidence is not fully consistent, however, and several studies reported elevated stress cortisol production as a function of ELS and depressive symptoms (e.g., Rao, Hammen, Ortiz, Chen, & Poland, Reference Rao, Hammen, Ortiz, Chen and Poland2008). Given the mixed literature, further research is needed examining the associations among ELS, stress cortisol, and depression (reviewed in Koss & Gunnar, Reference Koss and Gunnar2018). Our research group recently examined the diurnal cortisol awakening response (CAR), postulated to be an index of diurnal cortisol reactivity (Powell & Schlotz, Reference Powell and Schlotz2012). We found that whereas in later puberty, higher ELS was associated with a heightened CAR, in earlier puberty, higher ELS was associated with a reduced CAR (King et al., Reference King, Colich, LeMoult, Humphreys, Ordaz, Price and Gotlib2017).
In the context of understanding the pathways through which ELS and stress cortisol influence risk for disorders characterized by emotion dysregulation, such as depression, integrating a brain circuit level of analysis may yield additional insight, particularly during the period of adolescence that is a window of development notable for neuroendocrine changes, brain circuit maturation, and the formation of adaptive emotion regulatory behaviors (Dahl, Reference Dahl2001; Furhmann, Knoll, & Blakemore, Reference Fuhrmann, Knoll and Blakemore2015). According to the life cycle model of stress formulated by Lupien et al. (Reference Lupien, McEwen, Gunnar, Heim and Pfaff2009), different disorders emerge in an individual as a function of stress timing; therefore, we expect that the ways in which ELS influences HPA axis function and the brain circuits that support cortisol and affective regulation are distinct during the pubertal transition, compared to other developmental stages. Indeed, the hippocampus, prefrontal cortex, and amygdala contain glucocorticoid receptors that modulate ongoing HPA axis activation (reviewed in McEwen & Milner, Reference McEwen and Milner2007; Raymond et al., Reference Raymond, Marin, Majeur and Lupien2018).
One influential theory postulates that chronic activation of the HPA axis involving sustained cortisol release, such as in response to ELS, ultimately serves to downregulate HPA axis activity through neuroendocrine feedback loops (Fries, Hesse, Hellhammer, & Hellhammer, Reference Fries, Hesse, Hellhammer and Hellhammer2005; McEwen, Reference McEwen1998). Several studies have assessed the relation of ELS to morphological structure, including regional gray matter volumes and white matter connections of the hippocampus, prefrontal cortex, and amygdala (e.g., Dannlowski et al., Reference Dannlowski, Stuhrmann, Beutelmann, Zwanzger, Lenzen, Grotegerd and Kugel2012; Hanson et al., Reference Hanson, Adluru, Chung, Alexander, Davidson and Pollak2013; Hanson, Knodt, Brigidu, & Hariri, Reference Hanson, Knodt, Brigidi and Hariri2015; Hanson, Nacewicz, et al., Reference Hanson, Nacewicz, Sutterer, Cayo, Schaefer, Rudolph and Davidson2015). In this context, most investigators have used an extreme-groups design and have found that youth with significant maltreatment exhibit smaller hippocampal and prefrontal cortex volumes and reduced fractional anisotropy (FA), a proxy of white matter integrity, in frontolimbic tracts such as the uncinate fasciculus (UF), relative to youth without maltreatment (reviewed in Teicher, Samson, Anderson, & Ohashi, Reference Teicher, Samson, Anderson and Ohashi2016). As the major white matter tract that connects the amygdala to prefrontal cortex, the UF is implicated in stress responding (Olson, Von der Heide, Alm, & Vyas, Reference Olson, Von der Heide, Alm and Vyas2015). Moreover, the UF undergoes protracted maturation into adulthood and, thus, may be particularly susceptible to the neurobiological effects of ELS, including altered cortisol production. It is not surprising, therefore, that adolescent depression has been related to aberrant FA in the UF, although the direction of this association is mixed (Aghajani et al., Reference Aghajani, Veer, Van Lang, Meens, Van Den Bulk, Rombouts and Van Der Wee2014; Lewinn et al., Reference Lewinn, Connolly, Wu, Drahos, Hoeft, Ho and Yang2014; see also Bracht, Linden, & Keedwell, Reference Bracht, Linden and Keedwell2015). Researchers have also identified alterations in the fornix, the primary output tract of the hippocampus that subserves intralimbic connections, in studies examining the effects of ELS. Specifically, two studies of children or young adults reported reduced FA in the fornix in relation to ELS (Choi, Jeong, Rohan, Polcari, & Teicher, Reference Choi, Jeong, Rohan, Polcari and Teicher2009; Eluvathingal, Reference Eluvathingal2006). Only one study to date, conducted in 6-year-old girls, included assessments of both cortisol stress reactivity and white matter microstructure. In that study, greater cortisol reactivity was associated with reduced FA in several tracts, but this negative association was attenuated in girls with parents who had more positive parent affect (Sheikh et al., Reference Sheikh, Joanisse, Mackrell, Kryski, Smith, Singh and Hayden2014). Despite the limited integrative research in this area, based on the reviewed studies examining stress cortisol or white matter microstructure in youth who have been exposed to more extreme adversity or maltreatment, we hypothesized that greater severity of ELS and, by proxy, decreased stress cortisol would be associated with lower FA in frontolimbic white matter tracts including the UF and the fornix (Huang, Gundapuneedi, & Rao, Reference Huang, Gundapuneedi and Rao2012).
Finally, it is important to consider pubertal status and sex when examining the relations among ELS, stress cortisol, white matter microstructure, and depressive symptoms. The pubertal recalibration hypothesis (DePasquale et al., in press; Romeo, Reference Romeo2010; Romeo & McEwen, Reference Romeo and McEwen2006) posits that the significant neuroendocrine changes that occur during puberty undergird a second sensitive period of development for stress-mediating systems, including the HPA axis. Consequently, the pubertal transition is an important period for researchers to study in order to gain a better understanding of how ELS may affect the development of the HPA axis and related brain circuits in ways that affect adaptive emotion regulation and contribute to depressive symptoms. With respect to pubertal status, as noted above, we previously found that puberty moderated the association between ELS and the cortisol awakening response (King et al., Reference King, Colich, LeMoult, Humphreys, Ordaz, Price and Gotlib2017). In the same data set, we documented in early pubertal youth that subjective sensitivity to ELS (i.e., the within-person discrepancy between subjective vs. objective stress metrics) was associated with both reduced FA in the UF and higher concurrent anxiety symptoms (Ho et al., Reference Ho, King, Leong, Colich, Humphreys, Ordaz and Gotlib2017). Although there were no significant effects of sex on FA in these analyses, other studies have reported sexual dimorphism in FA (Lebel et al., Reference Lebel, Gee, Camicioli, Wieler, Martin and Beaulieu2012; Olson et al., Reference Olson, Von der Heide, Alm and Vyas2015), and sex influences HPA axis activation to stress (Ordaz & Luna, Reference Ordaz and Luna2012). Finally, in an independent sample of female youth, we found that stage of pubertal development moderated the associations between stress cortisol reactivity and likelihood of the future onset of depression, such that cortisol hyperreactivity predicted depression in later puberty, but cortisol hyporeactivity predicted depression in earlier puberty (Colich, Kircanski, Foland-Ross, & Gotlib, Reference Colich, Kircanski, Foland-Ross and Gotlib2015). With respect to sex, it is well established that the pubertal transition marks the beginning of a greater increase in the incidence of depression in females than in males, which likely involves a complex interaction of biological and environmental factors (Kessler, Reference Kessler2003; Kwong et al., Reference Kwong, Manley, Timpson, Pearson, Heron, Sallis and Leckiein press).
In the current study, we aimed to build on previous research by conducting an integrative examination of childhood stress exposure, the cortisol stress response, white matter microstructure of the UF and the fornix, and depressive symptoms in youth. Participants were recruited from the community in order to focus on normative variations in ELS. First, we examined associations among these psychobiological constructs in early puberty. We focused analyses on early puberty and accounted for individual differences in precise pubertal staging. We hypothesized that higher ELS, a decreased cortisol stress response, and reduced FA in the UF and the fornix would be significantly interrelated in early puberty. Second, we tested whether and how these domains of analysis in early puberty predicted symptoms of depression in later puberty. We predicted that a decreased cortisol stress response and reduced FA in frontolimbic tracts would, in turn, predict an increase in depressive symptoms in later puberty, above and beyond symptoms in earlier puberty. While we did not make specific predictions by sex given the nascent literature on this topic, we tested sex post hoc as an exploratory moderator of effects. Given well-documented sex differences in pubertal timing (Negriff & Susman, Reference Negriff and Susman2011), we matched males and females on pubertal status.
Method
Participants
Participants were native English speakers, recruited from the San Francisco Bay Area through posted flyers and online advertisements for a longitudinal study of adolescent brain development (see Colich et al., Reference Colich, Williams, Ho, King, Humphreys, Price, Ordaz and Gotlib2017; King et al., Reference King, Colich, LeMoult, Humphreys, Ordaz, Price and Gotlib2017, for additional details on participant recruitment). A total of 208 participants (117 females; M age = 11.37 years, SD = 1.04 years; M Tanner stage = 2.03, SD = 0.73) provided data for the current analyses. At the early puberty assessment, 201 participants provided ELS data, and 93 participants were randomly selected to complete a modified Trier Social Stress Test (TSST; Kirschbaum, Pirke, & Hellhammer, Reference Kirschbaum, Pirke and Hellhammer1993) and provided stress cortisol data (51 females; M age = 11.45 years, SD = 1.08 years). In the broader longitudinal study, we randomly split the sample in half to complete the TSST at early puberty versus later puberty; this enabled us to assess stress cortisol production in TSST-naïve youth while retaining the ability to compare stress cortisol at early versus later puberty between subjects. Thus, consistent with the focus of the present study on psychobiology in early puberty, all participants in the current analyses completed the TSST at early puberty. Of the 187 participants who attempted a scan session, 129 participants had usable (i.e., below our motion threshold cutoffs) diffusion magnetic resonance imaging (dMRI) data for either the UF or the fornix (76 females; M age = 11.35 years, SD = 1.10 years); 66 participants had both stress cortisol and any dMRI data. Participants with versus without stress cortisol or dMRI data did not significantly differ on any other variables of interest (all |t|s ≤ 1.94, all ps ≥ .05). Finally, we obtained depressive symptom data from 205 participants at early puberty (115 females; M age = 11.38 years, SD = 1.04 years) and from 154 participants approximately 2 years later, in later puberty (84 females; M age = 13.36 years, SD = 1.04 years; M assessment interval = 23.01 months, SD = 3.58 months).
Potential participants were excluded from the study if they had contraindications to MRI scanning (e.g., metal implants or braces), had a history of neurological disorder or significant medical illness, had cognitive or physical challenges that impeded their ability to complete or understand the study procedures, or were not fluent in English. Females were excluded from the study if they had already experienced menarche, due to the focus of the larger study on the effects of ELS on neurodevelopment across the pubertal transition; thus, males and females were matched for self-reported pubertal stage at study inclusion. The study was approved by the Stanford University Institutional Review Board. In accordance with the Declaration of Helsinki, participants provided informed assent and a parent or legal guardian provided informed consent.
Measures
Early life stress
Participants were interviewed by trained research personnel about their history of exposure to more than 30 different types of stressors, using a version of the Traumatic Events Screening Inventory for Children (Ribbe, Reference Ribbe and Stamm1996). Each type of stress exposure endorsed by the participant prompted follow-up questions to obtain a deep characterization of the experience. For example, participants were asked, “Have you ever been in a really bad accident, like a car accident, a fall, or a fire?” If participants endorsed this item, follow-up questions included, “When this happened, were you really hurt? Was someone else really hurt or even killed?” Subsequently, a panel of three trained coders, who were not provided with any information relating to the participant's subjective experience of each event, rated the objective severity of each event based on the information obtained at the interview, using a modified version of the UCLA Life Stress Interview coding system (Rudolph et al., Reference Rudolph, Hammen, Burge, Lindberg, Herzberg and Daley2000). Specifically, coders rated each event on a 5-point scale using half-point increments (0 = nonevent or no impact [e.g., witnessed debris from car crash]; 4 = extremely severe impact [e.g., sexually abused]; intraclass correlation = .99). The maximum panel-rated severity ratings for each type of stressor were summed to obtain a total ELS score for each participant, representing cumulative stress exposure (King et al., Reference King, Colich, LeMoult, Humphreys, Ordaz, Price and Gotlib2017). ELS scores ranged from 0.5 to 30 across the sample. Figure 1 presents descriptive information on stressor endorsement as a function of the nature of the stressor and the age at which it was endorsed as having occurred.

Figure 1. Descriptive information on stressor endorsement as a function of the nature of the stressor and the age at which it was endorsed as having occurred (N = 201).
Stage of pubertal development
Pubertal stage was determined using self-report Tanner Staging (Marshall & Tanner Reference Marshall and Tanner1968). Participants reported developmental stage by selecting the depiction most accurate to their own development from a schematic drawing of two secondary sex characteristics (pubic hair and breast/testes development) on a scale of 1 to 5, a method that has been documented to have strong associations with physicians’ physical examinations of pubertal development (Coleman & Coleman Reference Coleman and Coleman2002; Shirtcliff, Dahl, & Pollak, Reference Shirtcliff, Dahl and Pollak2009). Our measure of pubertal stage was the average of the pubic and breast/testes scores, consistent with study inclusion criteria (Colich et al., 2017; King et al., Reference King, Colich, LeMoult, Humphreys, Ordaz, Price and Gotlib2017).
Depressive symptoms
Participants completed the 10-item version of the Children's Depression Inventory (CDI-S; Kovacs, Reference Kovacs1992), a self-report measure of depressive symptoms designed for youth ages 8 to 17 years. Responses capture symptoms during the past 2 weeks. Studies have reported high validity and reliability of this measure (Kovacs, Reference Kovacs1985, Reference Kovacs1992). In the current sample, internal consistency of the CDI-S was acceptable at both early puberty (α = 0.74) and later puberty (α = 0.75).
Procedures
In early puberty, participants completed two separate sessions, the first comprising the interview-based and self-report measures, and the second comprising the scan session followed by the stress cortisol assessment. For participants who opted out of the scan session, stress cortisol sessions were completed after the interview session. In later puberty, participants again completed the measure of depressive symptoms.
Stress cortisol assessment
TSST
Participants completed a modified TSST (Kirschbaum et al., Reference Kirschbaum, Pirke and Hellhammer1993) in which salivary cortisol levels were sampled repeatedly. Participants were brought into a quiet room by an experimenter and instructed to relax for 5 min; saliva samples were collected both before and after this period (i.e., Samples 1 and 2). During the next phase, the experimenter began a story and instructed participants to think of an exciting end to the story over the next 5 min. Participants were informed that an impartial judge would evaluate their story ending on content and memorization. Participants prepared and delivered the story ending to a judge who was trained to appear neutral and took notes on the presentation. After 5 min, the judge instructed participants to complete a serial subtraction task aloud under observation for an additional 5 min. The judge took notes and interrupted participants when they made a mistake, instructing them to start over. A saliva sample was collected at the end of this interval (i.e., Sample 3, 15 min from the second baseline sample or stressor onset). Participants then watched a neutral video clip for two 15-min intervals, after each of which an additional saliva sample was collected (i.e., Samples 4 and 5, 30 and 45 min from the stressor onset).
Sample assay and data reduction
All saliva samples were collected using SalivaBio Children's Swabs (Salimetrics, LLC). Samples were stored in a –20 °C freezer in the Stanford University Department of Psychology after the conclusion of the TSST. Samples were assayed utilizing a high-sensitivity (0.004 μg/dL) immunoassay kit from Immuno-Biological Laboratories Inc. (Hamburg, Germany; intra- and interassay coefficients of variation range = 3%–5%). Samples were assayed together in large batches to control for interassay error.
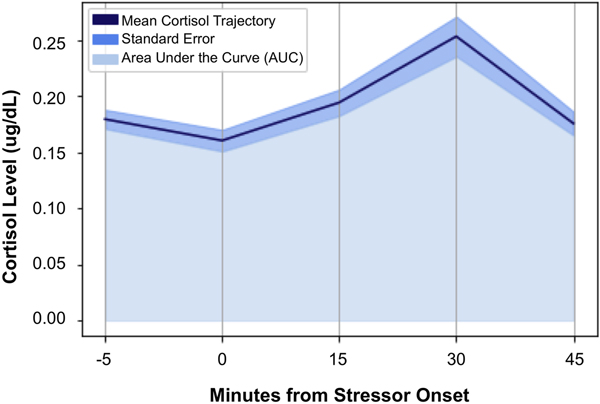
Consistent with field recommendations (Stalder et al., Reference Stalder, Kirschbaum, Kudielka, Adam, Pruessner, Wüst and Clow2016) and our prior work (e.g., King et al., Reference King, Colich, LeMoult, Humphreys, Ordaz, Price and Gotlib2017), cortisol values for each of the time points that were >2 SD above the mean value of the sample for that time point were winsorized. A total of 16 (3.4%) cortisol values were winsorized. Area under the curve (AUC) methods were used to calculate participants’ total stress cortisol production. Calculations used each participant's precise cortisol value at each time point and the precise interval (number of minutes) between each pair of time points (Pruessner, Kirschbaum, Meintschmid, & Hellhammer, Reference Pruessner, Kirschbaum, Meinlschmid and Hellhammer2003). Based on our previous work (e.g., Colich et al., Reference Colich, Kircanski, Foland-Ross and Gotlib2015), predictions, and descriptive data concerning cortisol production in the sample as a whole (see Table 1 and Figure 2), AUC values were calculated for baseline-to-peak stress reactivity (AUCgpre-peak; i.e., from Samples 2 to 4) and post-peak stress recovery, during which average cortisol levels returned to baseline (AUCgpost-peak; i.e., from Samples 4 to 5).
Table 1. Sample demographic, neuroendocrine, and clinical characteristics

Note: CDI-S, Children's Depression Inventory—Short Form. ELS, early life stress. FA, fractional anisotropy. UF, uncinate fasciculus. aData were available for 201 participants. bOne participant did not complete the measures or declined to provide information. cNineteen participants did not complete the measures or declined to provide information. dEighteen participants did not complete the measures or declined to provide information. eData were available for 94 participants. One participant did not have sample times collected; therefore, AUCg data could not be computed. fData were available for 106 (left UF), 113 (right UF), 82 (left fornix), and 82 (right fornix) participants. gData were available for 205 (early puberty) and 154 (later puberty) participants.

Figure 2. Average cortisol levels at each of the five collection time points, designated by minutes from stressor onset (N = 93).
dMRI
MRI scan acquisition
MRI scans were acquired at the Center for Cognitive and Neurobiological Imaging at Stanford University using a 3T Discovery MR750 (GE Medical Systems, Milwaukee, WI) equipped with a 32-channel head coil (Nova Medical). We acquired a high-resolution T1-weighted (T1w) anatomical scan in order to register the dMRI data using an SPGR sequence (repetition time = 6.24 ms, echo time = 2.34 ms, inversion time = 450 ms, flip angle = 12 degrees, sagittal slices = 0.9 mm isotropic voxels). Diffusion MRI was acquired to characterize white matter tracts of interest using an echo-planar imaging sequence (repetition time = 8500 ms, echo time = 93.5 ms, 64 axial slices, 2 mm isotropic voxels, 60 b = 2000 diffusion-weighted directions, 6 b = 0 acquisitions at the beginning of the scan).
dMRI preprocessing
As previously described (Ho et al., Reference Ho, King, Leong, Colich, Humphreys, Ordaz and Gotlib2017), dicoms from the dMRI and T1w SPGR sequences were reconstructed into four-dimensional NIFTI format. Anatomical landmarks were manually defined in the anterior commissure and posterior commissure (AC-PC) and midsagittal plane of the T1w NIFTI, to guide a rigid-body transformation that converted the images into AC-PC aligned space. Participant motion in the diffusion-weighted images was corrected using nonlinear coregistration. Each diffusion-weighted image was registered to the mean of the six motion-corrected non-diffusion-weighted (b = 0) images. The mean of the six b = 0 images was then aligned to the T1w image in AC-PC space using a rigid body three-dimensional (3D) motion correction (6 parameters) with a constrained nonlinear warping (8 parameters) based upon a model of expected distortions from the eddy-current (Rohde, Barnett, Basser, Marenco, & Pierpaoli, Reference Rohde, Barnett, Basser, Marenco and Pierpaoli2004). Raw diffusion images were resampled to 2 mm isotropic voxels by combining anatomical alignment and motion correction into one transformation, and then resampling the data using a seventh-order b-spline algorithm. All preprocessing steps were performed using the open-source suite of tools developed by the VISTA Lab (https://github.com/vistalab/vistasoft).
Tractography of UF and control tract
To compute mean FA of left and right UF, we used Automatic Fiber Quantification (AFQ), an open-source program (Yeatman, Dougherty, Myall, Wandell, & Feldman, Reference Yeatman, Dougherty, Myall, Wandell and Feldman2012; https://github.com/jyeatman/AFQ). We also used AFQ to compute mean FA of the corpus callosum major as a control tract. Fiber tracking was performed across the whole brain on AC-PC aligned tensor maps as has been previously described (Ho et al., Reference Ho, King, Leong, Colich, Humphreys, Ordaz and Gotlib2017). Tracts were estimated by employing a deterministic streamlines tracking algorithm (Basser, Pajevic, Pierpaoli, Duda, & Aldroubi, Reference Basser, Pajevic, Pierpaoli, Duda and Aldroubi2000; Conturo et al., Reference Conturo, Lori, Cull, Akbudak, Snyder, Shimony and Raichle1999) with a fourth-order Rungeñ–Kutta path integration method and 1 mm fixed-step size. A continuous tensor field with trilinear interpolation was estimated for tensor events. Seeds used for tractography were selected from a 1 mm 3D grid, which spanned the whole brain mask for voxels with FA > 0.3. Fiber tracing proceeded until FA decreased to < 0.15, or until the minimum angle measured between current and previous path segments was > 30 degrees. Streamlines were traced from the initial seed voxel in both directions along the principle axis of diffusion. Fibers that passed through the two planar regions of interest (ROIs), one located in the temporal lobe and one in the frontal lobe, became candidates for the UF fiber group or corpus callosum major fiber group. These waypoint ROIs were based on the ICBM-DTI81 and transformed linearly to each participant's brain using previously published protocols (Zhang, Olivi, Hertig, van Zijl, & Mori, Reference Zhang, Olivi, Hertig, van Zijl and Mori2008). Each candidate fiber was scored based on its similarity to a standardized fiber tract probability map using previously published procedures (Hua et al., Reference Hua, Zhang, Wakana, Jiang, Li, Reich and Mori2008). Specifically, data from each participant were transformed to the JHU-DTI template (http://lbam.jhmi.edu) and compared to the probabilistic Mori group atlas (Wakana, Jiang, & van Zijl, Reference Wakana, Jiang and van Zijl2004) using trilinear interpolation. The mean score for all five points for each UF or corpus callosum major tract candidate fiber was computed. All streamline fibers with a score of 0 were discarded. All streamlines were cleaned were cleaned using a statistical outlier rejection algorithm, which represents the tract as a 3D Gaussian and estimated fibers within a maximum Gaussian distance of 5. Fibers that deviated more than 4 SD from the core (mean) center of the tract were discarded. This process was repeated until all fiber outliers were removed. All remaining fibers were then visually inspected, and fibers that did not fit the tract profile were clipped or removed. Participants for whom tracts did not adequately resolve were conservatively excluded (N = 21). For additional information on AFQ, see https://github.com/jyeatman/AFQ. For further details, see Ho et al. (Reference Ho, King, Leong, Colich, Humphreys, Ordaz and Gotlib2017).
Tractography of the fornix
The anterior fibers of the fornix terminate in the nucleus accumbens. Thus, hippocampal and nucleus accumbens ROIs were defined by processing each subject's AC-PC aligned T1w image through FreeSurfer (version 5.3), an automated segmentation and parcellation software suite (Fischl et al., Reference Fischl, Salat, Van Der Kouwe, Makris, Ségonne, Quinn and Dale2004), using parcellations based on the Destrieux atlas (Destrieux, Fischl, Dale, & Halgren, Reference Destrieux, Fischl, Dale and Halgren2010). The white-matter segmentation generated by FreeSurfer was used to create a binary white-matter mask. Fiber tracking was performed between the hippocampal and nucleus accumbens ROIs obtained from Freesurfer segmentations using constrained spherical deconvolution-based probabilistic tracking, as implemented in MRtrix software (version 0.2.12; Tournier, Calamante, & Connelly, Reference Tournier, Calamante and Connelly2007). This method has been previously described (Leong, MacNiven, Samanez-Larkin, & Knutson, Reference Leong, MacNiven, Samanez-Larkin and Knutson2018; Leong, Pestilli, Wu, Samanez-Larkin, & Knutson, Reference Leong, Pestilli, Wu, Samanez-Larkin and Knutson2016). The maximum number of harmonics was 4 (Lmax = 4), and this defined the maximum deconvolutions kernel number, utilized by constrained spherical deconvolution, a method of estimating the distribution of fiber orientations within each voxel. We fit the function using 16 parameters, and generated fiber pathways by randomly seeding the starting ROI and tracking until the fiber reached the destination ROI. Fibers that left the white-matter mask were terminated and discarded.
Fibers obtained using this method were reduced to core fiber bundles by removing any outliers and anatomically unlikely pathways (such as fibers passing through lateral ventricles). Specifically, fibers more than 2 SD higher or lower than the mean fiber length were removed. Then, fibers greater than 3 SD from the mean spatial location of the core fiber (Mahalanobis distance) were removed. Finally, we visually inspected the final tracts and excluded those with inaccurate or poorly resolved fiber bundles (N = 46). For further details, see Leong et al. (Reference Leong, Pestilli, Wu, Samanez-Larkin and Knutson2016, Reference Leong, MacNiven, Samanez-Larkin and Knutson2018). For visualization of tracts from a representative participant, see Figure 3.

Figure 3. Visualization of the (a) uncinate fasciculus, (b) fornix, and (c) corpus callosum major from a representative subject.
Data analysis
Statistical analyses were conducted in R (version 3.5.1; R Core Team, 2017). All tests were two-tailed, α = 0.05.
Associations among ELS, stress cortisol, and FA in early puberty
We conducted a set of linear regression models to examine the associations among ELS, the cortisol stress response, and FA of the UF and the fornix in early puberty. We tested the hypothesis that higher ELS would predict decreased cortisol production (separate models for pre-peak and post-peak) and reduced FA in the UF and the fornix (example model for AUCgpost-peak):
 $${\rm AUC}{\rm g}_{{\rm post}\hyphen{\rm peak}} = {\rm \beta} _0 + {\rm} {\rm \beta} _{{\rm ELS}} + {\rm \beta}_{{\rm pubertal}\,{\rm stage}} + {\rm \beta} _{{\rm baseline}\,{\rm cortisol}}$$
Based on our findings (described below), we next tested the hypothesis that decreased cortisol production post-peak would be related to reduced FA in the UF and the fornix (example model for FAleft UF):
 $${\rm F}{\rm A}_{{\rm left}\,{\rm UF}} = {\rm \beta} _0 + {\rm \beta} _{{\rm AUCg}({\rm post}\hyphen{\rm peak})} + {\rm} {\rm \beta} _{{\rm pubertal}\,{\rm stage}} + {\rm \beta} _{{\rm baseline}\,{\rm cortisol}} + {\rm \beta} _{{\rm cranial}\,{\rm volume}}$$
As denoted above, all analyses included pubertal stage as a covariate. In addition, all analyses of stress cortisol production included participants’ baseline cortisol level (Sample 2) as a covariate to ensure that effects were specific to stress cortisol. ELS did not significantly predict baseline cortisol level (Sample 2), t(87) = –0.71, p = .479. All analyses of FA included cranial volume as a covariate (Olson et al., Reference Olson, Von der Heide, Alm and Vyas2015). ELS did not significantly predict cranial volume, t(174) = –0.08, p = .938. Follow-up analyses examined sex as an exploratory moderator of these associations.
ELS, stress cortisol, and FA in early puberty as predictors of depressive symptoms in later puberty
We conducted a set of linear regression models to test the hypothesis that a decreased cortisol stress response and reduced FA in the UF and the fornix would predict higher depressive symptoms in later puberty. Because distinct subsamples of participants completed the stress cortisol and dMRI assessments, these predictors were analyzed separately (example model for AUCgpost-peak):
 $${\rm CD}{\rm I}_{{\rm later}\,{\rm puberty}} = {\rm \beta }_0 + {\rm \beta }_{{\rm AUCg}({\rm post}\hyphen{\rm peak})} + {\rm \beta }_{{\rm pubertal}\,\,{\rm stage}} + {\rm \beta }_{{\rm baseline}\,\,{\rm cortisol}} + {\rm \beta }_{{\rm CDI}({\rm early}\,{\rm puberty})}$$
As denoted above, all analyses included pubertal stage as a covariate, all analyses of stress cortisol production included baseline cortisol level as a covariate, and all analyses of FA included cranial volume as a covariate. In addition, all analyses included CDI scores in early puberty as a covariate, such that we examined the predictive effects at later puberty above and beyond any symptoms at baseline. Follow-up analyses examined sex as an exploratory moderator of these associations.
Sensitivity analyses
Finally, to examine the specificity of the findings to FA in the tracts of interest, we conducted several linear regression models, parallel to the primary analyses above, replacing FA in the tracts of interest with FA in the corpus callosum major. In addition, we conducted several follow-up analyses, also parallel to the primary analyses above, which included alternate covariates or nonwinsorized stress cortisol values.
Results
Participant characteristics
Table 1 presents a summary of demographic, neurobiological, and clinical characteristics across the full sample. Older age was associated with higher AUCgpost-peak (r = .25, p = .018); this association was no longer significant, however, after partialing pubertal stage (r partial = .18, p = .081). Neither age nor sex was significantly related to any other variables of interest (all |r|s ≤ .20, all ps ≥ .058); therefore, age and sex were not included in the a priori analyses.
Associations among ELS, stress cortisol, and FA in early puberty ELS and stress cortisol
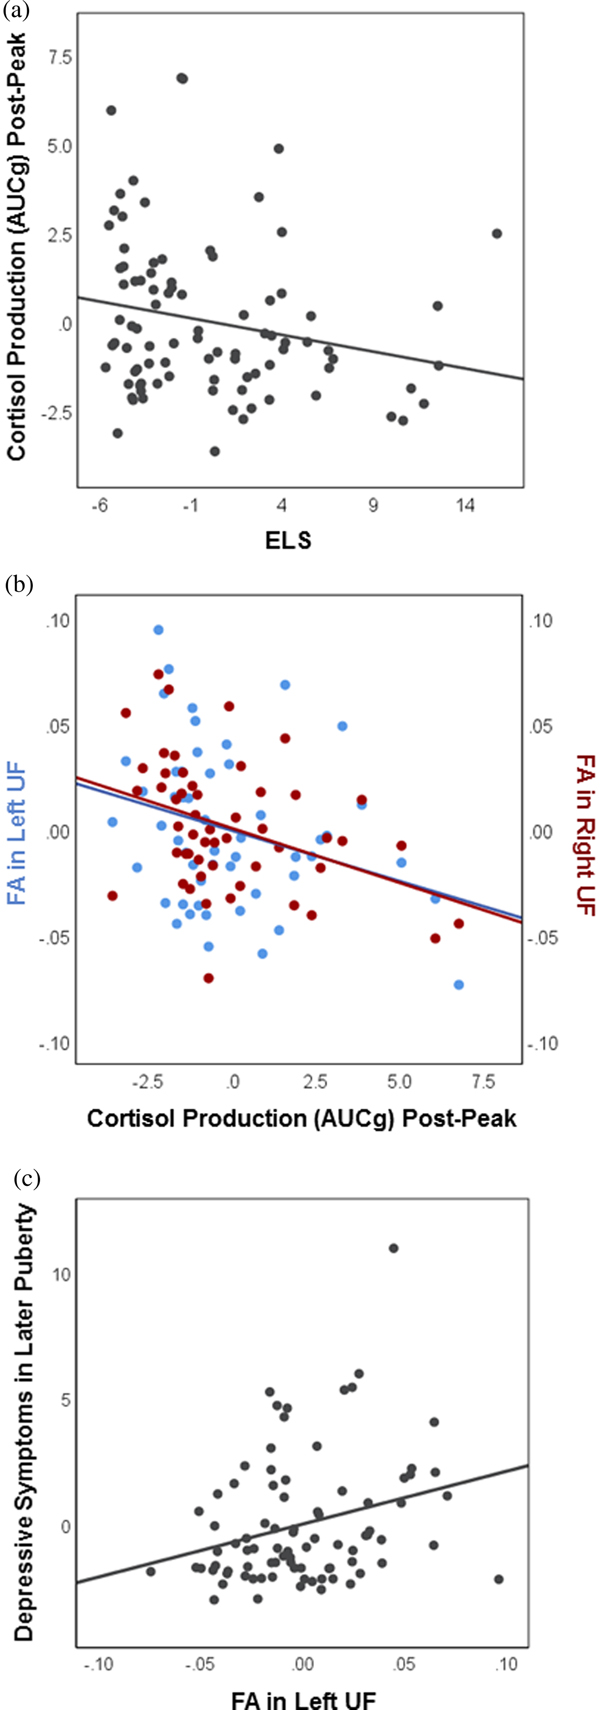
As hypothesized, higher ELS predicted decreased cortisol production during the final phase of the task, following the peak of average stress cortisol levels (AUCgpost-peak: B = –0.094, SE = 0.047, t(85) = –2.01, p = .048) (see Figure 4a). Contrary to predictions, however, ELS did not significantly predict cortisol production during baseline-to-peak stress reactivity (AUCgpre-peak: B = –0.118, SE = 0.061, t(85) = –1.93, p = .057). Therefore, we restricted subsequent analyses of stress cortisol to the post-peak period.

Figure 4. Selected associations among early life stress, stress cortisol production, white matter integrity, and depressive symptoms. Partial regression plots depict associations between the unstandardized residuals (i.e., variables residualized for all other predictors in the linear regression models). (a) In early puberty, higher early life stress predicts decreased cortisol production during the final phase of the task, post-peak (N = 93; p = .048). (b) In early puberty, decreased cortisol production post-peak predicts increased fractional anisotropy in both the left (N = 52; p = .039) and the right (N = 57; p = .007) uncinate fasciculus. (c) Increased fractional anisotropy in the left uncinate fasciculus in early puberty predicts higher depressive symptoms in later puberty (N = 85; p = .012).
ELS and FA
Contrary to predictions, ELS did not significantly predict FA in either the UF (FAleft UF: B = 0.0004, SE = 0.0007, t(96) = 0.50, p = .619; FAright UF: B = 0.0004, SE = 0.0006, t(102) = 0.64, p = .524), or the fornix (FAleft fornix: B = 0.0006, SE = 0.0008, t(74) =0.84, p = .403; FAright fornix: B = –0.0001, SE = 0.0009, t(74) = –0.15, p = .879).
Stress cortisol and FA
Decreased cortisol production post-peak was associated with increased FA in both the left UF (FAleft UF: B = –0.0050, SE = 0.0023, t(47) = –2.13, p = .039), and the right UF (FAright UF; B = –0.0050, SE = 0.0018, t(52) = –2.83, p = .007) (Figure 4b). Cortisol production post-peak was not associated with FA in the fornix (FAleft fornix: B = –0.0001, SE = 0.0017, t(47) = –0.08, p = .938; FAright fornix: B = –0.0032, SE = 0.0024, t(47) = –1.32, p = .194).
Moderation by sex
Follow-up exploratory analyses indicated several significant interactions with sex (ps < .05) all of which involved FA. Examinations of simple slopes indicated that, for boys only, higher ELS predicted increased FA in both the left UF (FAleft UF simple slope: B boys = 0.0026, SE = 0.0011, t(94) = 2.47, p = .015), and the left fornix (FAleft fornix simple slope: B boys = 0.0023, SE = 0.0011, t(72) = 2.11, p = .039). For boys only, decreased cortisol production post-peak was associated with marginally increased FA in the left fornix (FAleft fornix simple slope: B boys = –0.0068, SE = 0.0039, t(45) = –1.74, p = .088). No other interaction effects were significant (all |t|s ≤ 1.56, all ps ≥ .123).
ELS, stress cortisol, and FA in early puberty as predictors of depressive symptoms in later puberty
Baseline relations
Higher ELS was associated with higher depressive symptoms in early puberty (CDIearly puberty: B = 0.101, SE = 0.032, t(195) = 3.19, p = .002), but did not predict level of depressive symptoms in later puberty above and beyond the prior symptoms (CDIlater puberty: B = 0.049, SE = 0.047, t(142) = 1.03, p = .306). Neither stress cortisol production nor FA in any tract of interest was related to depressive symptoms in early puberty (all |t|s ≤ 1.13, all ps ≥ .260).
Stress cortisol predicting depressive symptoms
Contrary to predictions, cortisol production post-peak in early puberty did not predict depressive symptoms in later puberty (CDIlater puberty: B = –0.004, SE = 0.016, t(67) = –0.02, p = .981).
FA predicting depressive symptoms
Increased FA in the left UF in early puberty predicted higher depressive symptoms in later puberty (CDIlater puberty: B = 20.901, SE = 8.138, t(80) = 2.57, p = .012) (Figure 4c). In addition, reduced FA in the right fornix in early puberty predicted higher depressive symptoms in later puberty (CDIlater puberty: B = –24.374, SE = 11.289, t(63) = –2.16, p = .035). These findings remained significant even when ELS was included in the model as a covariate (ps = .017 and .031, respectively). Findings were not significant for the right UF (CDIlater puberty: B = 13.687, SE = 10.106, t(86) = 1.35, p = .179), or the left fornix (CDIlater puberty: B = –2.313, SE = 12.671, t(63) = –0.183, p = .856).
Moderation by sex
Follow-up analyses yielded no significant interactions with sex (all |t|s ≤ 1.33, all ps ≥ .190).
Sensitivity analyses
Follow-up analyses supported specificity of the significant findings with FA in the tracts of interest. Specifically, cortisol production during stress recovery was not significantly associated with FA in the corpus callosum major (t(49) = 0.31, p = .757). Further, FA in the corpus callosum major in early puberty did not significantly predict depressive symptoms in later puberty (t(84) = 0.52, p = .604).
Additional analyses that included alternate covariates or nonwinsorized stress cortisol values also supported robustness of the findings. First, we conducted all analyses including both age and sex as additional covariates. Second, we conducted all analyses using only the breast/testes score, rather than the average of the pubic and breast/testes scores, from the Tanner staging assessment as a covariate. Third, we conducted all analyses using nonwinsorized cortisol values. For all three sets of analyses, with one exception, all results remained either statistically significant or nonsignificant relative to the original results. The one finding that differed was no longer significant in all three sets of analyses: ELS did not significantly predict cortisol production post-peak (model including age and sex covariates: AUCgpost-peak: B = –0.069, SE = 0.046, t(83) = –1.49, p = .139; model using only breast/testes score: AUCgpost-peak: B = –0.087, SE = 0.047, t(85) = –1.85, p = .069; model using nonwinsorized cortisol values: AUCgpost-peak: B = –0.099, SE = 0.061, t(85) = –1.62, p = .109).
Discussion
The goal of the current study was to build on prior research by conducting an integrative examination of ELS, the cortisol stress response, white matter integrity of key frontolimbic tracts, and depressive symptoms during puberty. As predicted, we found in early puberty that higher ELS was associated with decreased cortisol production during the final phase of a psychosocial stress task. Decreased cortisol production, in turn, was related to increased (rather than decreased, as we had hypothesized) FA in the UF. Further, increased FA in the UF during early puberty predicted higher depressive symptoms in later puberty, above and beyond any prior symptoms. In boys only, higher ELS and decreased cortisol production were associated with increased FA in the fornix. Below, we discuss both hypothesized and unexpected findings within a broader model of ELS, emotion dysregulation, and risk for depression during the transition through puberty.
Results linking ELS to decreased stress cortisol production are consistent with findings of previous studies (reviewed in Bunea et al., Reference Bunea, Szentágotai-Tǎtar and Miu2017). Whereas most prior work focused on childhood maltreatment, our study extends those findings to broadly and dimensionally assessed childhood stress in a community sample of early pubertal youth. Only cortisol production during the final phase of the task, following peak cortisol levels, was significantly associated with ELS; cortisol production at baseline or from baseline to peak was not. Because HPA axis activation to an acute stressor is normative, it may have been more difficult to observe relative decreases in this sample. Further, a meta-analysis of stress cortisol function in adult depression reported that findings for aberrant cortisol production during stress recovery were stronger than those for stress reactivity (Burke, Davis, Otte, & Mohr, Reference Burke, Davis, Otte and Mohr2005). As described below with respect to the associations between cortisol and FA, it is also possible that the reduced post-peak cortisol production indexes a compensatory mechanism in early puberty. In addition, descriptive statistics indicated that there was considerable variability in cortisol levels at their peak. While the results for pre-peak cortisol production were trending in the same direction as for post-peak cortisol production, the greater variability in peak cortisol levels may have made it more difficult to detect significant associations with ELS.
Contrary to predictions, ELS was not directly related to FA in the UF or the fornix. Our prediction of such an association was derived from primarily extreme-group designs, which have examined individuals with significant childhood maltreatment (reviewed in Teicher et al., Reference Teicher, Samson, Anderson and Ohashi2016). While similar mechanisms (e.g., glucocorticoids or inflammatory markers) are likely to explain the effects of ELS on white matter development more generally, there may be some aspects of extremely severe experiences of ELS that noticeably affect or compound the effects of stress on brain circuits (i.e., nutrition). These other factors notwithstanding, we do posit that there is a dose-dependent response of severity of ELS on brain structure that may explain why we observed null associations between ELS and FA in the UF or the fornix. That is, typical variations in ELS, such as those in our community-based sample, may not be severe enough along the continuum of ELS severity to be statistically significantly associated with white matter microstructure during early puberty.
To our surprise, decreased stress cortisol production was related to increased, rather than decreased, FA in the UF in early puberty. As we noted, only one study has examined relations between stress cortisol and white matter microstructure. In that study, increased cortisol reactivity was associated with reduced FA, whereas decreased cortisol reactivity was associated with increased FA, in several brain areas not including the UF or the fornix (Sheikh et al., Reference Sheikh, Joanisse, Mackrell, Kryski, Smith, Singh and Hayden2014). Thus, it is possible that our findings are complementary with respect to the relation between decreased stress cortisol production and increased FA. Conversely, it is possible that the decreased cortisol production that was associated with increased FA in the UF in the present study indicates more effective neuroendocrine regulation specific to early puberty in a normative sample such as ours. In a normative sample, consistent with the allostatic load model of stress (McEwen, Reference McEwen1998, Reference McEwen2004), the physiological changes an organism experiences in response to stress may be restorative and produce unsustainable short-term benefits that, over time, lead to long-term adverse consequences. That is, decreased post-peak cortisol production and higher FA in early puberty may reflect compensatory mechanisms that ultimately transition to lower FA over time, given that demyelination occurs in response to prolonged stress exposure.
Increased FA in the UF in early puberty uniquely predicted higher depressive symptoms in later puberty, above and beyond both prior symptoms and severity of ELS. Additional insights concerning this unexpected direction of effect come from the literatures on emotion dysregulation and adolescent depression. Bracht et al.’s (Reference Bracht, Linden and Keedwell2015) recent review highlighted that studies of adolescent depression have reported both decreased and increased FA in the UF, relative to healthy comparison youth. Bracht et al. speculated that increased FA in adolescent depression could be a developmental stage-specific association. Moreover, Aghajani et al. (Reference Aghajani, Veer, Van Lang, Meens, Van Den Bulk, Rombouts and Van Der Wee2014) proposed that increased FA in the UF in adolescent depression may reflect accelerated maturation, given that FA normatively increases from childhood to adulthood (Lebel et al., Reference Lebel, Gee, Camicioli, Wieler, Martin and Beaulieu2012). Based on this reasoning, it is possible that decreased stress cortisol production in early puberty, which itself is predicted by higher ELS, reflects a neuroendocrine system that has adapted to chronic HPA axis activation, leading to an earlier or accelerated maturation of frontolimbic tracts. Accelerated maturation may prematurely close developmental windows of opportunity for the acquisition of emotion regulation skills (Callaghan & Tottenham, Reference Callaghan and Tottenham2016). Given that the current associations between stress cortisol and FA are cross-sectional, follow-up longitudinal analyses are needed to test this hypothesis. Aghajani et al. also suggested that increased FA in the UF in adolescent depression might reflect maladaptively amplified regional function and connectivity in this circuit, which could eventually hamper effective emotion regulation. Clearly, further research is needed to test diffusivity metrics both as vulnerability factors for and as correlates of depression during the transition through puberty and into middle adolescence, in addition to assessing these constructs in high-ELS samples.
Whereas main effects for white matter integrity largely involved the UF, several interaction effects with sex implicated the fornix. Specifically, for boys in early puberty, there were direct associations between higher ELS and increased FA in the fornix, and between decreased stress cortisol production post-peak and increased FA in the fornix. Aberrations in FA in the fornix have been previously reported in relation to ELS, anxiety, and somatization symptoms (Choi et al., Reference Choi, Jeong, Rohan, Polcari and Teicher2009), and may reflect dysfunction in affective, motivational, and memory processes that collectively manifest as emotion dysregulation (reviewed in Haber & Knutson Reference Haber and Knutson2010; Teicher, Tomoda, & Andersen, Reference Teicher, Tomoda and Andersen2006). Recent work on neurodevelopment has shown that, between the ages of 8 and 11 years, boys undergo more dramatic maturation of the fornix than do girls (Simmonds, Hallquist, Asato, & Luna, Reference Simmonds, Hallquist, Asato and Luna2014). Thus, sex differences in maturation of the fornix may play a role in our findings. We should note, however, that we matched boys and girls on pubertal stage and controlled for Tanner stage in all analyses, reducing the likelihood that sex differences in pubertal stage influenced these results.
Taken together, the results of this study support a broader model linking ELS, emotion dysregulation, and risk for depression during the transition through puberty. Consistent with prior population-based work, we found that that higher ELS was associated concurrently with depressive symptoms (McLaughlin et al., Reference McLaughlin, Green, Gruber, Sampson, Zaslavsky and Kessler2012), but did not predict depressive symptoms in later puberty above and beyond prior symptoms. Rather, analyses indicated that ELS predicted stress cortisol production, stress cortisol production was associated with white matter integrity, and white matter integrity predicted changes in depressive symptoms. Conceptually, these results broadly support a model in which frontolimbic circuits implicated in the control of HPA axis function serve as a mediator or “common pathway” through which ELS potentiates risk for emotion dysregulation (reviewed in Lupien et al., Reference Lupien, McEwen, Gunnar, Heim and Pfaff2009). Whereas in the present study most measures were assessed concurrently and formal mediation was not tested, future interdisciplinary research should focus on mediation in large-scale, longitudinal samples. Further, given that ELS has been associated with various maladaptive emotion regulation strategies that are risk factors for depression (e.g., rumination; O'Mahen, Karl, Moberly, & Fedock, Reference O'Mahen, Karl, Moberly and Fedock2015), future studies should integrate assessments of affective processes with neuroendocrine and frontolimbic function. Finally, multiple other potential variables may influence the emergence of depressive symptoms during puberty (e.g., sex hormones), and could be incorporated in future multimodal research.
While the integrative approach of this study is a significant strength, there are several limitations that warrant discussion. First, subsets of participants were missing data on each variable of interest, reducing statistical power. The presence of missing data was primarily due to the fact that only half of participants completed the psychosocial stress task, along with typical constraints such as the usability of diffusion MRI data with youth. However, our overall sample size was relatively large, there were no significant differences between participants with versus without missing data on any variable of interest, and analyses utilized all available cases for each regression model. Nevertheless, future studies with larger samples are warranted. Second, we used Tanner staging as a self-report measure of pubertal stage to decrease participant burden. Although this measure is reliably correlated with physician assessment (e.g., Desmangles, Lappe, Lipaczewski, & Haynatzki, Reference Desmangles, Lappe, Lipaczewski and Haynatzki2006), future work should examine hormonal measures of pubertal development in a more fine-grained manner. Third, although the use of a community sample increases generalizability to typical variations in the constructs of interest, it may decrease effect sizes and the ability to detect significant effects. For example, our sample provided less variability in depressive symptoms than a clinically referred sample would provide. Fourth, links among ELS, stress cortisol production, and white matter integrity were cross-sectional in early puberty, precluding causal inferences and the ability to elucidate order or timing of effects. Future studies should use a prospective approach, beginning in earlier childhood, to gain an understanding of neurobiological mediation. In particular, research might focus on how chronic or elevated ELS involving sustained HPA axis activation prospectively influences structure and function of the amygdala, prefrontal cortex, and hippocampus. Further research should also incorporate a molecular level of analysis to gain insights into mediating mechanisms.
In sum, we bring together several distinct levels of analysis, for the first time, to provide an integrative approach to the study of stress, neurodevelopment, and depressive symptomatology. Our findings suggest important links among childhood experience, neuroendocrine function, and brain connectivity that may have implications for emotion dysregulation and the development of depression during puberty. Our results also underscore the need to consider white matter alterations in youth within a developmental psychopathology framework of deviations from normative maturational processes. Future work is necessary to inform the development of targeted assessment and intervention strategies in youth exposed to ELS in order to mitigate risk for depression.
Acknowledgments
We thank Monica Ellwood-Lowe, M. Catalina Camacho, Sophie Schouboe, Alexandria Price, Holly Pham, and Anna Cichocki for their help with data collection, and M. Catalina Camacho for her work conducting quality checks of the MRI data.
Author contributions
The first two authors, Katharina Kircanski and Lucinda M. Sisk, contributed equally to the article.
Financial support
This research was supported by National Institutes of Health Grants R37-MH101495, F32-MH096385, F32-MH107129, F32-MH114317, K01-MH106805, and K01-MH117442; the Brain and Behavior Research Foundation, Young Investigator Awards 20814, 23582, and 23819; the National Science Foundation; the Klingenstein Third Generation Foundation; the Jacobs Foundation; and the Stanford Precision Health and Integrated Diagnostics Center. The funding agencies played no role in the preparation of this article. The content is solely the responsibility of the authors and does not necessarily represent the official views of the National Institutes of Health.