When evaluating cognitive features, objective tests – T data in Cattell’s (Reference Cattell1979) nomenclature – have advantages over questionnaires, Q data, because they are not influenced by the respondent’s subjectivity. Nonetheless, symptom scales and questionnaires are typically used to evaluate attentional problems in children, their ease of use and predictive power (Johnston & Mah, Reference Johnston, Mah, Hunsley and Mash2008) often being cited to justify their use. Parent and teacher questionnaires offer a definite methodological alternative to objective tests, and their improved reliability and validity over structured clinical interview questions (L data) have been demonstrated. Yet despite clear methodological advancements in questionnaires’ design and validity, and the reliability scores they sometimes obtain, they lack the level of precision and objectivity needed to determine what variables are crucial to understand cognitive processes (Rubio, Santacreu, & Hernández, Reference Rubio, Santacreu and Hernández2004).
Likely the challenges of objective assessment of attention (automatically recording a sequence of behaviors in time) are responsible for the simple, inexpensive, practical instruments currently in use to diagnose cases of attention-deficit/hyperactivity disorder (ADHD). As a result, there has been a proliferation of instruments intended to identify cases of ADHD according to DSM–IV and DSM-IV-TR criteria, with small variations from one to the next (Gualtieri & Johnson, Reference Gualtieri and Johnson2005). That approach – defining symptoms and their frequency to diagnose a syndrome, constructing a scale for parents and teachers to fill out to gauge each symptom’s frequency and diagnose the syndrome – shows a certain tautology (Hale et al., Reference Hale, Yim, Schneider, Wilcox, Henzel, Dixon, Flanagan and Harrison2012) that is having an impact on current estimates of the disorder’s prevalence. It has prompted reflection about how precise and objective the instruments used to measure levels of attention during task execution are, and therefore reflection about how attention deficits get diagnosed. A current research challenge is to determine whether ADHD is actually on the rise, as some epidemiological studies suggest, or if inaccurate measures and diagnostic tools are responsible for the high rates of ADHD currently reported (Cardó, Servera, & Llobera, Reference Cardó, Servera and Llobera2007; Sciutto & Eisenberg, Reference Sciutto and Eisenberg2007).
The need to objectively evaluate attention deficits in order to, first, obtain a differential diagnosis in ADHD cases, and second, accurately determine their epidemiological progression, has led people to propose using objective attention tests (Proyer & Häusler Reference Proyer and Häusler2007).
Some objective tests that measure attention, like Continuous Performance Tests (CPTs) stem from basic experimental research (Botella & Barriopedro, Reference Botella, Barriopedro, Munar, Roselló and Sánchez-Cabaco1999). The rest are visual discrimination tests, at first called Perceptual Speed Tests.
CPTs derive from experimental research in adults. They are computerized tasks rooted in signal detection theory (SDT). SDT is a psychophysical model used to assess human activity in a wide array of fields including sensory discrimination, perception, and memory (Reales & Ballesteros, Reference Reales and Ballesteros1999). CPTs are based on two different paradigms (Ríos-Lago, Periáñez, & Rodríguez-Sánchez, Reference Ríos-Lago, Periáñez, Rodríguez-Sánchez, Tirapu, Ríos-Lago and Maestú2011). In the first, target stimuli appear at a low rate (sustained attention/vigilance); in the second, target stimuli appear at a high rate (sustained attention/inhibition). Both types of CPT yield scores on the following: omissions, commissions, d’ (sensitivity), and β (response style) (Strauss, Sherman, & Spreen, Reference Strauss, Sherman and Spreen2006).
CPTs that measure sustained attention/vigilance use a fixed rate of stimulus presentation, a fixed interval between target stimuli, and a low ratio of target stimuli to distractor stimuli (Riccio, Reynolds, Lowe, & Moore, Reference Riccio, Reynolds, Lowe and Moore2002). On such tasks, people are instructed to respond only when a stimulus matches the model, or matches a sequence indicated in the instructions (e.g. the letter P appears, followed by an X; the number 6, then 3, etc.). On CPTs that measure sustained attention/inhibition, the interval between stimuli, and the number of items between target stimuli, vary from trial to trial. They prompt people to respond to all stimuli save for the target stimulus. Furthermore, on both types of CPT, small variations in stimulus content (letters, numbers, meaningless symbols) have a significant impact on the value of the test variables, and thus on how they are interpreted in the context of objective assessment of attention in children.
There are several CPTs. Some of the most commonly used are: the Test of Variables of Attention (T.O.V.A., Greenberg, Kindschi, Dupuy, & Hughes, Reference Greenberg, Kindschi, Dupuy and Hughes2007), the Gordon Diagnostic System vigilance task (Gordon Systems, Inc., 2009), the Conners CPT (CCPT, Conners, Reference Conners2004), the Integrated Visual and Auditory Continuous Performance Test (IVA + Plus, cited in Strauss et al., Reference Strauss, Sherman and Spreen2006), and in Spain, the Test de Atención Sostenida para Niños [Children Sustained Attention Task] (CSAT, Servera & Llabrés, Reference Servera and Llabrés2004). The T.O.V.A. has the advantage of being administered online at the test website (http://www.tovatest.com/store/), assessing both sustained and selective attention, and utilizing geometric drawings as stimuli, reducing the impact of letter and number learning on attention assessment in children (McGee, Clark, & Symons, Reference McGee, Clark and Symons2000). The GDS vigilance task measures sustained attention and displays a characteristically low rate of stimuli matching the model. After being shown a high number of distractor stimuli, respondents have to make a serious effort to stay alert and press the key when the target stimulus finally appears (e.g. 1 when it follows a 9). The CCPT, conversely, presents the target stimulus frequently, in keeping with the response inhibition paradigm. Thus, when a stimulus different from the model appears, the subject must inhibit his/her response and resist pressing the key. The IVA + Plus includes five sets of 100 trials that switch modality (visual and auditory). In each set, half the trials present a high frequency of target stimuli, and the other half a low frequency. The CSAT was created, and normed in Spain. On it, children must press a key when a -3- appears after a -6-. As on the GDS vigilance task, it presents a low rate of target stimuli. Finally, the AULA (Diaz-Orueta, Iriarte, Climent, & Banterla, Reference Diaz-Orueta, Iriarte, Climent and Banterla2012), recently published in Spain, is a computerized continuous performance test conducted in a virtual setting: a very life-like classroom. On the AULA, children do sustained attention and response inhibition exercises while various auditory and visual distractors are presented.
On CPTs – whether sustained attention/vigilance or sustained attention/inhibition – children with attention deficits exhibit: longer and more variable reaction times, and lower sensitivity (d’) (Epstein et al., Reference Epstein, Erkanli, Conners, Klaric, Costello and Angold2003; Hooks, Milich, & Pugzles-Lorch, Reference Hooks, Milich and Pugzles-Lorch1994; Losier, McGrath, & Klein, Reference Losier, McGrath and Klein1996; Oades, Reference Oades2000; Stins et al., Reference Stins, Tollenaar, Slaats-Villemse, Biutelaar, Swaab-Barneveld, Verhulst and Boomsma2005; Swaab-Barneveld et al., Reference Swaab-Barneveld, de Sonneville, Cohen-Kettennis, Gielen, Biutelaar and van Engeland2000) than children with typical development. Children with attention deficit make more omission errors and commission only when it comes to sustained attention/inhibition. That being said, comparative studies have so far been conducted in groups of small sample size, so the ADHD groups could not be divided by age so as to analyze whether these features define the disorder itself, or just the disorder at a particular age.
There are two types of visual discrimination tests: perceptual speed (cancellation) and visual search. On perceptual speed – or cancellation – tests, the set of stimuli is presented all at once, often in rows, and respondents are instructed to carry out the task as quickly as possible. Time is limited, and the experimenter notifies the child when time is up. The first ones were perceptual speed tests on abilities assessment batteries (Sattler, 2008).
Visual search tests present a series of figures altogether but out of order. The task is to indicate which ones are the same as the model, or meet some condition (e.g., “Which figures are the biggest”; “the color blue”; “animals”; etc.). The time allotted tends to be long so the task can be completed. This search is akin to ones that take place in real life: searching for a product at the supermarket or a book on a shelf, without haste, guided by the desire to find what we are looking for. This bolsters the tests’ ecological validity considerably (Peelen & Kastner, Reference Peelen and Kastner2014) and as Wolfe et al. (Reference Wolfe, Kluender, Levi, Bartoshuk, Herz, Kñatzky and Merfeld2012) suggest, “…provide a closer approximation of some of the actions of attention in the real world” (p. 191).
Prominent perceptual speed tests currently employed in Spain include the d2 (Brickenkamp, Reference Brickenkamp2002), the Faces test (Thurstone & Yela, 1985), the Toulouse-Piéron test (Toulouse & Piéron, Reference Toulouse and Piéron1992), and the Escala Magallanes de Atención Visual [Magallanes Visual Attention Scale] (EMAV, García & Magaz, Reference García and Magaz2000). The tests vary in terms of the stimuli they employ: letters on the d2 (specifically d’s and p’s), faces on the Faces test, small squares connected to short line segments going in different directions on the Toulouse-Piéron test, and small human figures on the EMAV. Perceptual speed tests are sometimes considered continuous performance tests (CPTs) with simultaneous – rather than serial – presentation of stimuli (Pineda, Puerta, Aguirre, García-Barrera, & Kamphaus, Reference Pineda, Puerta, Aguirre, García-Barrera and Kamphaus2007).
The best known and most widely used visual search tests are, in paper and pencil format, the Sky Search Test, which is a scale on the Test of Everyday Attention for Children (TEA-Ch, Manly et al., Reference Manly, Anderson, Nimmo-Smith, Turner, Watson and Robertson2001); the Map Mission, also a scale on the Test of Everyday Attention for Children (TEA-Ch); Visual Search, which is a scale on the NEPSY (Klenberg, Korkman, & Lahti-Nuuttila, Reference Klenberg, Korkman and Lahti-Nuuttila2001), and in computerized format, the Visearch single-target search task (Wilding, Munir, & Cornish, Reference Wilding, Munir and Cornish2001), which is the computerized version of the Sky Search Test. Yet none of those has been adapted in Spain. The only visual search test published in Spain to date is the DiViSA (Trees Simple Visual Discrimination Test, Santacreu, Shih, & Quiroga, Reference Santacreu, Shih and Quiroga2011), which is administered and corrected online. Visual search tests more clearly measure selective attention than CPTs, described above, which more clearly measure sustained attention.
Employing an auditory form of perceptual speed test, Pineda et al. (Reference Pineda, Puerta, Aguirre, García-Barrera and Kamphaus2007) found that children with ADHD detected fewer target stimuli (d = 0.31) than their peers with typical development. On visual search tests, no studies have compared children with ADHD to their typical development peers. The closest was a study conducted by Cornish, Wilding, and Hollis (Reference Cornish, Wilding and Hollis2008) comparing Visearch performance in two groups of children their teachers deemed to have either adequate or inadequate levels of attention. Children with low levels of attention made more commission errors (d = 0.12) and had longer response times per correct response (d = 0.34).
In summary, there are two major categories of objective test that measure attention in children: continuous performance tests, mostly used by clinicians and researchers; and visual discrimination tests (perceptual speed or visual search), used mostly in school settings. Continuous performance tests tend to use sensitivity and specificity data (predictive validity, Greenberg, Kindschi, Dupuy, & Hughes, Reference Greenberg, Kindschi, Dupuy and Hughes2007; Strauss et al., Reference Strauss, Sherman and Spreen2006) collected in clinical settings to assess the instrument’s usefulness, and a single ADHD group of variable age. Meanwhile, perceptual speed and visual search tests tend to give convergent validity data (correlation with other similar tests, Manly et al., Reference Manly, Anderson, Nimmo-Smith, Turner, Watson and Robertson2001), not sensitivity and specificity data.
This study’s objective is to analyze the DiViSA visual search test’s predictive validity, overcoming previous studies’ limitations: (a) studies of CPT predictive validity to date have used a single clinical group with a wide age range, so we will utilize a group large enough to be divided by grade in school, 6 to 12 years old, then analyze the test’s sensitivity and specificity in each grade; (b) with respect to studies of convergent validity of visual search tests (Lozano, Capote, & Fernández, Reference Lozano, Capote and Fernández2015), we will analyze the DiViSA’s predictive validity (criterion-related validity); (c) we will take a multivariate approach to analyze how students with typical development differ from potential attention deficit cases and establish which variables are the best predictors at each age. That means accepting as a point of comparison that every variable might differ in its ability to detect attention problems as a function of a child’s age. As far as we know, no such analysis has been performed to date.
The ultimate goal of this study is to supplement the available psychometric information about a computerized measure of attention that is administered and corrected online and was developed entirely in Spain.
Method
Participants
This study compared data from a group of school children with typical development (N = 1,426) to a group of cases (of potential attention deficit) (N = 1,174), both evaluated using the DiViSA. Cases were assessed via the TEA online platform (TEA Ediciones, SA), used by professionals. These children were evaluated with the DiViSA because the professionals testing them found it necessary to determine if their underachievement (reason for concern) could be due to an attention deficit.
All participants were enrolled in public schools in the suburbs of Madrid. Prior to assessment, parents signed consent forms granting their children permission to participate in the study. Socioeconomic status data were known only at the school level, not the participant level. The two schools that participated in this study serve middle class families, that is, families with parents of a medium to high career level and earning 20,000 to 30,000 euro annually (http://www.ine.es/daco/daco42/ociales11/sociales.htm).
For children with typical development, teachers filled out a card for each of their classes, indicating whether each child was receiving normal schooling or an adapted curriculum and, if applicable, providing any evidence of diagnosed psychological disorder (attentional, behavioral, or learning problems). Of all the children evaluated (N = 1442), any cases of low school performance associated with one of the three aforementioned diagnoses (N = 16) were excluded from our analyses. From the TEA online database, we chose the 1,174 cases of potential attention deficit enrolled in second to sixth grade in primary school who took the test over a span of 14 months (June to September). We shall refer to the first group as “school children,” and to the second group as “cases” (people possibly experiencing attention deficit). This procedure blinded the researchers such that they had no knowledge of the participants involved. The researchers were blinded to participant group.
Each of the two groups’ composition in terms of sex and grade in school appears in Table 1. On average, their grades correspond to the following ages: second grade: 7 years old; third: 8; fourth: 9; fifth: 10; and sixth: 11. Each group had a similar distribution in terms of sex in each grade (school children, χ2 (4, N = 1,426) = 7.419, p = .111; cases χ2 (4, N = 1,174) = 5.505, p = .644).
Table 1. Sample Composition by Grade and Sex in the Two Groups Compared

The group of school children had a balanced number of boys and girls, whereas there were more boys than girls in the cases group (the proportion was practically 2:1). We anticipated that finding since the proportion of boys to girls who exhibit attention problems has been estimated at 2.5:1 in the Spanish population (Cardó & Servera-Barceló, Reference Cardó and Servera-Barceló2005). As far as grade, in second grade there were many more boys in the cases group than the school children group, and in sixth grade the opposite was the case.
Instruments
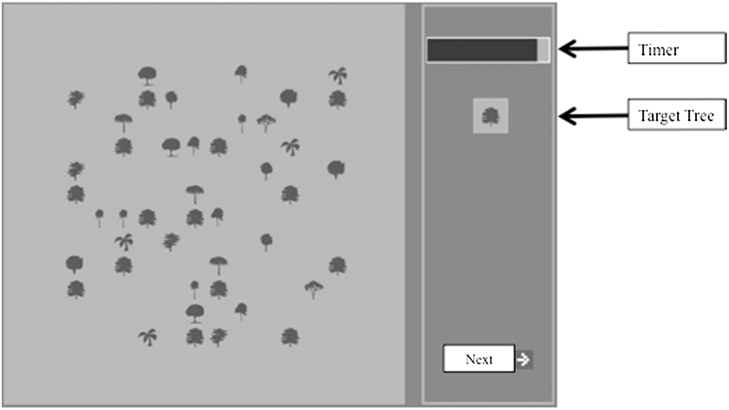
The DiViSA test (Santacreu et al., Reference Santacreu, Shih and Quiroga2011) was used to measure attention. It consists of eight screens, or items, like the one presented in Figure 1. The target, or model, tree changes from screen to screen. On each screen, there are 14 model trees to find, and 30 trees differing from the model. The first item is just for training, to ease task comprehension and mouse handling, so results on it are not computed. The respondent continues on to the next screen when s/he believes s/he has located all the trees that match the model, without expecting the time allocated to each item (60 seconds) to run out. Anytime the respondent clicks on a tree, it disappears if indeed it matches the model (target) tree.
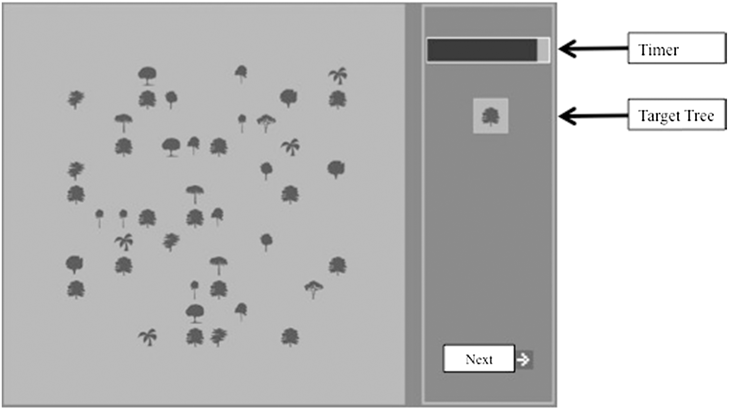
Figure 1. Screen With a DiViSA Test Item.
The test gives five scores: 1) the global attention index (GAI) measures efficiency (speed of correct task execution); 2) number of commission errors (CE) captures when lack of attention leads to inaccuracy or imprecision; 3) number of omission errors (OE) measures lack of sustained attention independently of time; 4) task organization index (TOI) records the order in which the search takes place; and 5) the distraction-hastiness index (DHI) reports whether inattention is the result of distraction (spending time on other stimuli) or hastiness (responding so fast they err).
Attention scores on the DiViSA had acceptable reliability (GAI α = .95; CE α = .86; OE α = .77). Convergent validity was computed by finding the correlation between the DiViSA GAI and total correct responses on the Faces Test (r = .647), the total number of symbols processed on the d2 (r = .590), and total correct responses on the d2 (r = .574) (Lozano et al., Reference Lozano, Capote and Fernández2015).
Data Analysis
To determine the DiViSA’s sensitivity and specificity, we created a ROC curve. However before doing so, we applied discriminant function analysis (DFA) to find the function that best differentiates between groups, for the total sample and also by grade. DFA classifies k groups after identifying linear combinations of predictor variables that maximize the predictive power of functions that discriminate between groups. This yields k-1 discriminant functions. Each combination of variables, or discriminant function, has a discriminant or predictor score that maximizes the proportion of between-groups variability to within-groups variability. The predictor variables considered were the five scores given by the DiViSA. The criterion variable was which group a participant belonged to: school children versus cases. Discriminant function analyses were performed using a step-wise procedure for variable inclusion (forward selection). The cut-off points to include or remove variables in DFA were F > 3.84 and F < 2.71, respectively.
All analyses were conducted using the SPSS 22 statistical package and used p = .01 as the cut-off to reject the null hypothesis.
Results
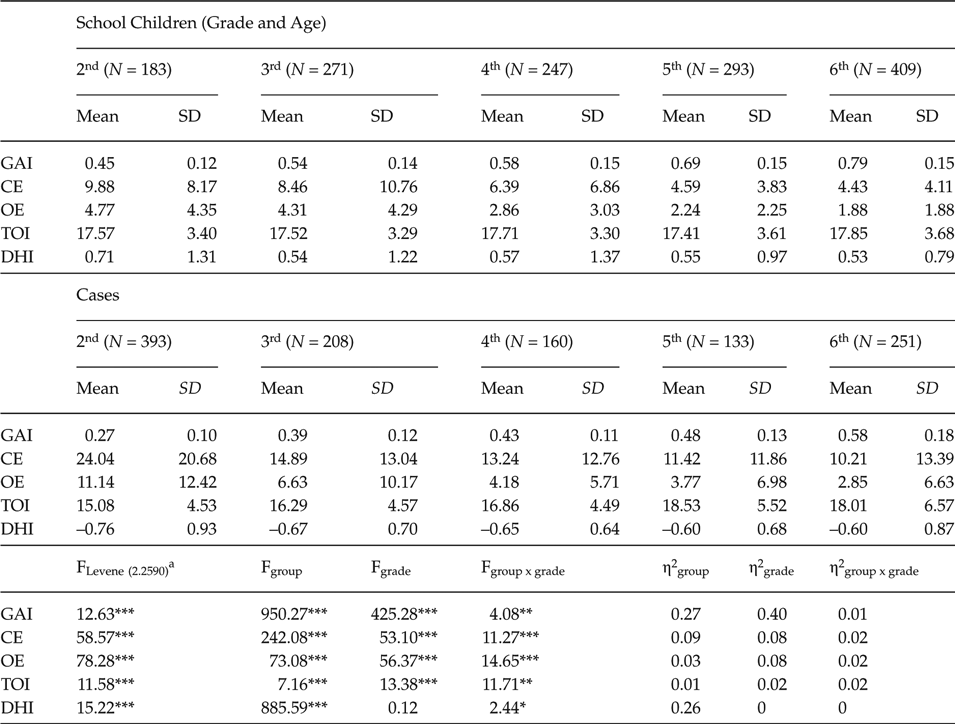
Table 2 displays means and standard deviations on each DiViSA variable for each group and grade, along with contrast statistics and effect size scores. None of the variables analyzed was normally distributed, nor was there homogeneity of variance between groups. However, neither of those factors affected our results, because the analysis used (ANOVA) is robust even when neither of those two assumptions is met when groups are as large as in the present case (Horsnell, Reference Horsnell1953; Lix, Keselman, & Keselman, Reference Lix, Keselman and Keselman1996).
Table 2. Means and Standard Deviations for Each Variable, Group, and Grade, as well as Contrast Statistics
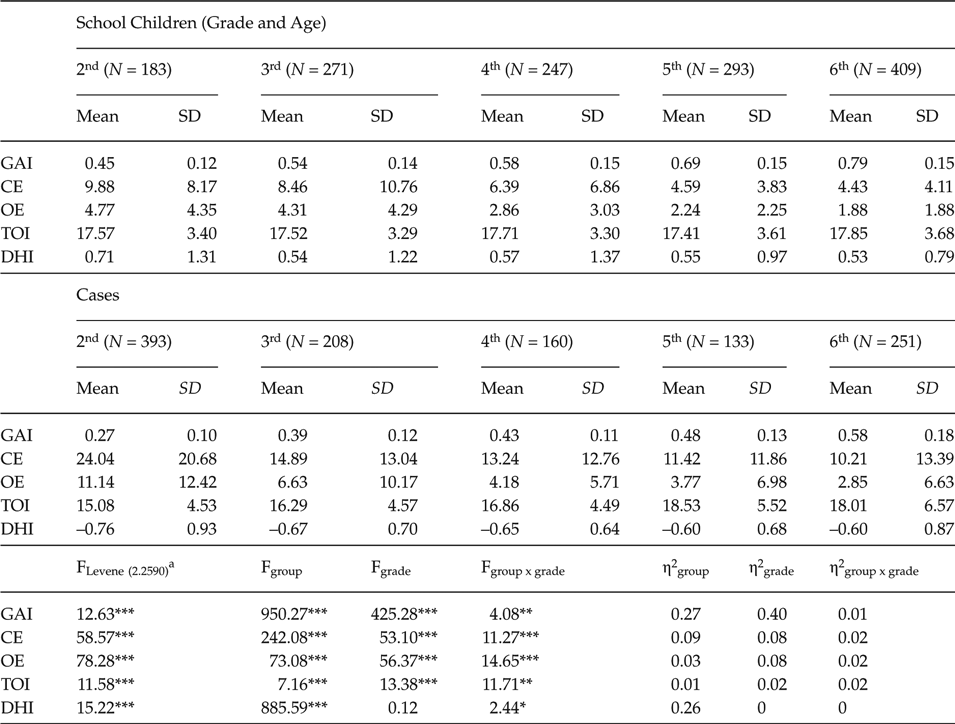
* p < .05; **p < .01; ***p < .001; aFor the variable DHI, there were 9.2518 degrees of freedom.
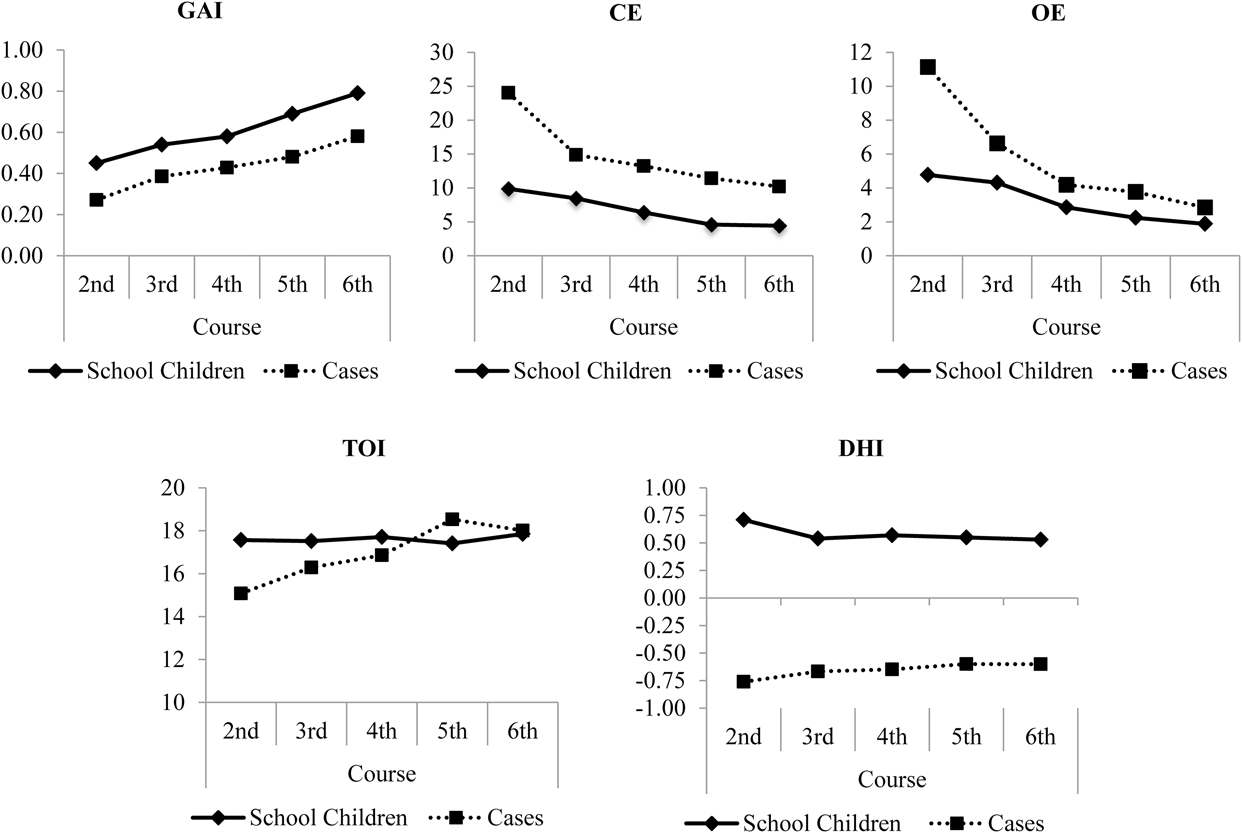
The results displayed in Table 2 convey that the two groups differed on all variables in the age range we studied (second to sixth grade). Altogether, the group of school children had higher GAIs (d = 1.27), fewer CEs (d = –0.77) and OEs (d = –1.45), higher TOIs (d = 0.18), and a positive DHI (d = 1.58). Figure 2 shows each group’s developmental profile in terms of the five DiViSA scores. These results support the need to analyze – taking a multivariate approach – what combination of variables best discriminates between groups at each age by applying the corresponding discriminant function analyses.
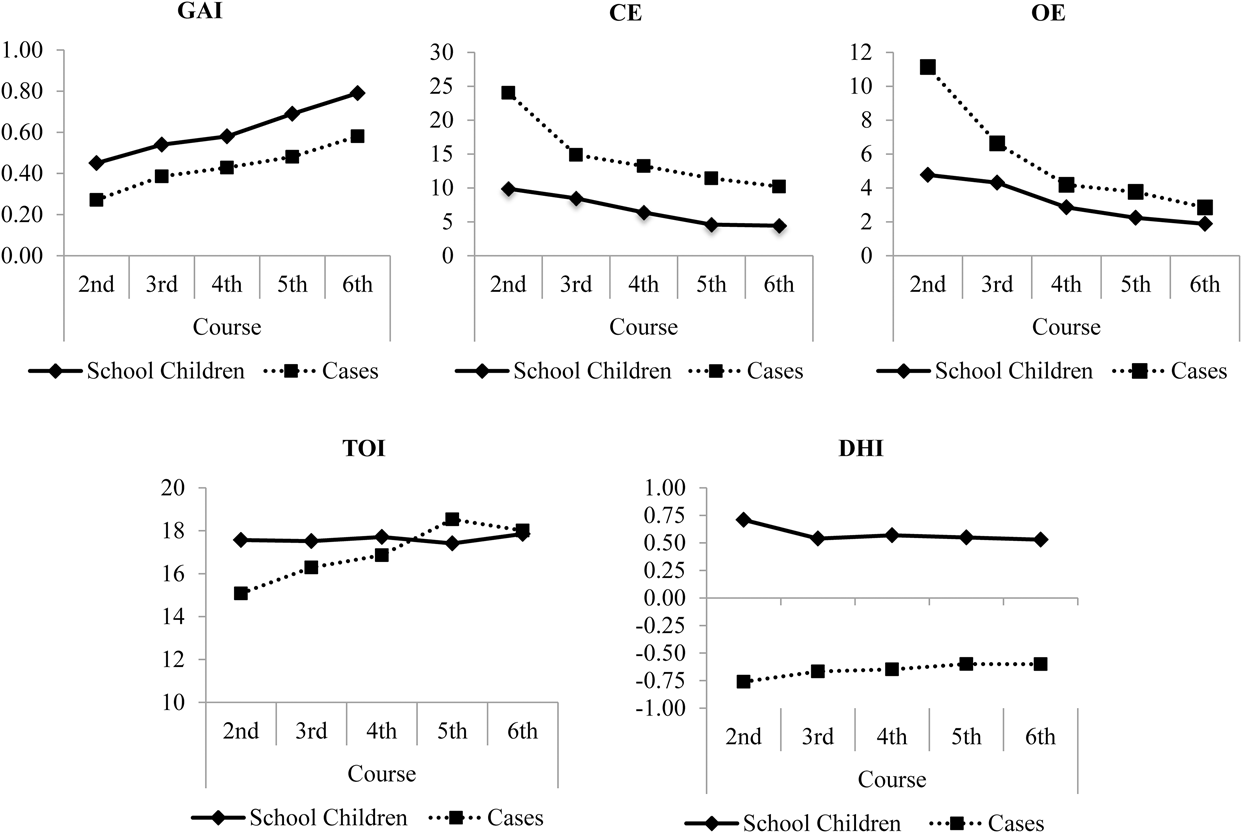
Figure 2. Each Group’s Developmental Profile (School Children vs. Cases) and Grade, Separated by DiViSA Score.
First we tested the two assumptions of discriminant function analysis (DFA; correlation between mean and variance, and no redundancy between predictor variables) that pose a meaningful threat to significance testing in DFA (StatSoft, Reference StatSoft2013). We did this analysis in the full sample as well as separately by grade. In both cases, means and variances correlated, and not only in the cases group, but in school children, too. Since it occurred in not just one group (presumably due to extreme cases) but in both of the groups studied, one can reasonably assume the differentiation between groups was not due to extreme cases in just one group (which would undermine the significance of the differentiation observed). Regarding the lack of redundancy between predictors, tolerance values (1– R2) were over .810 for each and every variable, in the total sample and by grade, ensuring that all five variables contribute some amount to total variance.
Second, we conducted DFA in the total sample. This analysis was conducted on the 2,528 participants who made commission errors (38 school children and 33 cases made none). DHI cannot be calculated for a child who makes no commission errors.
We found a canonical correlation of r = .710. The resulting discriminant function χ2(3, N = 2528) = 1,771.950, p < .001 clearly differentiated (86% of the time) school children from cases. In standard values, that function was: 0.546 GAI + 0.748 DHI – 0.176 CE. The groups’ centroids were 0.915 in school children, and –1.112 in cases.
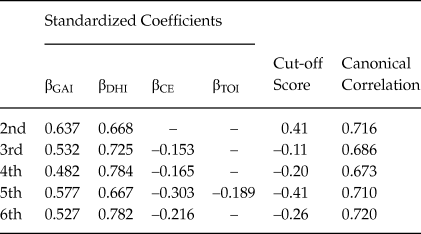
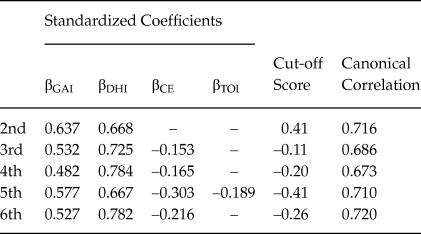
Third, we conducted discriminant function analysis by grade. These results, too, give a statistically significant discriminant function [2nd: χ2(2, N = 571) = 407.491, p <.001; 3rd: χ2(2, N = 470) = 296.127, p < .001; 4th: χ2(2, N = 406) = 242.440, p < .001; 5th: χ2(2, N = 424) = 295.096, p < .001, and 6th: χ2(2, N = 657) = 477.341, p < .001] that correctly classifies 89%, 84%, 84%, 89%, and 91% of cases in each grade, respectively. In the youngest group (second grade), CE did not contribute to differentiating between groups. Also, TOI made a significant contribution to differentiating between groups in fifth grade, but not in other grades.
Table 3 lists standardized beta coefficients, canonical correlation, and cut-off score for each grade. In every grade, scores below the cut-off indicated a high probability of functioning like children in the group with poor performance and possible attentional problems. The groups’ centroids, by grade, were as follows: 2nd: school children 1.507, and cases –0.694; 3rd: school children 0.837, and cases –1.055; 4th: school children 0.731, and cases –1.124; 5th: school children 0.681, and cases –1.490; and 6th: school children 0.809, and cases –1.326.
Table 3. Standardized Coefficients, Cut-off Score, and Canonical Correlation in Each Grade
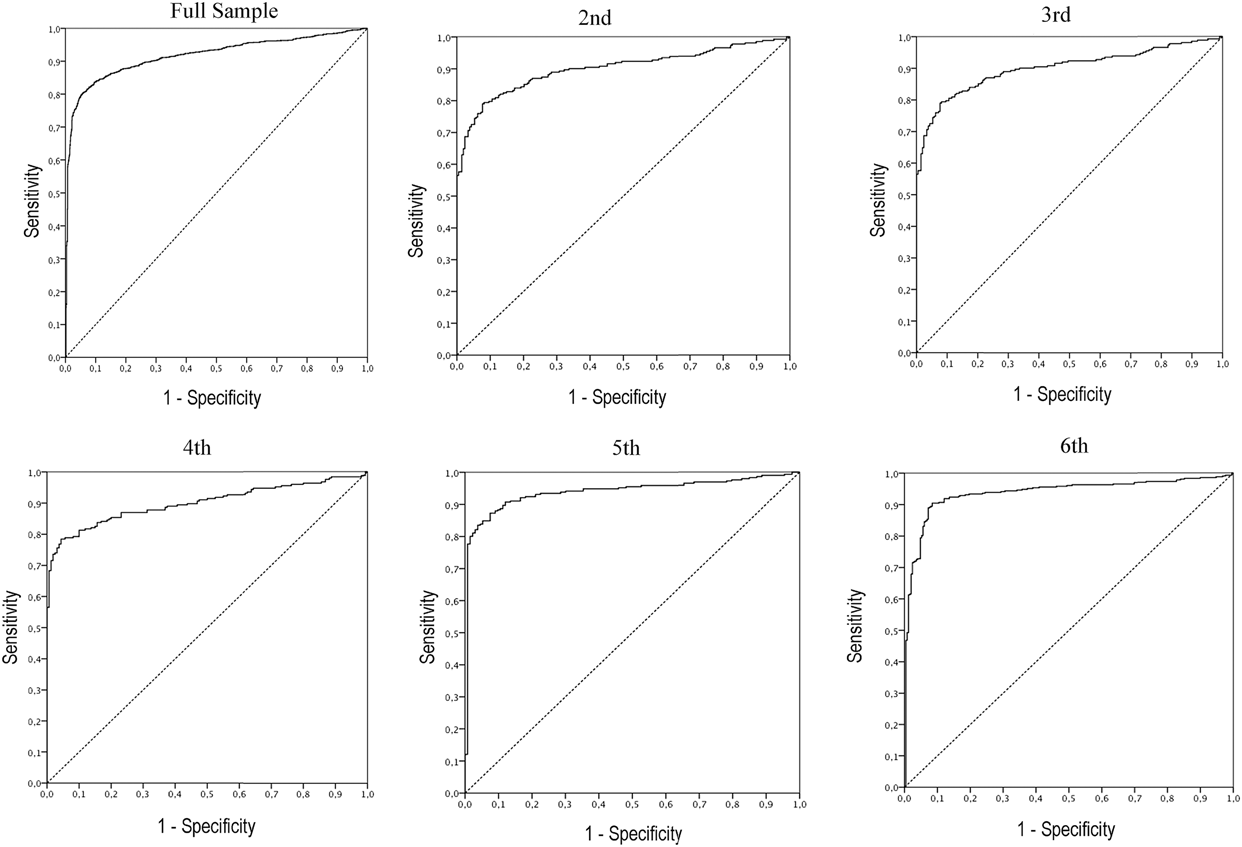
Using the discriminant scores gathered in the DFAs above, ROC curves were charted for the full sample and for each grade. Figure 3 visually represents the DiViSA’s sensitivity versus specificity in the full sample (ROC curve: area (A) = 0.907, standard error (SE) = 0.006, and 95% confidence interval (CI): .895 to .919) and in each grade (2nd: A = 0.922; SE = 0.014, and 95% CI: .895 to .949; 3rd: A = 0.900; SE = 0.015, and 95% CI: .871 to .929; 4th: A = 0.900; SE = 0.016, and 95% CI: .869 to .931; 5th: A = 0.939; SE = 0.013, and 95% CI: .914 to .963; 6th: A = 0.937; SE = 0.010, and 95% CI: .917 to .957). Sensitivity and specificity data, as well as positive and negative predictive values, appear in Table 4 as percentages.
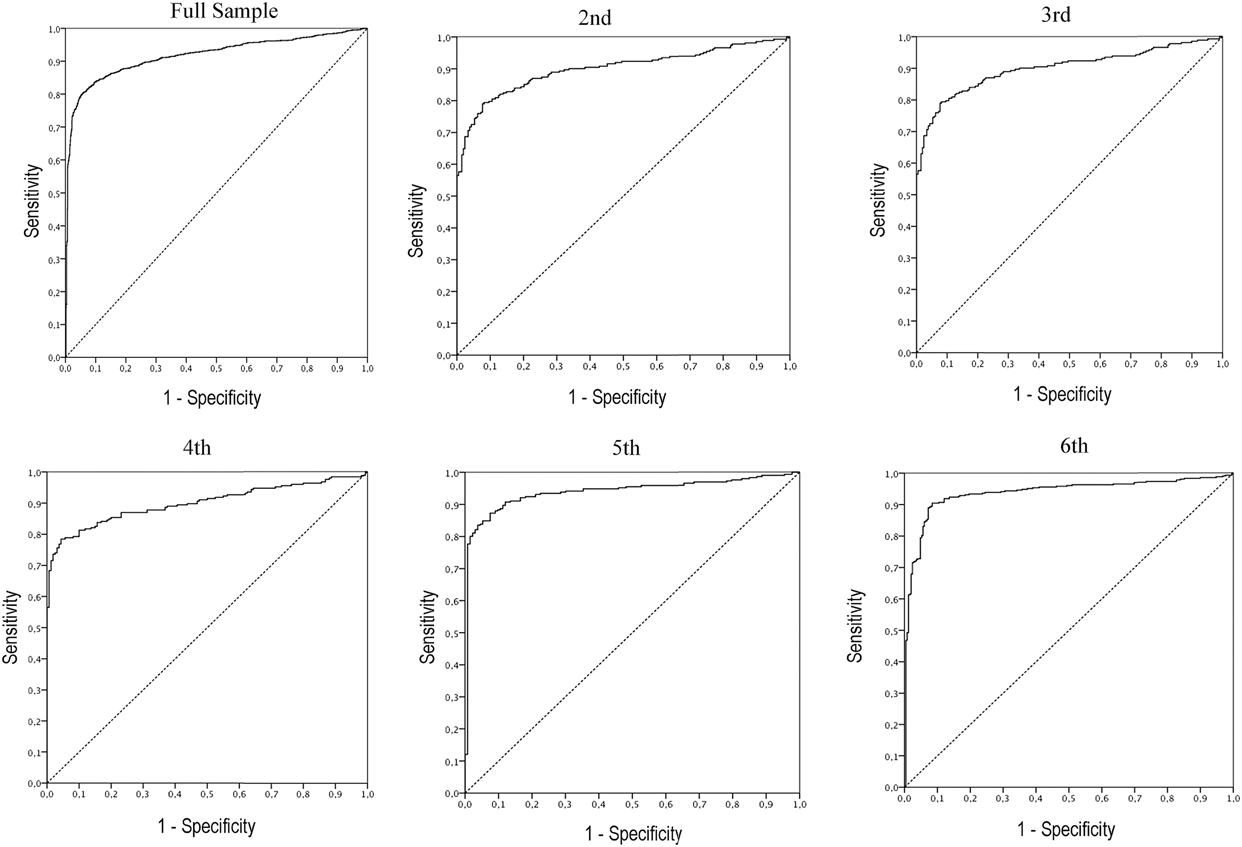
Figure 3. Visual Representation of the DiViSA’s Sensitivity vs. Specificity (ROC Curve) for the Full Sample and for Each Grade.
Table 4. Sensitivity, Specificity, False Negatives, False Positives, and Positive and Negative Predictive Power in Each Grade

Note: acases classified as school children; bschool children classified as cases; cprobability of having an attentional disorder if the participant’s discriminant score is below the cut-off dprobability of not having an attentional disorder if the participant’s discriminant score is above the cut-off.
Sensitivity and specificity indexes were high in all grades. They were also quite even, except in fourth graders, whose rate of false positive errors (detected attention problems where there were none) was high, while their rate of false negatives (detecting good functioning in a child with attention problems) was rather low.
Discussion
First of all, this study’s results show clearly differential performance on a test of selective attention in children with low school performance and suspected attention disorder versus children of the same age (same grade in school) with typical development. Those differences are mainly less efficient distribution of attention (GAI), a higher number of errors (commission (CE) as well as omission (OE)), lower task organization – especially in younger participants – and errors due to hastiness. Interestingly, DHI is one score that did not differ at the mean level from 6 to 7 years old (second grade) or 11 to 12 years old (sixth grade), suggesting it captures qualitative differences rather than trends in maturation. But what is really interesting is to see those qualitative differences unfold in every single group studied – but in opposite directions: for school children in every grade, scores reflected distraction, while for cases in every grade, scores reflected hastiness. In other words, response times were lower when errors occurred, and higher when they answered correctly. Negative scores indicative of hastiness were, beyond a doubt, due to lower response times when they erred, not to longer response times when they answered correctly. Previous studies have demonstrated that when they answer correctly, response times do not differ in children with low school performance and poor attention levels versus typical development (Wilding, Pankhania, & Williams, Reference Wilding, Pankhania and Williams2007). Here the cases group showed more hastiness than the school children, which is consistent with numerous studies that have reported an association between attention problems and response inhibition difficulties (for a review, see Mullane & Klein, Reference Mullane and Klein2008). This aspect does much to clarify what is happening for most children with attentional difficulties: their errors are the fruit of hastiness, not distraction. As Wilding et al. (Reference Wilding, Munir and Cornish2001) suggest, it is very important to determine what commission errors actually mean. The present study was able to clearly establish that they were due to hastiness.
Differences in DiViSA performance in the two groups we compared could be due to differences in intellectual ability, one aspect the present study could not measure. Obviously it would be advantageous to analyze how differential ability contributed to the performance gap we observed between the different groups on the DiViSA. However, some earlier data minimize the explanatory power of differences in ability: (1) Wilding et al. (Reference Wilding, Pankhania and Williams2007) evaluated mental ability in two groups of children 8–10 years old (third to fifth grade) with different attentional abilities (above and below the median on a scale that tests for the nine DSM-IV symptoms). They used the British Picture Vocabulary Scale and found an average difference in IQ of just five points (d = 0.20) between groups with good versus poor levels of attention (favoring those with good levels of attention). (2) Naglieri, Goldstein, Iseman, and Schwebach (Reference Naglieri, Goldstein, Iseman and Schwebach2003) evaluated two clinical groups of children 8–12 years old (third to sixth grade), one diagnosed with ADHD and one with anxiety and/or depression. Their scores on the WISC-III did not differ, but their scores on the Planning subtest of the Cognitive Assessment System (CAS) did. With that in mind, it is unlikely that the differences observed between the two groups in this study were due to differences in intelligence.
Secondly, through multivariate analysis of what variables best differentiated cases from school children at each age (standardized beta scores appear in Table 3), we discovered that in all grades, the best linear combination that differentiated them was efficiency in attentional performance (GAI) plus the distraction-hastiness index (DHI). From second to sixth grade, these children with performance issues and a possible disorder of attention displayed very inefficient attentional performance (few correct responses for the time they spent), with errors stemming from hastiness (lower average response time for errors than correct responses), rather than distraction. Furthermore, commission errors contributed to the groups’ classification differently depending on children’s grade in school. In the youngest participants, the imprecision or inaccuracy these errors suggest is typical of immaturity (age), not of a possible attention deficit. Second-graders (6–7 years old) are inaccurate and imprecise, so a potential diagnosis of attention deficit should not rest on that variable (the CE variable should not be part of the equation). Nevertheless, children’s precision improved considerably after second grade in the present study. At that point, commission errors became an important indicator of possible attention deficit, because school children with typical development make very few of them at that age. Very few studies have analyzed performance in different age groups on a test of selective attention and separated out the different scores. One such study was conducted by Wassenberg et al. (Reference Wassenberg, Hendriksen, Hurks, Feron, Keulers, Vles and Jolles2008) in a sample of 451 children 7–13 years old, using the d2 Test of selective attention. In that study, results showed a considerable improvement in commission errors up to fourth grade (9–10 years old).
On the contrary, the variable omission errors did not differentiate cases from school children with typical development in any age group. This result is very likely related to task ease such that on average, children in the cases group from second to sixth grade (6–12 years of age) made no more omission errors than school children in the same grades. A study by Wassenberg et al. (Reference Wassenberg, Hendriksen, Hurks, Feron, Keulers, Vles and Jolles2008) yielded similar results: most participants (73%) made very few omission errors (1–3%).
With regard to the Task Organization Index (TOI), the results from discriminant function analyses revealed it was important to include TOI to differentiate between cases and school children, but only at ten years old. This result was beyond unexpected, considering that variable’s sign in the equation (see Table 3). The discriminant equation indicates that at 10 years old, cases have a higher TOI on average than school children. That finding is hard to interpret considering the only previous study of task organization development using visual search showed clear improvement in organization with age between 2 and 17 years old (Woods et al., Reference Woods, Göksun, Chatterjee, Zelonis, Mehta and Smith2013). Nonetheless, an element of this study’s data warrants further consideration: organization improved with age in the cases group, but not in school children. In other words, in the cases group, organization of task execution improved across development, while in the typical development group, it showed qualitative differences. Therefore, it may be that better organization in children in the cases group at age 10 reflects a tendency to carry out tasks top-down as well as right to left – “over-learning” – and not to each child’s individual style.
Third, sensitivity and specificity data obtained on the DiViSA test (0.88 and 0.85, respectively) were equivalent to those on Continuous Performance Tests (CPTs), like the TOVA (Test of Variables of Attention; Greenberg, Kindschi, Dupuy, & Hughes, Reference Greenberg, Kindschi, Dupuy and Hughes2007) with its sensitivity of 0.80 and specificity of 0.80, or the Conners CPT with its sensitivity of 0.87 and specificity of 0.86 (Strauss et al., Reference Strauss, Sherman and Spreen2006). On the TOVA and the Conners CPT, those data came from comparing children without attention deficit symptomatology (usually school children) and children diagnosed with attention deficit disorder – with or without hyperactivity. It is noteworthy, therefore, that this study obtained similar indices considering the cases sample was not comprised of not previously diagnosed cases of ADHD, but of cases of potentially trying to rule out attention deficit. That is an endorsement of the DiViSA’s predictive validity. In addition, it is the first time the sensitivity and specificity of a Visual Discrimination Test of attention are being analyzed (so far that has not been done for the d2, Faces Test, and TEA-Ch), which will make it easier for clinicians, accustomed to managing these indices and using CPTs, to use the DiViSA with the same guarantees.
In addition, this study calculated sensitivity and specificity, as well as predictive power (positive or negative), in each grade in school separately, so school psychologists now have access to that developmental data. Test outcomes in all grades were as good or better than on other instruments, but in the oldest group they were excellent. This study’s approach – determining sensitivity and specificity data by age group, was a novel idea that built on Santostefano’s (Reference Santostefano1978) research on attention over the course of development. That author suggests that different facets of attention (distraction, concentration, haste) are not linearly input into the child’s developmental process, so statistical calculations to test instruments’ diagnostic efficacy should be applied in different age groups, as in the discriminant analyses carried out in this study. The data we collected indicate sensitivity above 80% (81–93%) and specificity over 78% (79–90%). In all grades, the DiViSA shows greater sensitivity than specificity, data which are certainly due to potentially varied causes of low performance that may have been included in the cases group. That being said, in the only DiViSA study to include a group diagnosed with ADHD (Santacreu et al., Reference Santacreu, Shih and Quiroga2011) and compare it to a group of school children with typical school performance, data suggested higher specificity than sensitivity. The DiViSA’s indices of predictive validity are certainly laudable.
To summarize, the ability of DiViSA scores to measure attention in children, and their connection to overall performance, are unquestionable given the test’s consistency with the data we already had about ADD, and given its sensitivity and specificity in diagnosis. The advantage of administering it in computerized form online, and getting immediate results, was an added bonus (Etchepareborda, Paiva-Barón, & Abad, Reference Etchepareborda, Paiva-Barón and Abad2009). Scores on these measures of organization (TOI) and hastiness (DHI) provide important indications for a treatment plan to alleviate the effects of the deficits or developmental delays these children may exhibit.
The Psi+D research group, for their help developing the computerized test.


