INTRODUCTION
Tropical plantations cover large areas and are often located in biodiversity-rich regions of the globe (Barbosa et al. Reference BARBOSA, BENATO, CAVALHEIRO and TOREZAN2009, Chapman & Chapman Reference CHAPMAN and CHAPMAN1999, Myers et al. Reference MYERS, MITTERMEIER, MITTERMEIER, FONSECA and KENT2000). Several studies have emphasized that afforestation in degraded land or agricultural land will ameliorate succession by native species (Guariguata et al. Reference GUARIGUATA, RHEINGANS and MONTAGNINI1995, Harvey Reference HARVEY2000, Raman et al. Reference RAMAN, MUDAPPA and KAPOOR2009, Teegalapalli et al. Reference TEEGALAPALLI, HIREMATH and JATHANNA2010). However colonization can be complex depending on the type of plantation, the location and the overall richness of the region along with the facilitative role of plantation trees to attract forest seeds through frugivore activity (Hartley Reference HARTLEY2002, Hunter Reference HUNTER1990, Lugo Reference LUGO1997, Norton Reference NORTON1998, Parrotta et al. Reference PARROTTA, TURNBULL and JONES1997).
Most studies of colonization are restricted to tree plantations and only a few to shrub monocultures like coffee (Arellano et al. Reference ARELLANO, FAVILA and HUERTA2005, Armbrecht et al. Reference ARMBRECHT, PERFECTO and VANDERMEER2004, Komar Reference KOMAR2006, Pineda et al. Reference PINEDA, MORENO, ESCOBAR and HALFFTER2005, Ricketts et al. Reference RICKETTS, DAILY, EHRLICH and FAY2001, Williams-Guillén et al. Reference WILLIAMS-GUILLÉN, McCANN, MARTÍNEZ SÁNCHEZ and KOONTZ2006). Unlike coffee and cardamom, tea (Camellia sinensis (L.) O. Kuntze. (Theaceae)) is a tree maintained as a shrub with a dense continuous short canopy that precludes any large-frugivore activity. It may however facilitate understorey frugivores to visit these plantations and help in colonization of some forest species. This again can limit the kind of plant species that are dispersed into the tea.
In some tea plantations, shade trees (Albizia spp., Erythrina spp., Grevillea robusta A. Cunn. ex R.Br.), planted in varying densities for shade, may serve as foci of dispersal for canopy frugivores including bats. However, the importance of distribution and density of such shade trees to colonization by forest species is not clearly understood. Further, the interaction between shade tree dispersion and forest proximity that may be crucial in the eventual colonization of abandoned areas by forest species is also unknown. In this study we determine how managed tea plantations with different density of shade trees and without shade trees facilitate immigration of forest species from surrounding forest to the plantations. More specifically we test the following hypotheses: (1) Seed input, species compositions and dominance vary with density of shade trees; (2) Distance from the forest is inversely related to seed input and seed compositions in the plantations; and (3) Seeds that arrive in the plantations from the forest differ in their dispersal modes across shade tree densities and distance from forest.
METHODS
Study area
The study was carried out from April 2008 to March 2009, within a 350-ha tea plantation (8.55°–8.54° N, 77.35°–77.37° E) located in the Kalakad Mundanthurai Tiger Reserve (KMTR), which is part of the Agasthyamalai range (Ramesh et al. Reference RAMESH, MENON and BAWA1997). The study area receives both south-west and north-east monsoons. The sampling was timed based on before the south-west monsoon (April–May), after the south-west monsoon (September–October) and after the north-east monsoon (February–March). The mean maximum temperatures ranged from 17°C to 28°C, the minimum temperatures ranged from 14°C to 19°C and annual rainfall ranges from 800 to 4000 mm (Ganesh & Davidar Reference GANESH and DAVIDAR1999). The primary rain forests are dominated by Cullenia exarillata, Aglaia bourdillonii and Palaquium ellipticum (Ganesh et al. Reference GANESH, GANESAN, DEVY, DAVIDAR and BAWA1996), while along forest edges early-successional species such as Elaeocarpus spp., Mallotus tetracoccus, Macaranga peltata, Maesa indica and Clerodendrum viscosum are common (unpubl. data).
Sampling design
Grevillea robusta is the main shade tree used in the tea plantations. These are planted in three density categories across the plantations. We categorized them as continuous shade tree (CST): between 35 to 40 trees ha−1; isolated shade trees (IST): fewer than 3 trees ha−1; and without shade trees (WST): plantations without any shade trees. These plantations (i.e. plantation types) are separated by windbreak corridors that are either linear patches of natural forests or Eucalyptus trees (Figure 1a). We estimated forest species richness and seed abundance in the plantation types using 10 × 10-m plots within which four 1 × 1-m subplots were nested in the four corners of the larger plot (Figure 1b, c). The plots were located at 0 m (forest), 25 m, 60 m and 95 m from the forest to the centre of the plot along a transect (Figure 1b). A total of seven transects were laid in each plantation type separated by a minimum distance of 500 m.

Figure 1. Schematic diagram showing the plantations (dotted) and surrounding forest (hatched) (a); a linear transect with four fixed distance intervals, each represented by a 10 × 10-m plot (b); 1 × 1-m subplot at each corner of the plot (c).
Surface soil was collected within the 1 × 1-m subplots. Large litter including leaves and twigs was removed manually and soil was passed through sieves of different pore sizes (0.5 cm2 and 1.0 cm2). Seeds were collected and identified by comparing with reference collections and local flora (Gamble & Fischer Reference GAMBLE and FISCHER1915–1935). Unidentified seeds were preserved for later identification.
Seeds of each species collected from the surface soil were classified into dispersal modes based on our field observations and literature on seed dispersal modes from the same forest (Ganesh & Davidar Reference GANESH and DAVIDAR2001). Seeds were classified into six dispersal modes: bird (B), bat (Bt), mammal (excluding bats) (M), bird–mammal (dispersed by both birds and mammals) (BM), bat–other mammals (dispersed by bats and other mammals like civets) (BtM) and passive (wind/gravity dispersed) (P).
Data analysis
Species richness was estimated as the cumulative number of species in the 10 × 10-m plots. Abundance of seeds was pooled from the four subplots within the 10 × 10-m plots. Kruskal–Wallis non-parametric ANOVA was used to test differences in abundance and species richness across the plantation types with distance as a constant factor followed by Wilcoxon test for pairwise comparison whenever the Kruskal–Wallis ANOVA yielded significant result (Zar Reference ZAR1999).
Since seeds were collected from equal numbers of plots at four distance classes within three plantation types, we estimated the mean species richness (± SD) through individual-based Coleman's rarefaction method (Gotelli & Colwell Reference GOTELLI and COLWELL2001). Further, cumulative species richness was tested by using the rich package (Rossi Reference ROSSI2011), to estimate species richness of seeds among distance classes within each plantation type.
Species composition and dominance
Similarities in the community composition across the three plantation types (i.e. CST, IST, WST) within four distance (i.e. 0, 25, 60, 95 m) intervals were examined using single linked clustering (van Tongeren Reference VAN TONGEREN, Jongman, ter Braak and van Tongeren1987). Similarity distances were expressed as the Bray–Curtis index, where similarity of 0% means nothing is common between the two distance classes and 100% means that all the species are common to the two distance classes.
Two-factor permutational multivariate ANOVA with plantation types and distance intervals as two independent factors was used to test the differences among species composition of seeds. This was done only within plantations and forest was excluded as species composition in plantations is expected to be a subset of forest. This test is ideal in a situation where the data sets represented multiple response variables (species) and multiple objects (transects observations) (Anderson Reference ANDERSON2001). Moreover, PERMANOVA can handle large multiple species data sets containing more species than replicates with the matrix having numerous zeros (McArdle & Anderson Reference McARDLE and ANDERSON2001). For this analysis, the species composition matrix was standardized by row totals, and Bray–Curtis distance measure was used as the basis with 9999 permutations. Pairwise comparisons based on Monte-Carlo (MC) randomization with 4999 permutations were performed to test for differences among the plantation types. The species dominance in forest, each plantation type and across the distance class was done using the rank-abundance curve.
Dispersal modes
The seed abundances in each dispersal mode were compared across four distance classes and in each plantation type, using non parametric Kruskal–Wallis ANOVA. Since bat (Bt), mammal (M) and passive (P) modes were not represented in all the distance intervals, they were excluded from the analysis.
All the analyses were done using free statistical software R 2.12.1 (R Development Core Team) except community composition analysis which was done using PERMANOVA (Anderson Reference ANDERSON2001).
RESULTS
Species richness and abundance of seeds
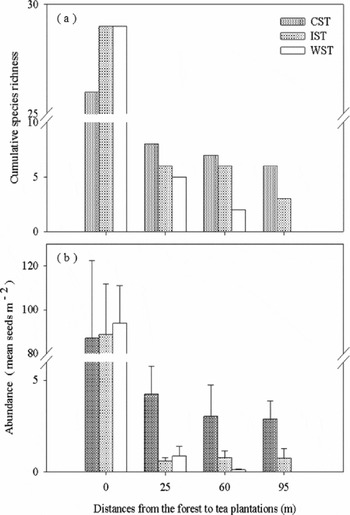
A total of 39 species and 7916 seeds were recorded within the 21 transects (84 plots) across the three different plantation types and adjacent forests (Appendix 1). The variation of species richness and abundance across the plantation types are shown in Figure 2. Forest had 3–4 times more species than CST and IST respectively and 6–14 times more than WST (Kruskal–Wallis; χ2 = 8.39, df = 2, P = 0.01), Within plantations, species richness in CST was not very different from IST (Wilcoxon test; W = 9, P > 0.05), but was much higher than in WST (W = 0, P < 0.05). Similarly seed abundance in forest was 27 times more than in CST, 128 times more than in IST and nearly 500 times more than in WST. CST also had 3–7 times more seeds than in IST and almost 28 times more than in WST. These differences are overall significant (Kruskal–Wallis: χ2 = 10.5, df = 2, P = 0.005) in WST vs CST (Wilcoxon test, W = 0, P < 0.01) and IST vs CST (W = 1, P < 0.05) but not between IST and WST (W = 0, P > 0.05).

Figure 2. Cumulative species richness (a) and mean seed abundance ± SE (b) across the three plantation types, where 0 m is forest and the rest are distances from the forest to the interior of tea plantations, * P < 0.05, ** P <0.001.
Cumulative species richness across forest and plantation showed significantly higher number of species in forests compared with in the plantations even at different distances from the forest (Table 1), whereas within the plantations species richness did not vary significantly among the distance intervals (Figure 2a).
Table 1. Comparisons of difference in cumulative species richness between various distance intervals at 95% confidence level using ‘rich’ (R package). The values indicate differences in species. * P < 0.001, NS: not significant, NC: not computable, NA: not applicable.

Further Coleman's individual-based rarefaction analysis also revealed that species numbers at distances of 60 m and 95 m got saturated with 50–60 seeds in CST, whereas in IST saturation happened in the 95-m distance interval with about 15 seeds. At other distance intervals in CST and IST no saturation was seen. In WST species numbers keeps increasing at 25-m and 60-m intervals (Figure 3).

Figure 3. Estimated species richness by Coleman's individual based rarefaction in different plantation types and within each distance interval. Continuous shade tree (a); isolated shade tree (b); without shade tree plantations (c).
Species composition
The non-parametric MANOVA indicates that the species composition across plantation types was different (F = 3.02, df = 2, P(MC) = 0.002) but not across distance within the plantations (F = 1.88, df = 2, P(MC) = 0.08). Interaction between plantation type and distances did not show a change in species composition (F = 0.83, df = 4, P(MC) = 0.66), which is further confirmed by the Bray–Curtis similarity analysis (Figure 4). Further, pairwise comparisons among the plantation types were all significant; CST and IST (t = 1.51, P = 0.04); CST and WST (t = 1.98, P = 0.005) and IST and WST (t = 1.69, P = 0.03). In general forest, CST and IST were distinct while WST was highly dissimilar from the rest.

Figure 4. Dendrogram of the three plantations sampled at fixed distances. Cluster distances were calculated with the Bray–Curtis similarity index (single link) for the species composition and abundances; CST: continuous shade tree, IST: isolated shade tree and WST: without shade trees are the plantation types and F0 is forest. Within each plantation type, T25 = 25 m inside the plantation from the forest, T60 = 60 m inside the plantation from the forest and T95 = 95 m inside the plantation from the forest.
Species dominance
The species dominance changed from forest to plantation, but was remarkably constant across distance. In forest Acronychia pedunculata was the dominant species followed by Elaeocarpus munronii while in plantations E. munronii and Elaeocarpus serratus were the most common species. Within the plantation types, there was variability in the second dominant. In CST, even though A. pedunculata and E. munronii dominated the forest, it was variable across distance; at 25 m it was E. munronii and E. serratus, at 60 m it was E. munronii and A. pedunculata, and at 95 m it was E. munronii and M. tetracoccus that dominated. In IST even though A. pedunculata, Toddalia asiatica and E. munronii dominated the forest, it was E. munronii and Litsea wightiana that dominated at 25 m, 60 m and 95 m. In WST, A. pedunculata, E. munronii and T. asiatica were the dominant species in the forest, while M. peltata was the dominant species at 25 m and 60 m and no species were recorded at 95 m. In general only E. munronii was the dominant species in all the shade-tree plantations but not so in WST plantations.
Dispersal modes
Dispersal modes that occur at all distance intervals from the forest were used in the analysis. Of the three seed dispersal modes encountered at CST only bird-dispersed seeds varied with distance from the forest but there was no linear decrease with distance (BtM: χ2 = 6.20, df = 3, P = 0.10, BM: χ2 = 0.66, df = 3, P = 0.88 and B: χ2 = 14.2, df = 3, P = 0.002, Figure 5a). Nearly 20% (of that found in the forest) of the BM seeds, 10% of B and less than 5% of BtM seeds reach the plantations at different distances from the forest. In IST, seed abundances also varied across dispersal modes but no linear trend was noted (B; χ2 = 15.1, df = 3, P = 0.001, BM = NS, Figure 4b). In WST, all the dispersal modes declined with distance from the forest and showed a strong negative trend (B: χ2 = 19.9, df = 3, P = 0.0001 and BM: χ2 = 18.3, df = 3, P = 0.0003, Figure 4c).

Figure 5. Proportion of seeds from the total available in the forest found in each dispersal mode across plantation types. Continuous shade tree (a); isolated shade trees (b); without shade trees (c). BtM = bat–other mammal, B = birds, BM = bird–mammal, T25 = 25 m inside plantation from the forest, T60 = 60 m inside plantation from the forest and T95 = 95 m inside plantation from the forest.
DISCUSSION
Shade trees and dispersal limitation
Several factors could influence seed arrival in plantations. These could include, among others, availability of seeds in the neighbourhood, distance of such seed sources, phenology of trees in the surrounding forests, frugivore activity and availability of suitable habitats such as perches or remnant trees (Duncan & Chapman Reference DUNCAN and CHAPMAN1999, Galindo-González et al. Reference GALINDO-GONZÁLEZ, GUEVARA and SOSA2000, Guevara et al. Reference GUEVARA, LABORDE and SÁNCHEZ-RIOS2004, Holl Reference HOLL1998, Reference HOLL2002; Holl et al. Reference HOLL, LOIK, LIN and SAMUELS2000, Martinez-Garza et al. Reference MARTINEZ-GARZA, FLORES-PALACIOS, DE LA PENA-DOMENE and HOWE2009, Zanini & Ganade Reference ZANINI and GANADE2005). In our study shade trees in the plantations was the primary factor to influence species richness and seed abundance. It increased species richness by more than three times and seed abundances by 3–30 times compared with plantations with no shade trees. In other sites, seed abundance under remnant trees was 150 times greater than in sites without perch trees (McClanahan & Wolfe Reference McCLANAHAN and WOLFE1993). In the present site such a large increase is not evident because our sampling was not specific to a shade tree and was spread out in the plantations which only gave an average input of seeds in the plantations. However, even when we compare our sample plots that were directly under shade trees with those away from it, seed input was only 16 times higher clearly indicating that there could be other reasons for low inputs.
The high-elevation wet evergreen forest of southern Western Ghats is limited in the availability of dispersers compared with other wet forest regions (Ganesh & Davidar Reference GANESH and DAVIDAR2001). Although it is a tropical montane area, the frugivore richness is limited to a total of only six canopy and subcanopy species and two understorey species (Ganesh & Davidar Reference GANESH and DAVIDAR1997, H. C. Chetana pers. obs., Raman Reference RAMAN2006). Moreover the shade trees do not have a dense canopy nor provide edible fruits which can attract frugivores directly to the tree (H. C. Chetana pers. obs.). Nevertheless, the facilitative role of shade trees in the tea plantation in attracting canopy frugivores is important in terms of densities of shade trees. Plantations with higher densities of shade trees like CST bring in seven times more seeds than plantations with isolated trees (IST). But isolated trees are also used as stop-overs to richer habitats beyond, with the frugivores thereby dropping seeds leading to comparable species richness in the two plantation types. In contrast the limited dispersal in plantations without shade trees (WST) can be attributed to tea being maintained as a shrub, that attracts only few understorey frugivores such as Eurasian blackbird (Turdus merula), which is more an omnivore, and generalist canopy species like the red-whiskered bulbul (Pycnonotus jocosus) that move inside the tea bushes close to the forest edge and also nest in these bushes. In general it appears that even though frugivore richness is low and dispersal limitation exists even in tea with shade trees, the facilitative role of non-native shade trees is critical in catalysing seed arrival in a frugivore-depauperate region.
Forest–tea landscape
The proximity of forests to tea plantations in increasing seed input depends on the plantation type. In WST and IST (Table 1) species richness marginally decreases with distance from forest as observed in abandoned agricultural land elsewhere in the Western Ghats (Teegalapalli et al. Reference TEEGALAPALLI, HIREMATH and JATHANNA2008, Reference TEEGALAPALLI, HIREMATH and JATHANNA2010) and other (Cubiña & Aide Reference CUBIÑA and AIDE2001). However, no such effect was seen in terms of abundance either in CST or IST, the two shade-tree plantation types. Distance had a negative effect only in WST. Such differences could be due to differential use of trees by frugivore species. Also the forest patches around the tea are separated by < 1 km and frugivores can see forest across the tea-filled space and species such as black bulbul (Hypsipetes ganesa) and pigeon (Ducula badia) fly directly over the tea with an occasional halt at the shade trees (isolated) that can be at variable distances from the forest edge. This could be a reason for fairly uniform seed input in isolated shade-tree plantations away from the forests as these are the major seed dispersers in the region (Ganesh & Davidar Reference GANESH and DAVIDAR1999). Moreover, the rank dominance analysis indicates Elaeocarpus munronii seeds to be the dominant species across all distance classes in the shade-tree tea plantations. These are all dispersed by bulbuls (H.C. Chetana, pers. obs.), which carry seeds from the fruiting trees directly to perches away from the forest and therefore can disperse the seeds at variable distances in plantations and negate any distance effect.
Unlike open pastures, tea plantations are made of closely planted tea plants that give it a closed-canopy appearance with minimum light reaching the floor and are ideal for some understorey frugivores. This microhabitat helps the understorey frugivores to move into the tea from the forest, but they do not venture far from the forest edge leading to the observed distance effect in WST with fairly high seed input at 25 m. The facilitative role of shade trees therefore not only enhances seed input into the tea but also distributes the seed rain more uniformly in the plantations.
Even though a number of dispersal modes are represented in the tea plantations, it is the bird-dispersed and bird–mammal-dispersed seeds that dominate in the tea with shade trees. The ability of shade trees to attract frugivores that bring in a select group of seeds into the tea is interesting in several ways. One of the most vagile frugivore groups in the landscape are birds that use these shade trees and therefore bring in several bird-dispersed species. Moreover, frugivores such as black bulbul (Hypsipetes ganesa) and red-whiskered bulbul (Pycnonotus jocosus) have a tendency to fly away with seeds from the parental trees to a perch in open tea plantations where they either regurgitate or defecate the seeds. In addition even though many species have dual disperser modes such as ‘bird–mammal’ and ‘bat–other mammal’ it is the birds that disperse most of the seeds and a few are dispersed by non-flying mammals such as civets, but they are independent of perch tree availability (pers. obs.). Most of the exclusively bird-dispersed species, like members of the Lauraceae, are large-seeded species and dispersed by pigeons and hornbills (Datta & Rawat Reference DATTA and RAWAT2008, Ganesh & Davidar Reference GANESH and DAVIDAR2001). These are usually fewer in number in the forest (Ganesh et al. Reference GANESH, GANESAN, DEVY, DAVIDAR and BAWA1996), fruit supra-annually (Ganesh & Davidar Reference GANESH, DAVIDAR, Dew and Boubli2005) and therefore rarely get dispersed in plantations even where shade trees are present. Whereas WST species, like Macaranga peltata and Mallotus tetracocca, are small-seeded species which are brought in by the Kerala laughing thrush (Garrulax fairbanki) and red-whiskered bulbul that move a short distance into WST from adjacent forests. Bats do not seem to use the tea plantations as we never encountered any temporary roosts of bats nor were they seen perching on shade trees in the plantations. Bat–other mammal-dispersed species were brought in by civets and bears which are the other dispersers of the seeds. This may be because the current choice of shade trees do not produce bat-edible fruits nor provide adequate cover for bats to roost which are essential for them to visit and use such spaces (Charles-Dominique Reference CHARLES-DOMINIQUE, Estrada and Fleming1986, Gorchov et al. Reference GORCHOV, CORNEJO, ASCORRA and JARAMILLO1993, Medina et al. Reference MEDINA, HARVEY, MERLO, VILCHEZ and HERNÁNDEZ2007, Thomas et al. Reference THOMAS, CLOUTIER, PROVENCHER and HOULE1988) and therefore the ability of bats to help colonize the tea plantations seems limited. Dispersal by wind is also limited as there are only few wind-dispersed species in the forest and adjoining landscape (Ganesh et al. Reference GANESH, GANESAN, DEVY, DAVIDAR and BAWA1996), and only one species was noticed in the WST habitats and one close to the forest.
Establishment of forest trees
Having shade trees within the tea facilitated a 3–30-fold rise in seed deposition from the neighbouring forests compared with places without such trees. The deposition of seeds alone is not enough for successful establishment. The seeds could be predated, the microsite may not be suitable (Dalling & Hubbell Reference DALLING and HUBBELL2002), density- and distance-dependent mortality can occur under the shade trees (Janzen Reference JANZEN1970), seedling and sapling mortality from pathogens and both vertebrate and invertebrate herbivores can limit seed establishment and survival (Chapman & Chapman Reference CHAPMAN and CHAPMAN1999, Holl Reference HOLL2002). However, even assuming substantial loss of seeds and seedlings in the tea to these factors there still remains a chance for some seeds to establish in many of these Grevillea robusta shade-tree plantations.
Since this study was conducted in a conventional tea plantation where tea leaves are plucked and the fields maintained free of weeds, very little regeneration of native species was seen. However, in an adjacent plantation which is organic and no weeding is done there is substantial regeneration of many native species recorded in this study such as Clerodendrum viscosum, Maesa indica, Mallotus tetracoccus, Macaranga peltata, Eleaocarpus serratus, Litsea spp., and large numbers of herbs and climbers (unpubl. data). When the current site was abandoned for 2 y in 1998, similar regeneration was seen (T. Ganesh per. obs.). It therefore appears that though post-dispersal factors may constrain regeneration, seedling survival is more likely to be curtailed by management practices. The low seed input into the tea from the forest is limited by dispersal even in tea with shade trees, the ability for native species to colonize the tea may therefore be a slow process initially until some native fruit-yielding species establish.
The plantations usually have Ficus spp., on steep rocks or planted for religious reasons, that can be excellent foci for frugivore activity even during non-fruiting periods when they can be used as a place to roost and nest. Once this is done, dispersal can speed up as noticed in an abandoned tea plantation where large numbers of native species have taken over the plantations after 17 y of abandonment with shade trees almost gone now (pers. obs.). Therefore as a strategy to recover abandoned areas, retaining shade trees and Ficus spp. found among the rocks and boulders in the area are important for attracting frugivores and facilitating native species colonization. In areas without shade trees we suggest limited bush clearing in the tea and planting pioneer species before the place is abandoned provided other disturbances are curtailed.
ACKNOWLEDGEMENTS
This research was funded by the Rufford small grant UK and Student scholarship from ATREE-NORAGRIC. We thank the Tamil Nadu forest department for permission to conduct the study and Tamil Nadu Electricity Board Upper Kodayar for their logistic support. We thank three anonymous reviewers for their comments on the manuscript. We are grateful to Dr Soubadra Devy for her encouragement and valuable comments both in the field and at the research proposal stage. We thank Dr Ganesan for the use of his herbarium and Mr Ravi Ramalingam for helping us with the R program. We also thank field assistants Tamil Allaghan, Johnson and over two dozen other assistants who helped us with this work.
Appendix 1. List of forest species recorded from surface soil in forests and tea plantations. The locations from where the seeds of each species were collected and their dispersal modes are also given. (F: forest; CST: continuous shade tree; IST: isolated shade tree; WST: without shade tree, Bt: bat, BtM: bat–other mammal, B: bird, M: mammal; BM: bird–mammal; P: wind/gravity dispersed).