INTRODUCTION
Marine microorganisms are integral to all major biogeochemical cycles, fluxes and processes occurring in marine systems. Heterotrophic picoplankton (HPP) (mostly heterotrophic bacteria) and autotrophic picoplankton (APP) (Prochlorococcus, Synechococcus and picoeukaryotes) represent the major components of the marine picoplankton community, especially in oligotrophic areas such as the Adriatic Sea (Chisholm et al., Reference Chisholm, Frankel, Goericke, Olson, Palenik, Waterbury, West-Johnsrud and Zettler1992; Magazzù & Decembrini, Reference Magazzù and Decembrini1995; Li, Reference Li1998; Zubkov et al., Reference Zubkov, Sleigh, Burkill and Leakey2000; Li & Harrison, Reference Li and Harrison2001; Grob et al., Reference Grob, Ulloa, Li, Alarcón, Fukasawa and Watanabe2007).
Heterotrophic bacteria play an important role in aquatic ecosystems through their assimilation of dissolved organic matter to sustain their metabolism and produce new biomass (Cole et al., Reference Cole, Findlay and Pace1988) and by the decomposition of organic matter and through the transformation of inorganic compounds into forms suitable for primary producers (Ducklow et al., Reference Ducklow, Purdie, Williams and Davis1986). Furthermore, APP play a very important role in the community, especially in oligotrophic waters where they make a large contribution to carbon production (up to 90%), biomass and energy transfer (Li et al., Reference Li, Subba Rao, Harrison, Smith, Cullen, Irwin and Platt1983; Stockner, Reference Stockner1988; Campbell et al., Reference Campbell, Nolla and Vaulot1994). In the Mediterranean Sea, the contribution of APP to primary production varies from 31 to 92%, and their impact seems to be more important in oligotrophic waters (71%) compared with the more eutrophic ones (44%) (Magazzù & Decembrini, Reference Magazzù and Decembrini1995).
All these picoplankton groups are consumed by heterotrophic nanoflagellate grazers, which are consumed in turn by larger ciliated protozoa, forming a link to higher trophic levels. Mixotrophy and parasitism are also relevant, but these forms of interaction have been studied only recently (Piwosz et al., Reference Piwosz, Wiktor, Niemi, Tatarek and Michel2013; Unrein et al., Reference Unrein, Gasol, Not, Forn and Massana2014). A function of viral infection is bacterial cell lysis, which retains the lysed organic matter in the microbial food web and renders bacterial production unavailable to higher trophic levels.
APP have been found in a variety of brackish and freshwater systems, including ultra-oligotrophic lakes (Boraas et al., Reference Boraas, Bolgrien and Holen1991), polar and sub-polar lakes (Vincent, Reference Vincent, Whitton and Potts2000) and shallow eutrophic lakes (Vörös et al., Reference Vörös, Callieri, Balogh, Bertoni, Alvarez-Cobelas, Reynolds, Sanchez-Castillo and Kristiansen1998). Some studies reported an inverse relationship between the APP contribution to total carbon fixation and lake trophic state (Petersen, Reference Petersen1991; Bell & Kalff, Reference Bell and Kalff2001), while others demonstrated a high APP contribution to total phytoplankton production in eutrophic lakes (Vörös et al., Reference Vörös, Gulyas and Nemeth1991) and a low contribution in oligotrophic lakes (Fahnenstiel & Carrick, Reference Fahnenstiel and Carrick1992). It is widely accepted that Prochlorococcus is more abundant in oligotrophic waters (Partensky et al., Reference Partensky, Blanchot and Vaulot1999) and can be absent in low-salinity waters (Jochem, Reference Jochem2003), which is opposite to the occurrence of Synechococcus and picoeukaryotes.
Previous studies in the Adriatic Sea, dealing with the microbial community, have mostly been focused on heterotrophic bacteria (abundance, biomass and production) and their potential predators, heterotrophic nanoflagellates (HNF) and ciliates. These studies showed that coupling between bacteria and HNF generally exists (Šolić & Krstulović, Reference Šolić and Krstulović1994, Reference Šolić and Krstulović1995; Šolić et al., Reference Šolić, Krstulović, Bojanić, Marasović and Ninčević1998, Reference Šolić, Krstulović, Vilibić, Bojanić, Kušpilić, Šestanović, Šantić and Ordulj2009). Moreover, small HNF (<8 μm) were found to be the most important grazers of bacteria, controlling bacterial abundance and production. Grazing experiments in coastal seawaters showed that HNF accounted for 72–96% (mean 80%) and ciliates for 4–28% (mean 20%) of the total grazing on bacteria (Šolić & Krstulović, Reference Šolić and Krstulović1994), with the maximum contribution of HNF to the total grazing during the warmer part of the year (June to October), and the maximum contribution of ciliates during the colder period (November to May). Pernthaler et al. (Reference Pernthaler, Sattler, Šimek, Schwarzenbacher and Psenner1996) reported similar results for an oligo-mesotrophic lake, where HNF were responsible for 90% of protozoan picoplankton grazing, whereas ciliates accounted for only 10%. On the other hand, HNF was strongly controlled by ciliate grazing, which has a strong influence on bacteria via the trophic cascade (Bojanić et al., Reference Bojanić, Šolić, Krstulović, Šestanović, Marasović and Ninčević2005, Reference Bojanić, Šolić, Krstulović, Šestanović, Ninčević Gladan, Marasović and Brautović2006, Reference Bojanić, Vidjak, Šolić, Krstulović, Brautović, Matijević, Kušpilić, Šestanović, Ninčević Gladan and Marasović2012). Further, high variability in the domination of bottom-up and top-down control of bacteria and HNF was found on spatial (along the trophic gradient), seasonal and inter-annual scales (Šolić et al., Reference Šolić, Krstulović, Bojanić, Marasović and Ninčević1998, Reference Šolić, Krstulović, Vilibić, Bojanić, Kušpilić, Šestanović, Šantić and Ordulj2009, Reference Šolić, Krstulović, Kušpilić, Ninčević Gladan, Bojanić, Šestanović, Šantić and Ordulj2010).
Recently, the application of flow cytometry has expanded the knowledge of the microbial community members in the Adriatic Sea. Analyses of the microbial communities in the middle and south Adriatic showed that biomasses of all APP groups (Synechococcus, Prochlorococcus and picoeukaryotes) decreased from eutrophic to oligotrophic areas, while the biomass ratio of bacterial to autotrophic picoplankton showed an increase along the trophic gradient (Šantić et al., Reference Šantić, Krstulović, Šolić and Kušpilić2012, Reference Šantić, Krstulović, Šolić, Ordulj and Kušpilić2013). Increased bacterial abundances were present during warmer seasons with the domination of the low nucleic acid (LNA) group of bacteria (Šantić et al., Reference Šantić, Krstulović, Šolić and Kušpilić2011, Reference Šantić, Krstulović, Šolić, Ordulj and Kušpilić2013). Picoeukaryotes biomass prevailed in the total APP biomass over that of cyanobacteria during the whole year, whereas within cyanobacteria, Synechococcus always dominated over Prochlorococcus, contributing from 61.6 to 97.2% in total biomass. In contrast, in a study performed in the Adriatic brackish area (Varano lagoon) picoplankton fraction was represented mainly by cyanobacteria (Caroppo, Reference Caroppo2000).
In the present study, six estuarine areas along the eastern Adriatic coast were investigated. The main objectives of the study were to achieve a better insight into the structure of the microbial food web in the estuarine environments. We hypothesize that microbial community structure highly depends on the trophic status and salinity regimes of the studied environments. We tested the hypothesis that in P-limited environments prokaryotic picoplankton (cyanobacteria) dominate over eukaryotic autotrophs.
MATERIALS AND METHODS
Study area
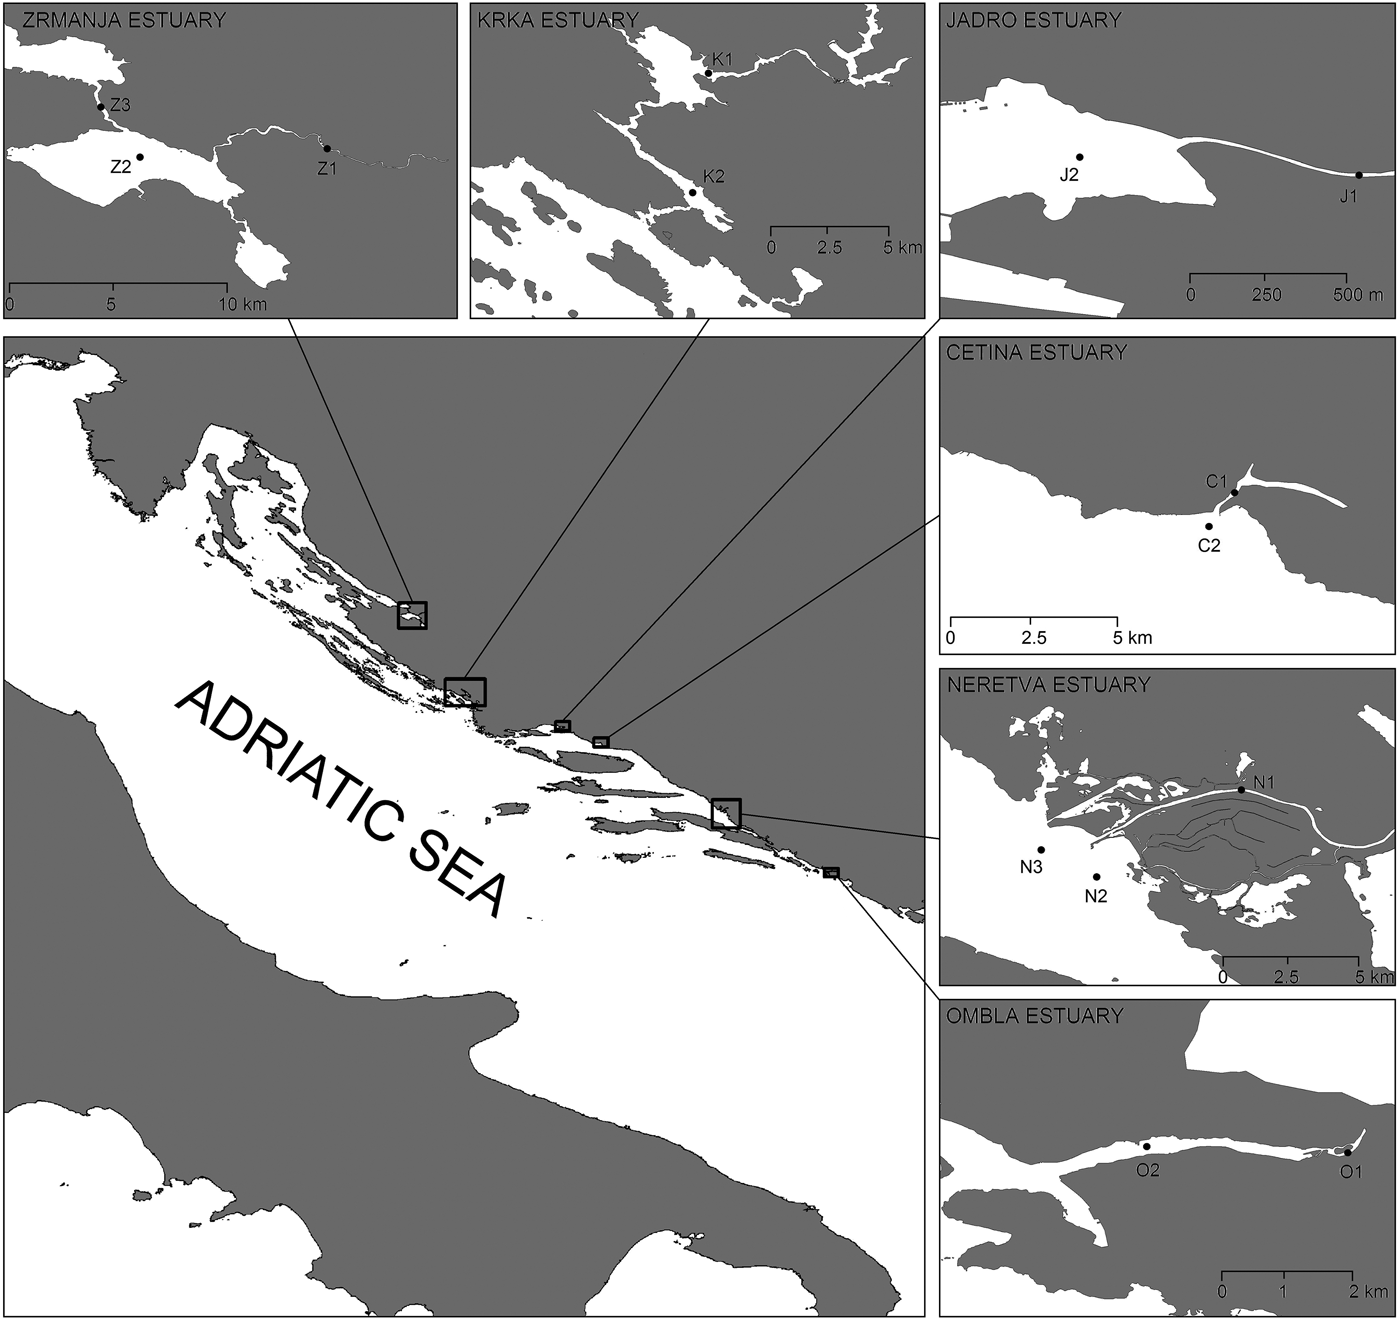
Measurements and samplings were performed at 14 stations in six estuaries along the middle and south Adriatic (Figure 1), during April, July and October 2012. Influx of fresh water in the Adriatic Sea via Croatian rivers is 21.2 km3 per year; this represents approximately 4.9% of the total influx of fresh water in the Mediterranean Sea (UNEP/MAP, 2003). Influx is carried out through a relatively small number of water flows, out of which the most important ones are located in the area of the middle and south Adriatic (Table 1).

Fig. 1. Studied estuaries with sampling locations.
Table 1. Average river discharges, surface temperature and salinity ranges during the study period.

Due to the presence of a moderate tidal amplitude of 0.5 m on average in the Adriatic (Cushman-Roisin et al., Reference Cushman-Roisin, Malačić, Gačić, Cushman-Roisin, Gačić, Poulain and Artegiani2001), all investigated estuaries can be characterized as salt wedge types with typical halo- and nutriclines. The largest variations of the basic hydrographic parameters during the investigated period were, as expected, established in the surface layer of particular stations (Table 1).
Data collection
Several biotic (abundance of heterotrophic bacteria, autotrophic picoplankton, heterotrophic flagellates, pigmented nanoflagellates and microzooplankton, as well as bacterial production) and abiotic (temperature, salinity and inorganic nutrients) parameters were monitored throughout the study. All parameters were measured at all stations in March, July and October 2012 (except ciliates, which were not sampled in the Ombla estuary). Niskin bottles (5 l) were used for sampling; the samples were immediately processed on board.
AUTOTROPHIC PICOPLANKTON
Abundances of Synechococcus, Prochlorococcus and picoeukaryotes were determined using flow cytometry (Marie et al., Reference Marie, Brussaard, Partensky and Vaulot1999). For flow cytometry counts of autotrophic cells, 2 ml of preserved samples in 0.5% glutaraldehyde were frozen at −80°C and stored until analysis (5–10 days). Autotrophic cells were divided into two groups: cyanobacteria (Synechococcus and Prochlorococcus) and picoeukaryotes, they were distinguished according to light scattering, red emission of cellular chlorophyll content and orange emission of phycoerythrin-rich cells.
HETEROTROPHIC BACTERIA
Abundances of Sybr Green-I-stained non-pigmented bacteria were determined using flow cytometry (Marie et al., Reference Marie, Partensky, Jacquet and Vaulot1997). Samples for bacteria analysis were preserved in 2% formaldehyde and stored at 4°C until analysis (5–10 days). Samples of 1 ml without replicates were analysed on a Beckman Coulter EPICS XL-MCL with a high flow rate from 1 to 1.2 μl s−1, and the analysed volume was calculated by acquisition time. In order to standardize the fluorescence intensity of the cells, 1.0-μm yellow-green beads were added (Level-III Epics Division of Coulter Corporation Hialeah, Florida). Two groups of bacteria were distinguished according to their relative green fluorescence as a proxy for the nucleic acid content (Jochem, Reference Jochem2001), referred to as high nucleic acid (HNA), low nucleic acid bacteria (LNA) and light scattering.
PICOPLANKTON BIOMASS ESTIMATION
Biomasses of studied picoplankton groups were calculated by using the following cell-to-carbon conversion factors: 20 fgC cell−1 for heterotrophic bacteria (Lee & Fuhrman, Reference Lee and Fuhrman1987; Kirchman et al., Reference Kirchman, Kell, Simon and Welschmeyer1993), 36 fgC cell−1 for Prochlorococcus (Buitenhuis et al., Reference Buitenhuis, Li, Vaulot, Lomas, Landry, Partensky, Karl, Ulloa, Campbell, Jacquet, Lantoine, Chavez, Macias, Gosselin and McManus2012), 255 fgC cell−1 for Synechococcus (Buitenhuis et al., Reference Buitenhuis, Li, Vaulot, Lomas, Landry, Partensky, Karl, Ulloa, Campbell, Jacquet, Lantoine, Chavez, Macias, Gosselin and McManus2012), 2590 fgC cell−1 for picoeukaryotes (Buitenhuis et al., Reference Buitenhuis, Li, Vaulot, Lomas, Landry, Partensky, Karl, Ulloa, Campbell, Jacquet, Lantoine, Chavez, Macias, Gosselin and McManus2012), and 0.22 pgC μm−3 for heterotrophic flagellates (Borsheim & Bratbak, Reference Borsheim and Bratbak1987). For heterotrophic flagellates, the estimation of biovolume was performed using the lengths and widths of flagellate cells; these measurements were performed under an Olympus BX51 epifluorescent microscope equipped with an XM10-IR camera. For flagellates’ size spectra, 300 cells were measured for each estuary (100 cells per each sampling period).
BACTERIAL PRODUCTION
Bacterial cell production was measured from DNA synthesis based on incorporation rates of 3H-thymidine (Fuhrman & Azam, Reference Fuhrman and Azam1982). Methyl-3H-thymidine was added to 10 ml samples at a final concentration of 10 nmol (specific activity: 86 Ci mmol–1). Triplicate samples and a formaldehyde-killed adsorption control (final concentration: 0.5%) were incubated for 1 h. The incubations were stopped with formaldehyde (final concentration: 0.5%). The thymidine samples were extracted with ice-cold trichloroacetic acid (TCA), according to Fuhrman & Azam (Reference Fuhrman and Azam1982). The TCA-insoluble fraction was collected by filtering the samples through a 0.2-μm pore size Sartorius filter. From the estimates of bacterial production (BP) and bacterial biomass (BB), bacterial specific growth rate (SGR, d–1) was computed as: SGR = ln (1 + BP/BB).
VIRUSES
The abundance of marine viruses was determined as described in Noble & Fuhrman (Reference Noble and Fuhrman1998), with slight adjustments. Collected samples were preserved in formaldehyde (2%, final concentration) and frozen at −80°C until analysis, which was performed in the laboratory immediately at the end of the cruise. Preserved samples (2 ml) were filtered onto 0.02-μm pore-size filters (Anodisc; diameter: 25 mm; Al2O3, Whatman) and stained with Sybr Green I (stock solution diluted 1:300). Filters were incubated in the dark for 20 min and mounted on glass slides with a drop of 50% phosphate buffer (6.7 mM, pH 7.8) and 50% glycerol, containing 0.5% ascorbic acid. Slides were stored at −20°C until analysis. Viral counts were obtained by epifluorescence microscopy (Olympus BX 51, 1250× magnification, equipped with blue excitation filter) and were expressed as the number of virus-like particles (VLP).
HETEROTROPHIC FLAGELLATES (HF)
Abundances of Sybr Green-I-stained heterotrophic flagellates (HF) were determined using flow cytometry (Christaki et al., Reference Christaki, Courties, Massana, Catala, Lebaron, Gasol and Zubkov2011). Samples of 1 ml were analysed on a Beckman Coulter EPICS XL-MCL with a high flow rate of 1.0–1.2 μl s−1 and the analysed volume was calculated by acquisition time. To standardize the fluorescence intensity of the cells, 1.0-μm yellow-green beads were added (Level-III Epics Division of Coulter Corporation Hialeah, Florida).
PIGMENTED NANOFLAGELLATES (PNF)
The number of pigmented nanoflagellates (PNF) was estimated using epifluorescence microscopy. Samples of 10 ml were filtered through polycarbonate filters with 0.8-μm pore diameters (Millipore, Ireland). Microscope slides were examined with an Olympus microscope under UV light at a magnification of 1000× (Porter & Feig, Reference Porter and Feig1980).
MICROZOOPLANKTON
Microzooplankton samples were preserved in seawater containing 2.5% formaldehyde previously buffered with CaCO3. We chose this fixative (instead of Lugol) because it does not stain the detritus (Fonda Umani & Beram, Reference Fonda Umani and Beram2003), which can be abundant in the studied area. Since formaldehyde causes cell loss (Leakey et al., Reference Leakey, Burkill and Sleigh1994), our data may be somewhat underestimated. In our research microzooplankton denotes protozoans such as nonloricate ciliates and tintinnids, as well as small metazoans, which include rotifers, cladocerans, adult small copepods and their developmental stages, juvenile specimens of pteropods, chaetognaths, tunicats and larvae of benthic organisms. Heterotrophic dinoflagellates were not included.
Sample volumes of 5 l were sedimented (Utermöhl, Reference Utermöhl1958) for 48 h in plastic containers and decanted down to a volume of 2 l. This volume was poured into a cylinder and sedimented for 48 h. The excess volume was then reduced to 200 ml. Prior to microscopic analysis, the volume was further reduced to 20 ml. Decanting was carried out using a vacuum pump and a slightly curved pipette that removed water from the surface. The organisms were counted in a glass chamber (76 × 47 × 6 mm) using an inverted microscope (Olympus CK40) at 100×, 200× and 400× magnifications.
ENVIRONMENTAL PARAMETERS
Temperature and salinity were measured with a SeaBird 25 CTD profiler with accuracy >±0.01°C and ±0.02 psu, respectively. Nutrient concentrations (NO3−, NO2−, NH4+, total dissolved inorganic nitrate and soluble reactive phosphate) were determined using the autoanalyser-modified method by Grasshoff (Reference Grasshoff1976).
CHARACTERIZATION OF THE STUDIED AREA ACCORDING TO NUTRIENT STATUS
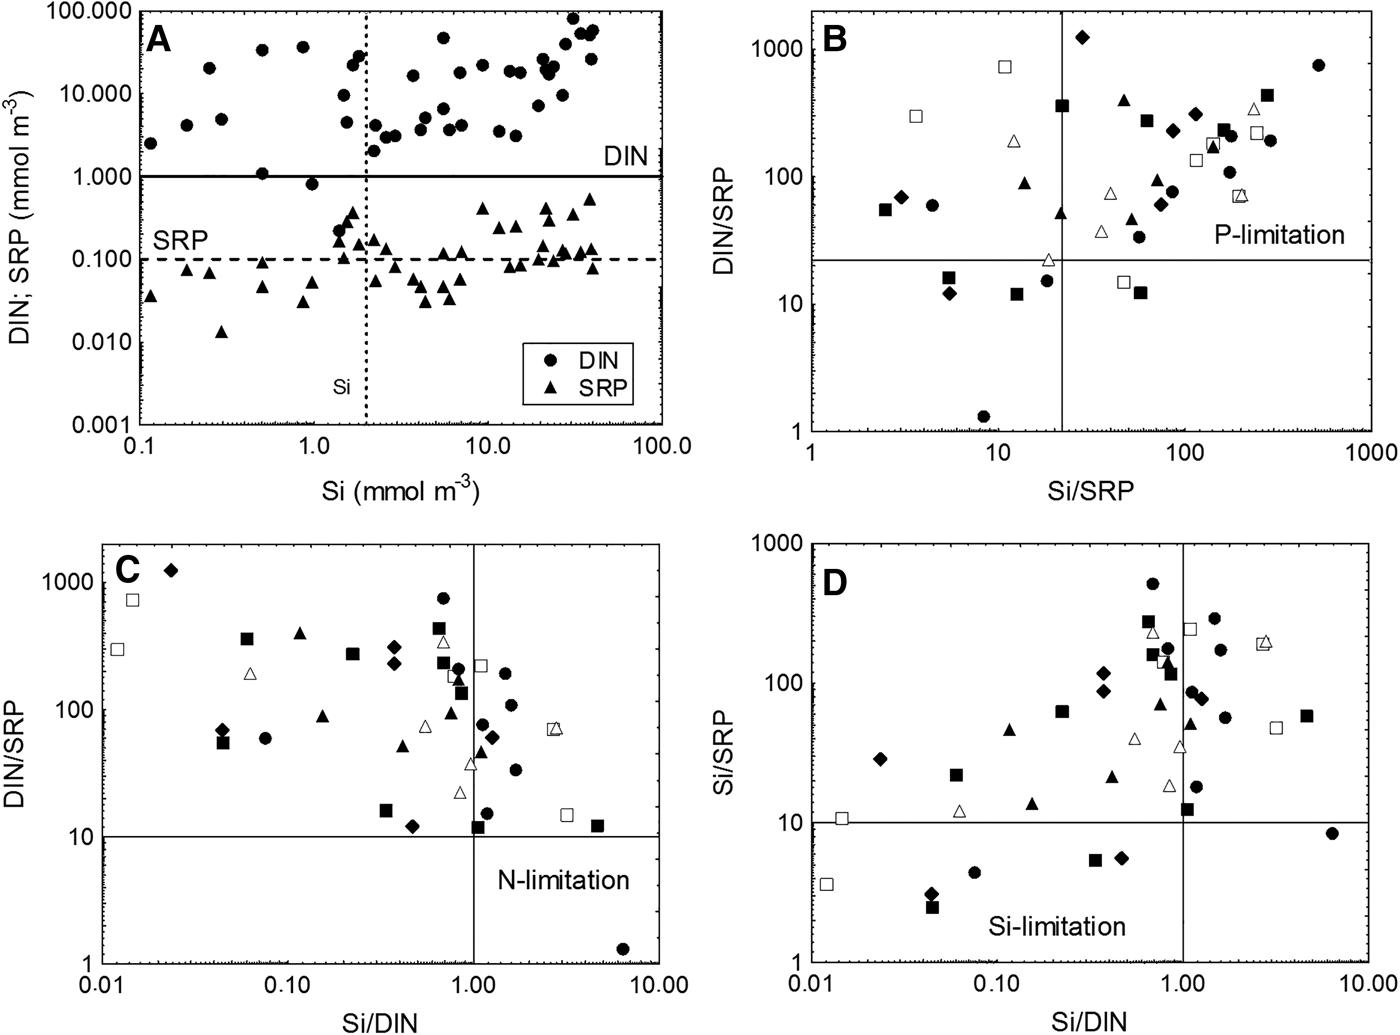
Probable nutrient limitation at studied sites was assessed by: (1) comparing ambient nutrient concentrations with concentrations likely to limit nutrient uptake, which are based on studies of nutrient uptake kinetics (Rhee, Reference Rhee1973; Perry & Eppley, Reference Perry and Eppley1981; Goldman & Gilbert, Reference Goldman, Gilbert, Carpenter and Capone1983; Brzezinski, Reference Brzezinski1985); and (2) criteria for stoichiometric nutrient limitation, which point out that ambient ratios of dissolved N/P < 10 and Si/N > 1 indicate stoichiometric N limitation, Si/N < 1 and Si/P < 10 indicate Si limitation, and N/P > 22 and Si/P > 22 suggest P limitation (Dortch & Whitledge, Reference Dortch and Whitledge1992; Justić et al., Reference Justić, Rabalais, Turner and Dortch1995).
STATISTICAL ANALYSES
Statistical operations were performed by STATISTICA 7.0 software, and multivariate analyses were performed by PRIMER 6 software. The correlations between parameters were expressed as Pearson correlation coefficients.
Normality assessment
An assessment of the normality of data is a prerequisite for many statistical tests because normally distributed data is an underlying assumption in parametric testing. In this study, the Shapiro–Wilk W-test is used in testing for normality (Shapiro & Wilk, Reference Shapiro and Wilk1965).
Normalization or standardization of data
The data should be normalized or standardized to bring all of the variables into proportion with one another. To compare distribution of abundances of different studied groups (which have very different absolute values) between different sampling periods, all values were shown as normalized z-values, which are computed as: z = (D–μ)/σ, where μ and σ are the mean value and standard deviation of D-values, respectively. Thus, z-values tell us how many standard deviations above or below the mean each D-value is (positive z-values are above the mean; negative z-values are below the mean).
Analysis of variance (ANOVA)
Analysis of variance (ANOVA) is used in order to analyse the statistical significance of differences between group means. In the ANOVA setting, the observed variance in a particular variable is partitioned into components attributable to different sources of variation. In its simplest form, ANOVA provides a statistical test of whether or not the means of several groups are equal, and therefore generalizes the t-test to more than two groups. The two-way ANOVA compares the mean differences between groups that have been split on two independent variables (called factors). In this study we used two-way ANOVA in comparing the effects of station/estuary and sampling period, as sources of variation, on the biomass of studied picoplankton groups (the homogeneity of variances was tested prior to the ANOVA analysis). In the cases where ANOVA showed a statistically significant effect of estuary and/or sampling period, Tukey HSD post hoc test was applied to provide specific information on which estuaries and/or sampling periods were statistically significantly different from which, in terms of picoplankton biomass means.
Ordination methods
An ordination is a map of the samples, usually in two or three dimensions, in which the placement of samples reflects the similarity/dissimilarity of their biological communities. Distances between samples on the ordination attempt to match the corresponding dissimilarities in community structure. Nearby points have very similar communities, whereas the samples that are far apart have few species/trophic groups in common or the same species/trophic group at very different levels of abundance or biomass. In this study we used two methods of samples ordination in two dimensions: principal component analysis (PCA) and multidimensional scaling (MDS).
Ordination of samples by PCA is a technique for mapping the samples in a low number of dimensions (usually two) such that the distance between samples attempts to reflect (dis)similarity between them (Harris, Reference Harris1975; Seber, Reference Seber1984). The starting point for PCA is the original data matrix rather than a derived similarity matrix. In this study PCA was used to identify the main patterns of spatial and temporal distribution of microbial food web parameters. The PCA was carried out on an array consisting of the standardized datasets of all studied groups for each estuary and sampling period. The PCA ordination was based on a correlation matrix, and was used to detect (dis)similarity between spatial and temporal patterns of studied microbial groups. The role of standardization of data was to remove the large disparities in counts between groups.
Multidimensional scaling (Kruskal & Wish, Reference Kruskal and Wish1978) is a nonparametric method which uses the rank order of similarities between samples rather than their absolute values. It has several conceptual advantages over other methods (Clarke & Green, Reference Clarke and Green1988) and has been shown empirically to be very robust for analysing planktonic data. The ordination procedure results in a scatter plot in which each replicate sample is represented by a point, the distances between points following the same rank order as the pairwise dissimilarities in species composition between samples. The extent to which this ideal is realized, in a two-dimensional plot for example, is indicated by a ‘stress’ coefficient. In our study, MDS ordination was used for the analysis of similarity/dissimilarity between the studied estuaries based on the distribution of biomass of all groups of picoplankton. The MDS ordination was based on Bray–Curtis similarities (Bray & Curtis, Reference Bray and Curtis1957) of the fourth-root transformed biomasses of all studied picoplankton groups. Transformation of data has the effect of down-weighting the importance of the highly abundant groups, so that similarities depend not only on their values but also on those of less common groups.
RESULTS
Distribution of studied parameters on spatial and temporal scales
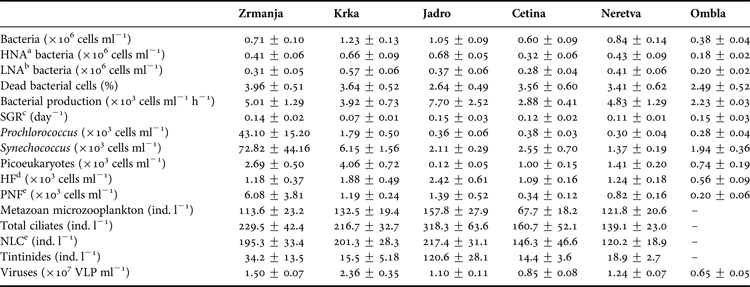
Mean values of the main groups of organisms within the microbial food web in six estuaries along the eastern Adriatic coast are listed in Table 2. The values of most parameters were higher in the three northern estuaries (Zrmanja, Krka and Jadro estuaries) than in the three southern estuaries (Cetina, Neretva and Ombla). Maximal mean values of bacteria, VLP and PNF were established in the Krka estuary, bacterial production and ciliate abundance in the Jadro estuary, and APP in the Zrmanja estuary. The contribution of HNA and LNA bacteria in total bacterial abundance was largely uniform (Table 2). A significantly higher proportion of HNA bacteria (67%) was established only in the Jadro estuary, where the highest concentrations of inorganic nutrients were found.
Table 2. Mean values (±1SD) of studied parameters at six estuaries studied.

a High nucleic acid.
b Low nucleic acid.
c Bacterial specific growth rate.
d Heterotrophic flagellates.
e Pigmented nanoflagellates.
f Non-loricate (naked) ciliates.
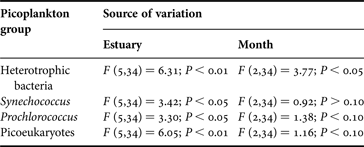
Analysis of variance (ANOVA) showed that there were statistically significant differences in mean biomasses of all the studied picoplankton groups between estuaries (Table 3). On the other hand, no statistically significant differences (ANOVA, P > 0.05) were found between stations within each estuary (not shown). That is the reason why data from different stations within each estuary were pooled together for further analyses. Post hoc comparison of which estuaries were different from which were performed by Tukey's HSD test. This test showed that statistically significant overall differences in biomass between the estuaries were the result of significantly higher biomasses in the Krka and Zrmanja estuaries (for bacteria and all APP groups) and of significantly lower biomasses in the Ombla estuary (for bacteria and picoeukaryotes).
Table 3. Results of two-way ANOVA comparing the effects of estuary and sampling period (March, July, October) on the biomass of studied picoplankton groups.

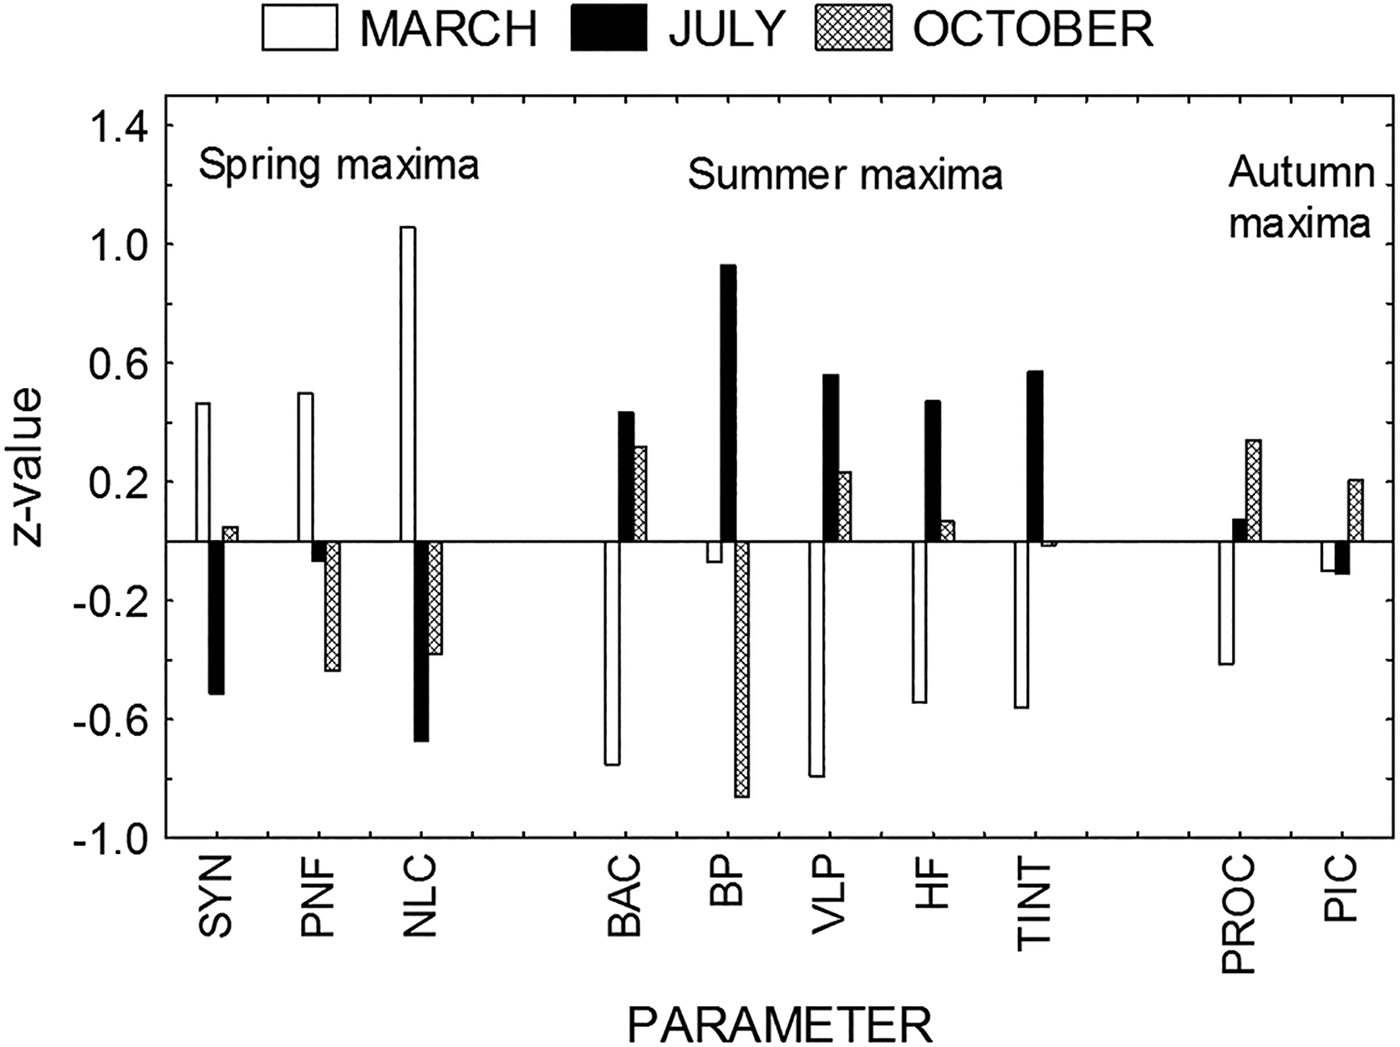
On the other hand, ANOVA indicated significant differences in mean biomasses between samples from March, July and October only for bacteria (Table 3), because of a statistically significant increase of bacterial biomass in July. However, distribution of microbial parameters between March, July and October showed different patterns (Figure 2). To avoid big differences in the absolute values of different parameters, all values were shown as normalized z-values. Analysis shows the domination of spring (March) maxima for Synechococcus, PNF and non-loricate ciliates (NLC); summer (July) maxima for bacterial abundance, bacterial production, VLP, HF and tintinnids; and autumn (October) maxima for Prochlorococcus and picoeukaryotes.

Fig. 2. Seasonal distribution of microbial parameters (SYN, Synechococcus; PNF, pigmented nanoflagellates; NLC, non-loricate ciliates; BAC, bacterial abundance; BP, bacterial production; VLP, virus-like particles; HF, heterotrophic flagellates; TINT, tintinnids; PROC, Prochlorococcus; PIC, picoeukaryotes). All data are shown as normalized z-values.
Microbial community structure
PICOPLANKTON BIOMASS STRUCTURE
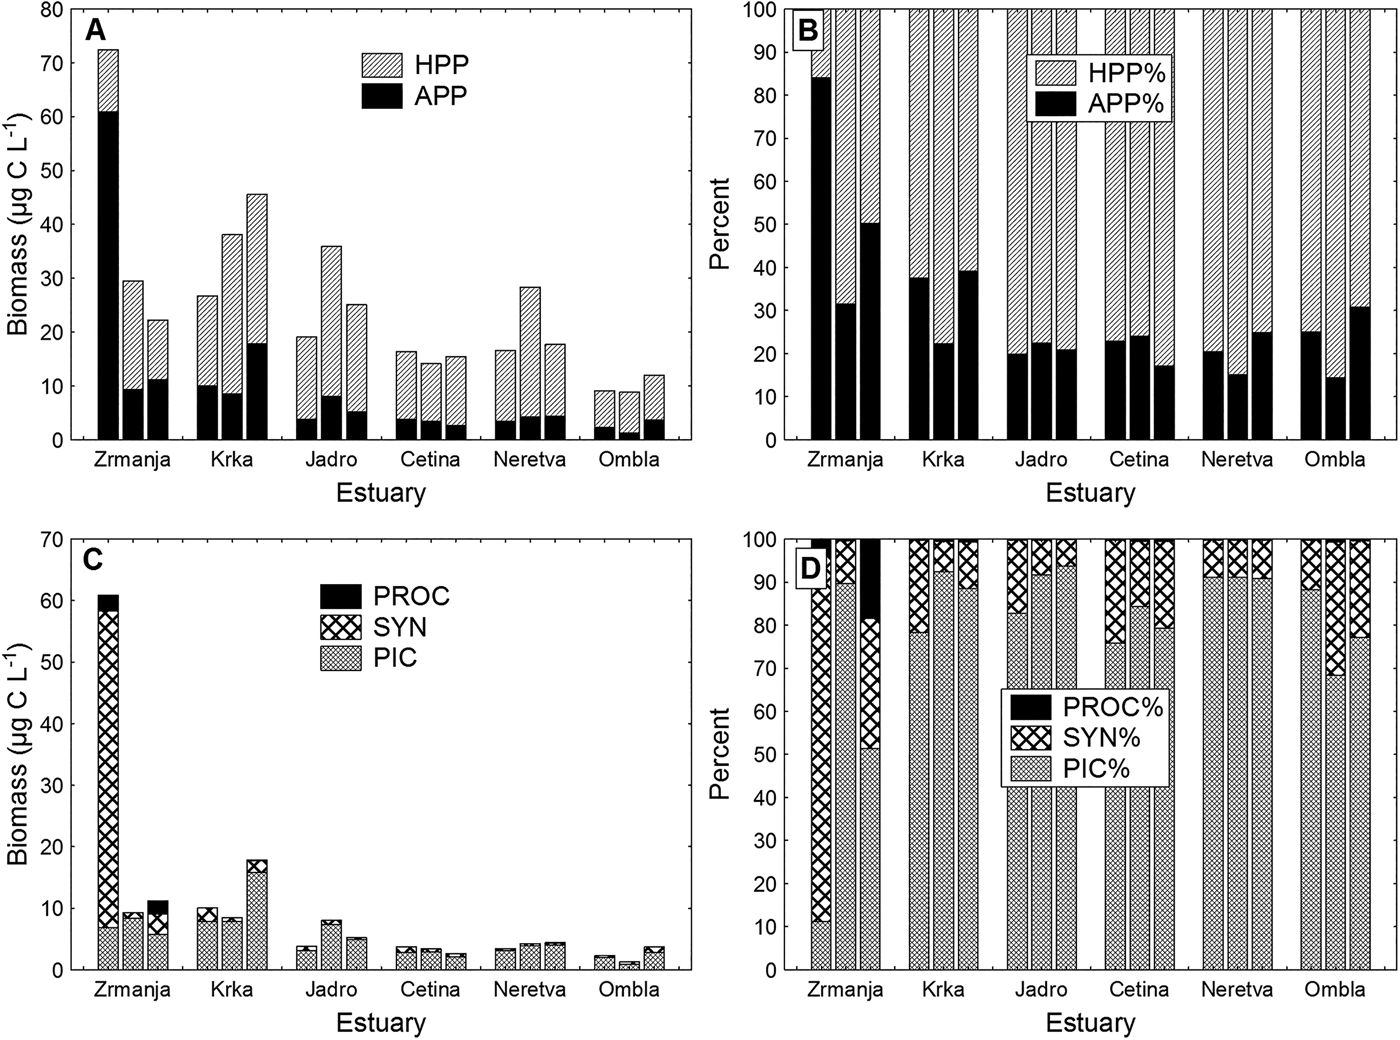
Biomass of heterotrophic picoplankton (HPP) dominated the biomass of total picoplankton at all the stations (in most cases HPP contributed more than 70% to the total picoplankton biomass) except for the Zrmanja estuary in March (Figure 3A, B).

Fig. 3. (A) Autotrophic picoplankton (APP) and heterotrophic picoplankton (HPP) carbon biomass distribution, and (B) their percentage contribution to the total picoplankton biomass in studied estuaries. (C) Biomass distribution of picoeukaryotes (PIC), Synechococcus (SYN) and Prochlorococcus (PROC) and their percentage contribution to the total autotrophic picoplankton (APP) biomass in studied estuaries. For each estuary, the first bar represents March samples, the second bar July samples and the third bar October samples.
Picoeukaryotes dominated in the total autotrophic picoplankton (APP) biomass at all estuaries and seasons (their biomass contribution to the total APP biomass ranged between 70 and 90%), except in the Zrmanja estuary, which was the only area where prokaryotic picoplankton (cyanobacteria), particularly the genus Synechococcus, dominated over eukaryotic autotrophs (picoeukaryotes) (Figure 3C, D). In March, Synechococcus contributed with about 85% to the total APP biomass. The relative biomass contribution of Prochlorococcus was always the lowest (usually less than 1%), with the highest values recorded also in the Zrmanja estuary (5% in March and 18% in October).
HETEROTROPHIC FLAGELLATES SIZE FRACTION
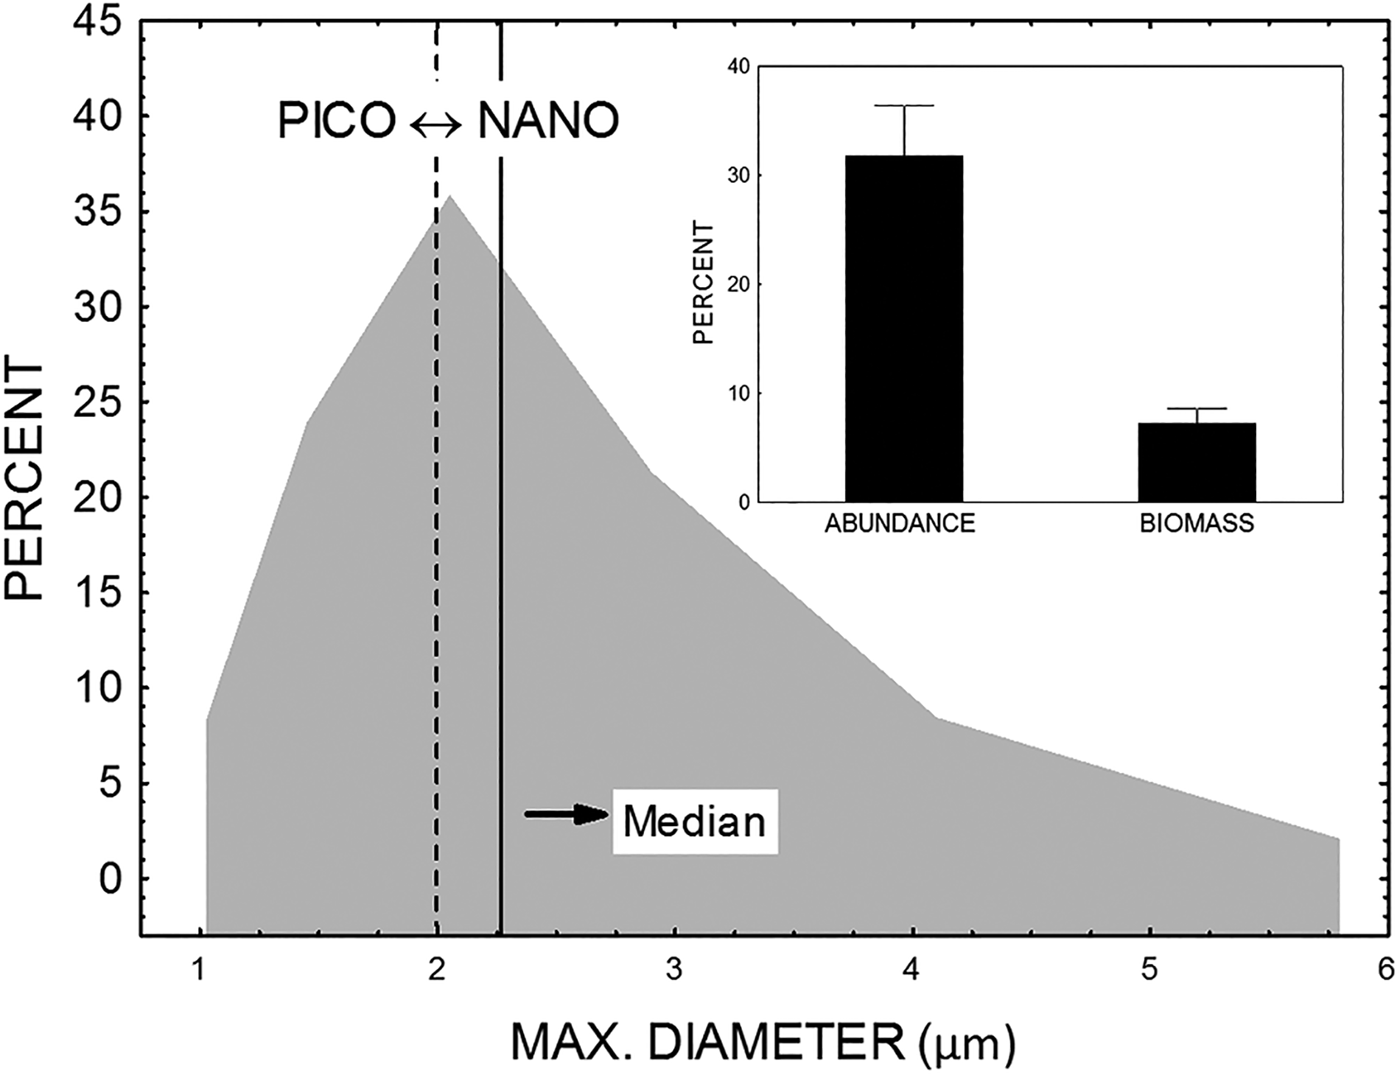
According to their size, heterotrophic flagellates (HF) were placed around the arbitrarily defined boundary of 2 μm, which separated picoplankton size fractions (0.2–2 μm) from nanoplankton size fractions (2–20 μm). Thus, one part of the flagellate assemblages belongs to the picoplankton size fraction (heterotrophic picoflagellates, HPF) and another part belongs to the nanoplankton size fraction (heterotrophic nanoflagellates, HNF). The median of maximal diameter for the whole heterotrophic flagellate assemblages was 2.27 μm, which is slightly larger than the boundary value of 2 μm. The mean contribution of HPF to the total HF biomass was only about 7% in terms of biomass, but was about 33% in terms of abundance (Figure 4). A high contribution of HPF to the total HF was found in the Jadro (63% of abundance and 15% of biomass) and Cetina (53% of abundance and 17% of biomass) estuaries.

Fig. 4. Size distribution of heterotrophic flagellates (large graph) and percentage contribution of heterotrophic picoflagellate fraction in the total flagellate in the terms of abundance and biomass (small graph).
MICROZOOPLANKTON COMMUNITY STRUCTURE
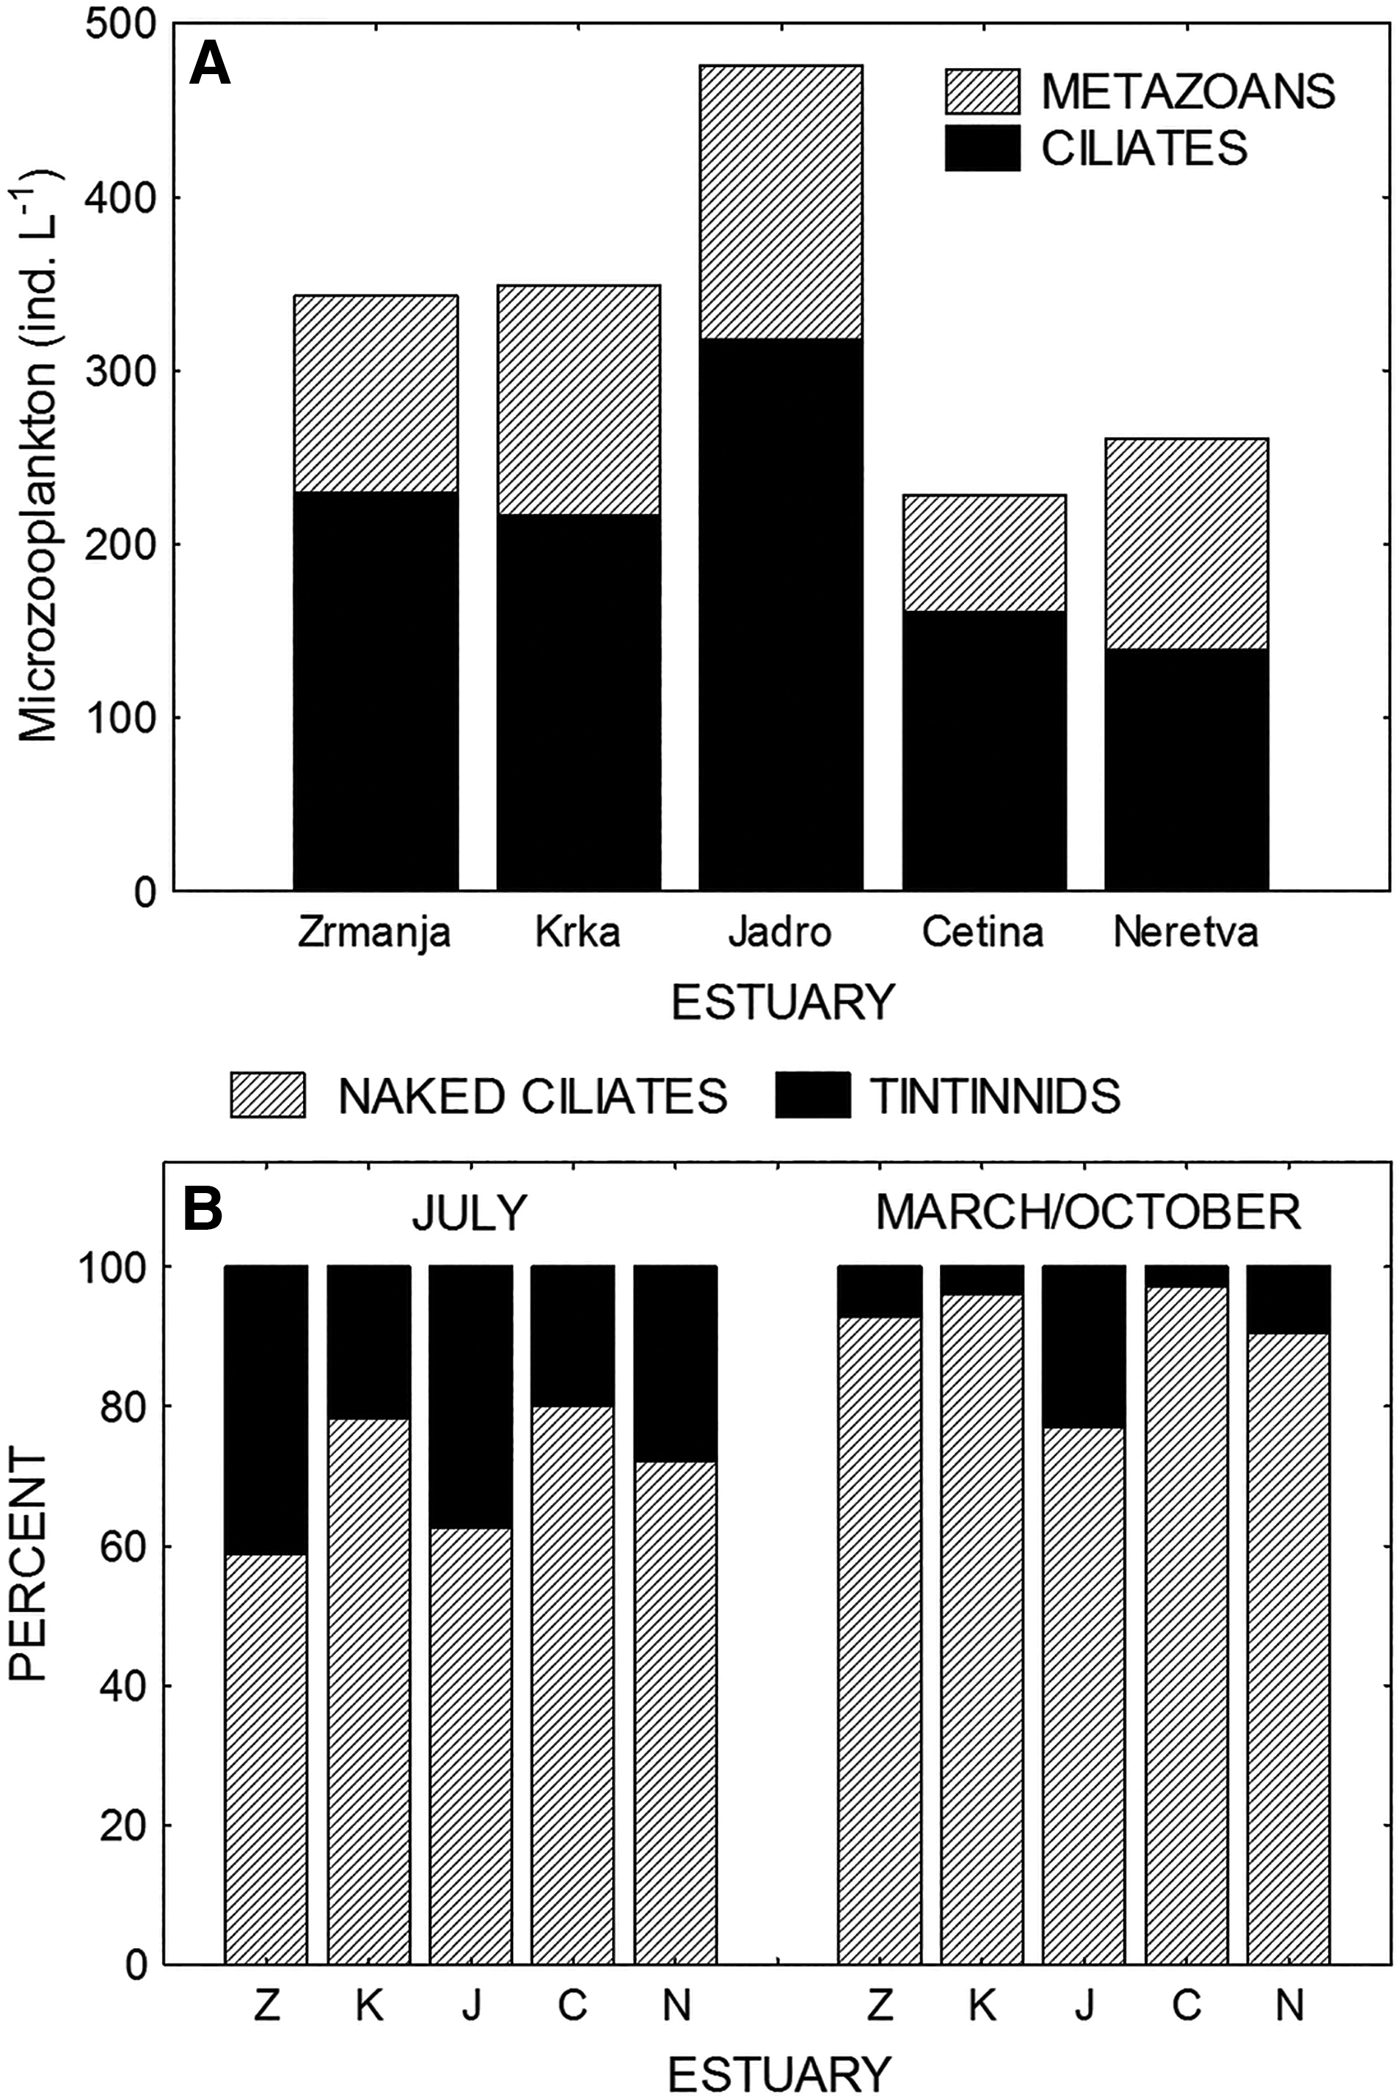
Microzooplankton abundances in the five estuaries (there are no data for the Ombla estuary) are shown in Figure 5A. The same spatial distribution was established in all three studied periods (March, July and October). The highest abundances of both the protozoan (ciliates) and metazoan microzooplankton (rotifers, cladocerans, copepods, juvenile specimens of pteropods, chaetognaths, tunicats and larvae of benthic organisms) were established in the Jadro estuary. The contribution of ciliates to the total microzooplankton abundance ranged from 53% in the Neretva estuary to 70% in the Cetina estuary.

Fig. 5. (A) Distribution of metazoan and protozoan (ciliates) microzooplankton abundance in studied estuaries. (B) Percentage contribution of the naked ciliates (or non-loricate ciliates) and tintinnids to the total ciliate abundance (comparison between July and March/October periods).
Ciliates were divided into non-loricate ciliates (NLC) or naked ciliates and tintinnids (TINT) possessing lorica. The NLC dominated in the total abundance in all studied periods. However, abundance of TINT was seasonally dependent, with maximal values in summer. Their contribution to the total ciliate abundance, which was very low in March and October (ranged from 3 to 9%), markedly increased in July, reaching 20–40% (Figure 5B).
SIMILARITY OF PICOPLANKTON BIOMASS STRUCTURE BETWEEN ESTUARIES
Similarity/dissimilarity between the studied estuaries based on distribution of biomass of all groups of picoplankton was analysed by multidimensional scaling (MDS) ordination, based on Bray–Curtis similarities. Using the 90%-level of similarity, the samples representing picoplankton biomass structure at six estuaries, each sampled in three seasons, are grouped in four clusters (Figure 6). The analysis showed that the Zrmanja and Krka estuaries (especially samples from March and October) are separated from the remaining four estuaries. These two estuaries are characterized by the highest biomasses of the most studied picoplankton groups, whereas the Ombla estuary, which is mapped farthest from these two estuaries, showed the lowest biomass values. Furthermore, in the Zrmanja estuary, an extremely high biomass of APP (in March) and PNF (in July), as well as their contribution to the total microbial biomass, were found.

Fig. 6. Multidimensional scaling (MDS) ordination of studied estuaries during March (M), July (J) and October (O). Analyses were based on Bray–Curtis similarities of the fourth-root transformed biomasses of all studied picoplankton groups. Dotted lines indicate similarity level of 90%.
Relationships within microbial food web
To identify patterns of spatial distribution of microbial food web parameters, principal component analysis (PCA) was used (Figure 7). Principal component analysis (PCA) was carried out on an array consisting of the standardized datasets of all studied groups for each estuary and sampling period. The first principal component (PC1) explains 44% of variability and can be regarded as the best possible single representation of the spatial distribution for the most studied microbial groups. All heterotrophic parameters (bacteria, bacterial production, viruses and HF) showed similar spatial patterns and are grouped on the PCA graph. Correlations between heterotrophic bacteria and viruses were statistically significant in all estuaries (coefficients of correlation ranged between 0.77 and 0.85; P < 0.01). Furthermore, heterotrophic bacteria significantly correlated with heterotrophic nanoflagellates, which suggest possible predator–prey interaction. Coefficients of correlation ranged between 0.54 and 0.93 (P < 0.01) and varied seasonally with the highest values in July. Finally, statistically significant correlations (P < 0.01) between heterotrophic nanoflagellates and tintinnids, as their potentially important predators, were established in the Zrmanja, Krka and Neretva estuaries.

Fig. 7. Principal component analysis (PCA) plot based on Spearman correlations between standardized datasets of all the examined biological parameters (M, March; J, July; O, October; abbreviations for biological parameters as in Figure 3). PC1 explains 44.0% and PC2 explains 31.8% of variability.
Prokaryotic autotrophs (Prochlorococcus and Synechococcus) are mapped on the opposite side along the PC1 axis, and these groups were negatively correlated with phosphorus, but not correlated with temperature. Finally, spatial distributions of eukaryotic autotrophs (picoeukaryotes and PNF) were better represented with PC2 (explains 31.8% of variability), and these groups showed positive correlation with nitrogen (but not with phosphorus) and salinity.
Relationships of microbial food web components with environmental factors
The ordination of microbial food web components shown in Figure 7 suggests different preferences towards environmental conditions (temperature, salinity, nutrients). In general, heterotrophic components (bacterial abundance, bacterial production, HF and viruses) showed a statistically significant positive correlation (P < 0.01) with temperature, which was not the case with autotrophic organisms, which did not correlate with temperature. On the other hand, eukaryotic autotrophs (picoeukaryotes and PNF) showed statistically significant positive correlation (P < 0.01) with salinity.
PICOPLANKTON DISTRIBUTION IN RELATION TO PHOSPHORUS-LIMITED CONDITIONS
The structure of the microbial food web and the microbial role in biogeochemical processes in aquatic ecosystems may vary considerably depending on environmental trophic status (Cotner & Biddanda, Reference Cotner and Biddanda2002; Berglund et al., Reference Berglund, Müren, Båmstedt and Andersson2007). The analyses of probable nutrient limitation at studied sites showed widespread phosphorus-limited conditions, less presence of silicon-limited conditions and practically no limitation with nitrogen (Figure 8).

Fig. 8. Scatter diagrams of ambient nutrient concentrations with concentrations likely to limit nutrient uptake (phosphorus limitation – below dashed line, nitrogen limitation – below solid line, silicon limitation – left of vertical line) (A), and of atomic nutrient ratios with stoichiometric criteria for potential P-, N- and Si-limitation (B–D). Symbols in panels B–D represent different estuaries and are the same as in Figures 6 and 7.
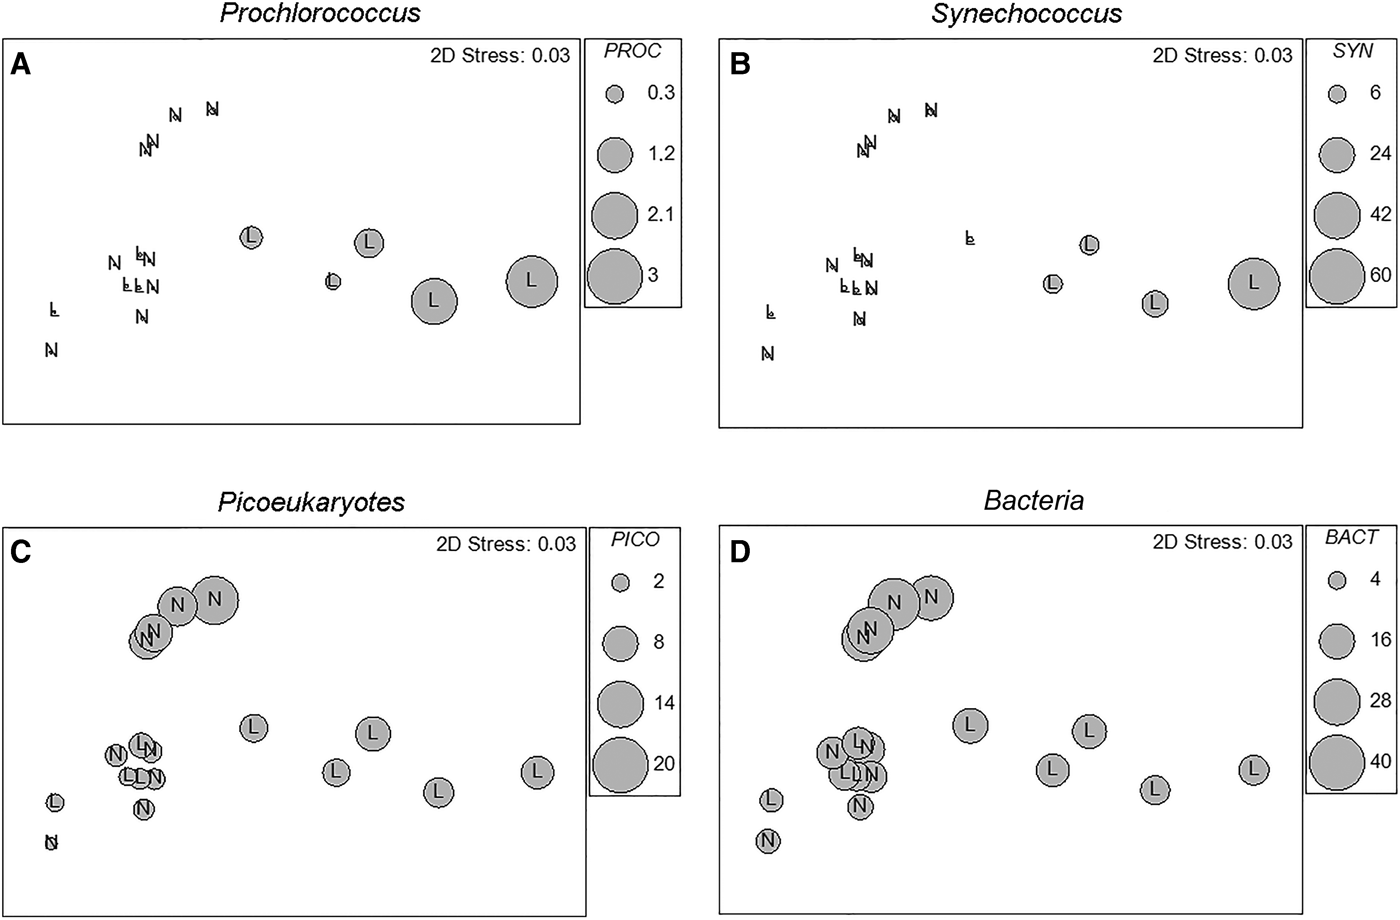
Picoplankton distribution in relation to phosphorus-limited or not-limited conditions is shown in Figure 9. The MDS ordination of studied estuaries is changed in a way that all estuary/month samples are divided into two categories, phosphorus-limited (L) and not-limited (N) conditions (based on the criteria shown in Figure 8). Relative biomasses of four picoplankton groups (Prochlorococcus, Synechococcus, picoeukaryotes and heterotrophic bacteria) are superimposed. The analysis showed that prokaryotic autotrophs (Prochlorococcus and Synechococcus) reached maximal values in P-limited conditions (statistically significant correlation was found between these two groups; P < 0.01), whereas picoeukaryotes and heterotrophic bacteria reached higher biomasses in conditions that have not been limited by phosphorus.

Fig. 9. Multidimensional scaling (MDS) ordination of studied estuaries constructed as in Figure 6. All estuary/month points are divided into two categories, phosphorus limited (L) and not-limited (N) conditions (based on the criteria shown in Figure 8), and biomasses of Prochlorococcus (A), Synechococcus (B), picoeukaryotes (C) and heterotrophic bacteria (D) are superimposed using relative scales (larger diameter of the circle means higher biomass).
DISCUSSION
The typical feature of the studied estuaries is the limitation by phosphorus, but not by nitrogen, which is a consequence of the fact that the eastern Adriatic karstic rivers bring small amounts of phosphorus (UNEP/MAP, 2003). All the studied estuarine areas are characterized by high N/P (average values ranged from 123 in the Cetina estuary to 315 in the Ombla estuary) and Si/P (from 53 in the Ombla estuary to about 147 in the Neretva estuary) ratios and low concentration of phosphorus, meaning that the studied estuarine areas could be characterized as being P-limited.
Domination of heterotrophic picoplankton (HPP) over autotrophic picoplankton (APP) has accompanied such conditions. The HPP/APP biomass ratio was >1 in all estuaries (HPP/APP ratio ranged from 1.12 in the Zrmanja estuary to 4.09 in the Neretva estuary). Domination of heterotrophic over autotrophic biomass within the picoplankton community is characteristic in oligotrophic regions with low chlorophyll (Azam et al., Reference Azam, Fenchel, Field, Gray, Meyer-Reil and Thigstad1983; Li & Harrison, Reference Li and Harrison2001), and this pattern was found in the open Adriatic Sea (Šantić et al., Reference Šantić, Krstulović, Šolić, Ordulj and Kušpilić2013). Calvo-Díaz & Morán (Reference Calvo-Díaz and Morán2006) also found an HPP/APP ratio >1 in the Bay of Biscay throughout the year, except in September. In our study, this ratio showed higher values during the summer (the average HPP/APP ratio in July was 3.97, whereas in March and October the ratio was 2.69 and 2.74, respectively). Only in the Zrmanja estuary did the autotrophic biomass reach that of the heterotrophic biomass in October (HPP/APP = 0.99) and even dominated in March (HPP/APP = 0.19) as a result of an extremely high abundance of Synechococcus in March, and a high abundance of Synechococcus and Prochlorococcus in October. This could be explained by the theory that pico-heterotrophs are much more temperature-sensitive than autotrophs (Pomeroy & Deibel, Reference Pomeroy and Deibel1986; Pomeroy et al., Reference Pomeroy, Wiebe, Deibel, Thompson, Rowe and Pakulski1991), which is supported by this study (statistically significant positive correlation between heterotrophs and temperature; P > 0.01). This is also supported by the study in the Adriatic Sea, which showed that the picoplankton community biomass was dominated by autotrophs in a very few cases, which always occurred during colder periods (during winter or spring) (Šantić et al., Reference Šantić, Krstulović, Šolić, Ordulj and Kušpilić2013).
Further, one characteristic of the heterotrophic bacteria community was a relatively high contribution of LNA bacteria in the total bacterial abundance. A significantly higher proportion of HNA (67%) was established only in the Jadro estuary, where the highest concentrations of inorganic nutrients were found. It seems that in oligotrophic environments, LNA bacteria may represent a predominating bacterioplankton community (Zubkov et al., Reference Zubkov, Fuchs, Burkill and Amann2001; Jochem et al., Reference Jochem, Lavrentyev and First2004; Longnecker et al., Reference Longnecker, Sherr and Sherr2005). In all the studied estuaries, the highest contributions of LNA bacteria were found in July, when the lowest nutrient concentrations were found. This could be explained by better adaptation of these bacteria to oligotrophic conditions (Kjelleberg et al., Reference Kjelleberg, Albertson, Flaerdh, Holmquist, Jouper-Jaan, Marouga, Oestling, Svenblad and Weichart1993). On the other hand, HNA bacteria dominated during the winter–spring period, when primary production was higher (Vidjak et al., Reference Vidjak, Bojanić, Kušpilić, Ninčević Gladan and Tičina2007), which is in accordance with reports that HNA bacteria were more dependent on phytoplankton substrates than LNA bacteria (Scharek & Latasa, Reference Scharek and Latasa2007; Morán et al., Reference Morán, Calvo-Diaz and Ducklow2010).
Domination of picoeukaryotes in the total APP is consistent with the fact that picoeukaryotes are highly successful in environments that are not limited by nutrients (Shalapyonok et al., Reference Shalapyonok, Olson and Shalapyonok2001; Radić et al., Reference Radić, Šilović, Šantić, Fuks and Mičić2009). Calvo-Díaz & Morán (Reference Calvo-Díaz and Morán2006) found that the contribution of cyanobacteria to the total APP cells increased in nutrient-depleted waters. According to smaller-sized cells, cyanobacteria could have an advantage over larger eukaryotic cells in taking of nutrients. Therefore, the inverse relationship of Prochlorococcus and Synechococcus with picoeukaryotes seems to be a general feature along trophic gradients (Campbell et al., Reference Campbell, Landry, Constantinou, Nolla, Brown, Liu and Caron1998; DuRand & Olson, Reference DuRand and Olson2001; Jiao et al., Reference Jiao, Yang, Koshikawa and Watanabe2002; Schlitzer, Reference Schlitzer2004; Zhang et al., Reference Zhang, Jiao and Hong2008).
Multivariate analysis showed that limitation by phosphorus dominantly determined the structure of the microbial food web, especially the relationships between the major groups of picoplankton. On the other hand, different periods of research (March, July and December) mainly reflected nutrient conditions, with a superimposed, less important effect of temperature, while salinity showed statistically significant effects for both picoeukaryotic and nanoeukaryotic (PNF) autotrophs. The model outlined by Stockner (Reference Stockner1988) suggests an increase of APP biomass and a decrease of its relative importance with an increase of phosphorus concentration in marine and freshwater systems. In our study, MDS ordination clearly separated two estuaries (Zrmanja and Krka), which were highly P-limited environments (Figure 9). In these estuaries the highest relative contribution of Prochlorococcus and Synechococcus biomasses to the total picoplankton biomass were established, which is in accordance with Stockner's theory, but their absolute biomasses also increased, which is the opposite to this model.
Common spatial distribution was found for all heterotrophic parameters (bacteria, bacterial production, viruses and HF), and this distribution was well represented with the first principal component (PC1) which was in positive correlation with nutrient concentrations and temperature (Figure 7). Moreover, statistically significant correlation was found between bacteria and viruses, as well as between bacteria and HF. A high relative abundance contribution of small HF cells (<3 μm) in the total HF (ranged between 6 and 66%, with mean value of 33%) was found in the studied estuaries. Since these small flagellates have been reported as the main grazers of bacteria (Šolić & Krstulović, Reference Šolić and Krstulović1994; Massana et al., Reference Massana, Balagué, Guillou and Pedrós-Alió2004, Reference Massana, Unrein, Rodríguez-Martínez, Forn, Lefort, Pinhassi and Not2009; Piwosz & Pernthaler, Reference Piwosz and Pernthaler2010), their high correlation with bacteria suggests a possible predator–prey interaction.
Prochlorococcus are typically associated with oligotrophic conditions (Olson et al., Reference Olson, Chisholm, Zettler, Altabet and Dusenberry1990; Campbell & Vaulot, Reference Campbell and Vaulot1993; Lindell & Post, Reference Lindell and Post1995), picoeukaryotes with environments with a higher trophic level (Fuhrman, Reference Fuhrman1999; Jiao et al., Reference Jiao, Yang, Koshikawa and Watanabe2002), while Synechococcus showed no consistent pattern. Synechococcus has been reported as a major component in oligotrophic environments (Callieri & Stockner, Reference Callieri and Stockner2002), but also in coastal and estuarine waters, including nutrient-rich ecosystems (Phlips et al., Reference Phlips, Badylak and Lynch1999; Badylak & Phlips, Reference Badylak and Phlips2004). The high variability of importance of Synechococcus could be a result of the fact that two groups of Synechococcus have been identified in estuarine ecosystems – one rich in phycoerythrin (PE) and the other in phycocyanin (PC) (Wood et al., Reference Wood, Horan, Muirhead, Phinney, Yentsch and Waterbury1985). Numerous studies have suggested that PC-rich cells are common only in low-saline waters, whereas PE-rich cells are dominant in higher saline waters (Murrell & Lores, Reference Murrell and Lores2004; Wang et al., Reference Wang, Wommack and Chen2011).
Domination of Synechococcus biomass over Prochlorococcus biomass was typically found in mesotrophic and eutrophic waters (Partensky et al., Reference Partensky, Blanchot and Vaulot1999), but it was also found that Synechococcus biomass dominated Prochlorococcus in P-depleted environments, as reported in the literature for the northern and central Adriatic Sea (Radić et al., Reference Radić, Šilović, Šantić, Fuks and Mičić2009) and the Mediterranean Sea (Llabres et al., Reference Llabres, Agustí, Alonso-Laita and Herndl2010). In contrast, Mella-Flores et al. (Reference Mella-Flores, Mazard, Humily, Partensky, Mahe, Bariat, Courties, Marie, Ras, Mauriac, Jeanthon, Mahdi Bendif, Ostrowski, Scanlan and Garczarek2011) reported that Prochlorococcus mostly predominated over Synechococcus in different regions of the Mediterranean Sea. Regardless of the differences in the abundance and biomass, in this study, Prochlorococcus and Synechococcus showed a positive relationship, which could be explained by an inverse correlation with phosphorus as their common characteristic. This is supported by the results of Calvo-Díaz & Morán (Reference Calvo-Díaz and Morán2006), who found that the cyanobacteria/picoeukaryotes ratio decreased with increased phosphate concentration, and cyanobacteria reached their abundance maximum in P-depleted waters.
In conclusion, our study highlights the potential importance of the picoplankton community in P-limited estuarine environments. Results showed that heterotrophic bacteria and APP (particularly picoeukaryotes and Synechococcus) can reach marked abundances and biomasses. There was a significant positive effect of water temperature on biomasses of heterotrophs, whereas eukaryotic autotrophs exhibited a positive correlation with salinity. However, limitation by phosphorus, as a characteristic of the studied estuaries, mainly determined the structural characteristics of the microbial community which include: (1) higher heterotrophic biomass in comparison to autotrophic biomass within the picoplankton community; (2) general domination of picoeukaryotes within the APP community, and increase of absolute and relative biomass of prokaryotic autotrophs (Prochlorococcus and Synechococcus) in the total APP in P-limited conditions; (3) domination of Synechococcus over Prochlorococcus biomass in all studied conditions, and common spatial distribution of these two cyanobacteria groups, which was mostly determined by concentration of phosphorus; (4) relatively high contribution (about 50%) of LNA bacteria in the total bacterial abundance; and (5) relatively high contribution (about 33%) of heterotrophic pico-flagellates in the total flagellate abundance.
The present study provides new information about the structure of microbial communities in phosphorus-limited estuarine environments. For better understanding of microbial food web functioning in these environments, future investigations should include mixotrophic protozoa, grazing measurements and better insight in the species composition of picoplankton assemblages.


