


INTRODUCTION
Socio-ecological systems (SESs) theory links the influence of economy with the functioning of ecosystems (Ostrom Reference Ostrom2009). SESs, emerging from complex and coupled social and ecological structures (Gatzweiler Reference Gatzweiler2014), comprise natural–sociological interactions, depend on the environmental conditions of each region and provide a wide range of essential services to society (Haines et al. Reference Haines, Kovats, Campbell-Lendrum and Corvalan2006; Gual & Norgaard Reference Gual and Norgaard2010). There are neither social systems without nature nor ecosystems without people (Petrosillo et al. Reference Petrosillo, Aretano, Zurlini and Elias2015).
Socio-ecological interdependencies may have applications in landscape assessment, planning, conservation and management. Protected area conservation planning has frequently focused on the biophysical components; nevertheless, these areas are also SESs that include stakeholders interacting in a shared environment (Schmitz et al. Reference Schmitz, Matos, De Aranzabal, Ruiz-Labourdette and Pineda2012; Cumming et al. Reference Cumming, Allen, Ban, Biggs, Biggs, Cumming, de Vos, Epstein, Etienne, Maciejewski, Mathevet, Moore, Nenadovic and Schoon2015). In particular, biosphere reserves point to the interconnection of human and natural landscapes. Hence, these reserves offer scope for understanding the interplay between complex mixtures of driving forces and anthropogenic stress factors on SESs (UNESCO 2005).
Different analytical tools are necessary to formalize the relationship between environment and society. The most productive have been those arising from systemic approaches (Norberg & Cumming Reference Norberg and Cumming2008; Ostrom Reference Ostrom2009), where the formalization allows the identification and quantification of the degree of interdependency and coupling between the two systems (Parcerisas et al. Reference Parcerisas, Marull, Pino, Tello, Coll and Basnou2012; Gatzweiler Reference Gatzweiler2014). Furthermore, the correspondence between different ways of inhabiting the territory and landscape structures allows the generation of future scenarios, thus facilitating the work of environmental managers and decision makers (Holling Reference Holling2001; Folke et al. Reference Folke, Carpenter, Elmqvist, Gunderson, Holling and Walker2002; Gunderson & Holling Reference Gunderson and Holling2002). The Millennium Ecosystem Assessment (MEA 2005) highlighted the development of scenarios and models to support key socio-ecological issues and decision making. This could reduce the uncertainties of environmental strategies such as those under the influence of climate change (CC).
The goal of this paper is to understand the interactions between social, economic and ecological systems in the island of Fuerteventura, emphasizing the concept of humans in nature and modelling socio-ecological changes over three decades (1980–2010). Fuerteventura is a desert territory and its whole area was designated by UNESCO as a biosphere reserve in 2009. The SES of Fuerteventura is rapidly changing due to socio-economic changes that made traditional agriculture unprofitable. As a result, there has been land abandonment and losses of natural–cultural values, as well as local people's identity, including losses of linkages between island inhabitants and their rural cultural landscape. Rural people in arid zones ultimately depend on the effective use of natural resources, and it is recognized that these environments are expected to undergo significant changes resulting mainly from CC (Verón et al. Reference Verón, Paruelo and Oesterheld2006; Reynolds et al. Reference Reynolds, Grainger, Stafford Smith, Bastin, Garcia-Barrios, Fernández, Janssen, Jürgens, Scholes, Veldkamp, Verstraete, Von Maltitz and Zdruli2011).
We formalize a quantitative model of relationships between the structure of the society and the biophysical characteristics of this island, assuming that the natural capital establishes the ecological limits of the SES (WFNC 2015). Considering that the vulnerability and adaptation to CC constitute a critical set of society–environment interactions (Lorenzoni et al. Reference Lorenzoni, Jordan, Hulme, Kerry Turner and O'Riordan2000; IPCC 2007), we have modelled changes in the SES under CC scenarios of the Intergovernmental Panel on Climate Change (IPCC). The model allows both detecting of the degree of coupling between human and natural systems and predicting potential changes in the socio-economic structure based on simulated environmental conditions.
METHOD
Study area
Fuerteventura is one of the seven islands of the Canary Archipelago, with an area of 1657 km2. The volcanic structure is 20 million years old, and this age determines its eroded topography and limited altitudinal variation. The island, which is considered to be the most arid region of Europe, is a desert with a relatively homogeneous landscape. Monthly average temperatures are 17–20°C throughout the year, although it can suddenly rise due to sub-Saharan influences. Precipitation is less than 200 mm/year and irregular. Insolation is c. 2800 hours of sunshine/year and winds are intense and constant, which favours evapotranspiration.
Limited water availability and centuries of agriculture have contributed to the current landscape of scarce vegetation and a lack of forests. Most of the island territory is colonized by scrub with scarce coverage because of the exploitation of vegetation for fuel and intense and extensive long-standing goat grazing. Traditional goat farming is still an economically important activity on the island. It is considered by some conservationists as a threat to plant species richness, while others see it as an activity in a historical equilibrium with nature that has been modified by the arrival of tourism and other new activities (Gangoso et al. Reference Gangoso, Donázar, Scholz, Palacios and Hiraldo2006). Today, residual agrarian and fishing activities coexist with the conservation of the natural and cultural landscape, which is very attractive for visitors and the development of tourism (Díaz et al. Reference Díaz, Ruiz Labourdette, Darias, Santana, Schmitz, Pineda, Brebbia and Pineda2010).
Shrubland and coastal vegetation are the most abundant plant formations of the island (Fig. 1). The former has increased since 1980, while the characteristic vegetation of sandbanks and salt marshes has declined. Deciduous native groves, mainly willows, tamarisks and palm, are almost the only arboreal representatives of native vegetation, barely surviving in ravines and valley bottoms. Cultural land uses constitute a negligible proportion of the area of the island, and they have an important tendency for shrub encroachment as a consequence of the abandonment of traditional agricultural activities. Human population growth has nevertheless occurred due to the recent increase in non-native people (Fig. 1).

Figure 1 (a) Dynamics of vegetation and land uses of Fuerteventura (1980–2010). (b) Variations of the native and non-native populations (2000–2015). Haloph. = halophyte; Nb = number.
Data collection
We focus on the biophysical characteristics of the study area and the socio-economy of the local population. Thus, we consider variables characterizing natural capital, land uses and the socio-economic structure of the island.
Large scale
We collected available data from the temporal variation of the natural vegetation and land uses over a period of 30 years (SIGA 1980–2010) and from the native and non-native human population (number of inhabitants) during 2000–2015 (ISTAC 2016).
Human settlement scale
Fuerteventura has six municipalities composed of 51 rural human settlements (HSs; small towns, villages and hamlets) sparsely distributed within their territorial limits. We selected the areas of influence of the HSs as spatial reference units (Appendix S1) (available online). These spatial sectors were used as units of analysis, at which scale both the biophysical and the socio-economic variables were recorded. The spatial zoning of the HSs was performed using Thiessen polygons, an exact and deterministic interpolation method (Okabe & Suzuki Reference Okabe and Suzuki1997). In the sectors corresponding to each HS and its influence area, we recorded quantitative information referring to 64 socio-ecological descriptors: 12 climate variables (mean annual rainfall; mean annual temperature; mean rainfall and temperature for each of the four seasons; potential annual evapotranspiration; and continentality index), 10 geomorphological variables (Table 1), 11 vegetation and land-use variables (coastal vegetation; beaches, dunes and sandbanks; recent volcanic extrusions; agricultural lands; abandoned crops; shrubland; scarce vegetation; urbanized areas; coniferous plantations; ravines, willow groves and tamarisks with palms; orchards and greenhouses) and 31 socio-economic variables (employment by branch of activity, characteristics of housing and urban areas, population by place of birth, tourism lodging and cultural interest goods; Appendix S2).
Table 1 Geomorphological variables used in the landscape analysis.

The climate starting data, provided by the Spanish State Meteorology Agency, correspond to data from 1987 to 2007 at 30 meteorological stations (AEMET 2007), which were selected from a total of 48 according to the length of the series, temporal stability and density (spatial cover). The climatic variables were obtained by means of mixed extrapolation combining global statistical interpolation, multivariate regression and local residual correction with spatial interpolation (Ninyerola et al. Reference Ninyerola, Pons and Roure2007a; Ninyerola et al. Reference Ninyerola, Pons and Roure2007b). Annual potential evapotranspiration and Thornthwaite continentality indices were calculated according to Rivas-Martínez and Rivas-Saenz (Reference Rivas-Martínez and Rivas-Sáenz2009). Data on global radiation and insolation were obtained with the hemispheric visual basin algorithm (Fu & Rich Reference Fu and Rich2000). Topography variables were treated with a digital terrain model and described according to the altitude, slope and hydric convergence of the terrain (Table 1). The resolution of climate and geomorphological variables was 100 × 100 m.
We recorded the percentage cover of each type of vegetation and land use in each influence area. The information was taken from maps of land and vegetation occupation at a scale of 1:25,000 (Arco Reference Arco and Afonso-Carrillo2008), which were validated by detailed field trips and sampling of plant communities. Biophysical variables were treated using the ArcGIS software (ESRI 2012). Socio-economic descriptors were obtained from statistical databases (ISTAC 2016).
Characterizing socio-ecological interdependences
Step 1: spatial assignment of socio-ecological descriptors
We assigned the environmental and socioeconomic descriptors to the HSs studied using two matrices of georeferenced quantitative data. The first described the small towns, villages and hamlets by means of biophysical variables, quantified as a percentage of the occupied area in each HS and its surrounding territory (Thiessen polygons). The second matrix contained the socio-economic characteristics assigned to the spatial units as a percentage of the value of each variable in each HS with respect to the total value of the same variable in the study area.
Step 2: quantifying socio-ecological webs – current scenario
We used a procedure based on Schmitz et al. (Reference Schmitz, De Aranzabal, Aguilera, Rescia and Pineda2003). In order to quantify the current relationship between biophysical characteristics and socio-economy, we performed a canonical correlation analysis (CCA) that allowed the relationship between the two variable sets to be examined (Sherry & Henson Reference Sherry and Henson2015). Taking into account the analytical requirements of normality and homoscedasticity, we standardized and log(x + 1) transformed the data, where x represents the value of each socio-ecological variable in the area surrounding each HS. We identified and mapped HS types by segmenting the CCA plane into five intervals using the natural break method, based upon the coordinates of the observations projected on the ordination plane (Ruiz-Labourdette et al. Reference Ruiz-Labourdette, Schmitz and Pineda2013).
Step 3: simulation of socio-ecological shifts under CC scenarios
We simulated socio-ecological changes in the future under four scenarios based on climate conditions predicted for the 21st century according to IPCC (2000). We used A1F1, A2, B1 and B2 scenarios with the HadCM3, a coupled atmosphere–ocean general circulation model (Collins et al. Reference Collins, Tett and Cooper2001). The adaptation of this global model to a regional scale was achieved through the downscaling performed by the Agencia Estatal de Meteorología (AEMET), with a resolution of 50 × 50 km2. For the Canary Islands, the downscaling was performed using statistical techniques, which use transfer functions to convert global-scale outputs to regional-scale conditions (Morata Reference Morata2014). This is one of the most used tools in CC studies as it enables the construction and testing of scenarios (Wilby et al. Reference Wilby, Dawson and Barrow2002).
The four scenarios considered represent 68% of the range of uncertainty in emissions, as measured by cumulative carbon dioxide emissions (1990–2100), compared to the full set of 40 scenarios (IPCC 2000; Mitchell et al. Reference Mitchell, Carter, Jones, Hulme and New2004). Scenarios differed mainly in carbon predicted to be emitted from energy and industrial sources by 2100. The A1F1 scenario is highlighted by the intensive use of energy sources of fossil origin (an atmospheric CO2 concentration of 30.3 Gt in 2100); the A2 scenario involves a semi-intensive use of fossil fuels (an atmospheric CO2 concentration of 28.9 Gt in 2100); and scenarios B1 and B2 involve lower CO2 emissions (an atmospheric CO2 concentration of 5.2 Gt and 13.8 Gt in 2100, respectively).
The forecasts of climate variation (Table 2) for each of the scenarios (Mitchell et al. Reference Mitchell, Carter, Jones, Hulme and New2004) suggest greater aridification of the island and, therefore, substantial changes in vegetation distribution. This effect of CC involves the modification of some of the main descriptors of vegetation and land uses. The prediction of species responses to novel climates may be problematic due to the lack of observational data to determine their behaviour (Williams & Jackson Reference Williams and Jackson2007). Thus, predictions were based on literature reviews, considering real present-day tendencies in Fuerteventura, within reasonable variation thresholds, taking into account extreme values of the variables in the spatial units and the prediction limits of the model (Arco Reference Arco and Afonso-Carrillo2008; De Aranzabal et al. Reference De Aranzabal, Schmitz, Aguilera and Pineda2008). Using the results of the CC hypotheses for the Canary Islands as a basis, we designed four quantitative biophysical matrices, one for each scenario. In all four cases, the interdependence between these predicted biophysical data and socio-economic descriptors was analysed by CCAs, which provided the coordinates of the HSs on the axes describing the new socio-ecological structures derived from the scenarios. The analysed data fulfilled the basic assumptions of the CCA procedure concerning sample size issues, linearity and normality.
Table 2 Forecasts of climate variation for the four Intergovernmental Panel on Climate Change scenarios considered.

The comparison between the current CCA plane and those of the CC scenarios allows for the quantification of the socio-ecological change derived from CC. We considered the magnitude and direction of changes based upon the value and sign of the increments of the coordinates (Δcoord) of the HS set represented on the CCA planes, calculated as the difference in the value of the coordinates in the CC scenario in relation to the present one. We assumed changes were significant when Δcoord was ≥25% in relation to maximum Euclidean distance between the current and simulated scenarios. We used the results of CC simulation for mapping the potential socio-ecological configuration of Fuerteventura.
RESULTS
Socio-ecological characterization
The CCA axes (Fig. 2) were generated to yield the largest possible correlation between the variables. The first axis (variance explained: 32.94%) is the product of the maximum possible correlation between HSs and variable scores. It explains environmental variation along an altitudinal gradient from coast with beaches, dunes and halophyte vegetation to medium and high inland agricultural lands. The other components of the axis are the socio-economic variables showing a gradient related to local economic development. This process is linked to the structure of the local population that constitutes an active and traditional socio-economic system (positive end of the axis), and to a tourism system in which the native population has little representation (negative end of the axis). Non-native people are concentrated in tourism areas.

Figure 2 Scheme of the canonical correlation analysis (CCA) results in the current scenario. Biophysical and socio-economic variables with higher scores are indicated at the ends of the axes. Circles represent the human settlement types: coupled local socio-ecological systems (SESs; green); transition local SESs (orange); decoupled local SESs (red); transition tourism SESs (blue); and coupled tourism SESs (light green). Codes of the settlement numbers can be found in Appendix S1.
The second axis (variance explained: 14.85%) also has maximal site–variable correlation (Fig. 2), subject to the constraint that the axes are orthogonal. It again shows environmental variation derived from the altitudinal gradient, where low altitudes are occupied by urban development and the remnants of natural vegetation, while higher areas have scarce vegetation and agricultural systems show signs of abandonment. The local population is associated with a process of decline of agrarian-based activities (‘deagrarianization’) and with the recognition of cultural interest goods and the natural heritage of the rural areas (‘patrimonialization’; positive end of the axis). The non-native population is nevertheless associated with urbanized areas (negative end of the axis). This spatial variation highlights the loss of rural areas as significant socio-economic change occurred in Fuerteventura (‘deruralization’).
The optimal patterns of joint association between biophysical and socio-economic variables are defined by the ordination diagram. Thus, the analysis performed allows us to interpret the territory in terms of socio-ecological webs where human and biophysical systems are linked with different degrees of intensity and meanings. The results indicate the transition of Fuerteventura from a coupled local SES to a different type of coupled system derived from the interaction between the coastal environment and tourism. This new system implies the decoupling of local people from their traditional environment. A segmentation of the ordination plane allows us to obtain five types of HSs according to their socio-ecological characteristics and degree of coupling (Fig. 2). At the right end of the ordination plane, we observe a first socio-ecological type characterized by a high degree of coupling (‘coupled local SES’), in which the local population plays an important role. It is a group of HSs located in inland areas, where the local socio-economic system remains active. The socio-ecological characteristics of the second type of HSs denote a state of transition between rural coupling and decoupling (‘transition local SES’). Rural decoupling is the main characteristic of the third socio-ecological type detected (‘decoupled local SES’). This group encloses inland HSs subjected to rural abandonment and urbanization processes and occupied by non-native people. The remnant local population is related to the heritage valorization of traditional rural spaces. The fourth and fifth HS types (‘transition tourism SES’ and ‘coupled tourism SES’, respectively) represent final stages of the gradual transformation of rural areas into a tourism system that is mainly developed in coastal areas. This tourism expansion is related to non-native people and to social and environmental problems (Fig. 2).
Important parts of the areas that currently have decoupled traditional SESs belong to the core and buffer zones of the biosphere reserve and are particularly aimed at enhancing both the conservation of natural resources and the rural cultural landscape (‘core areas’ and ‘buffer areas’, respectively; Fig. 3).
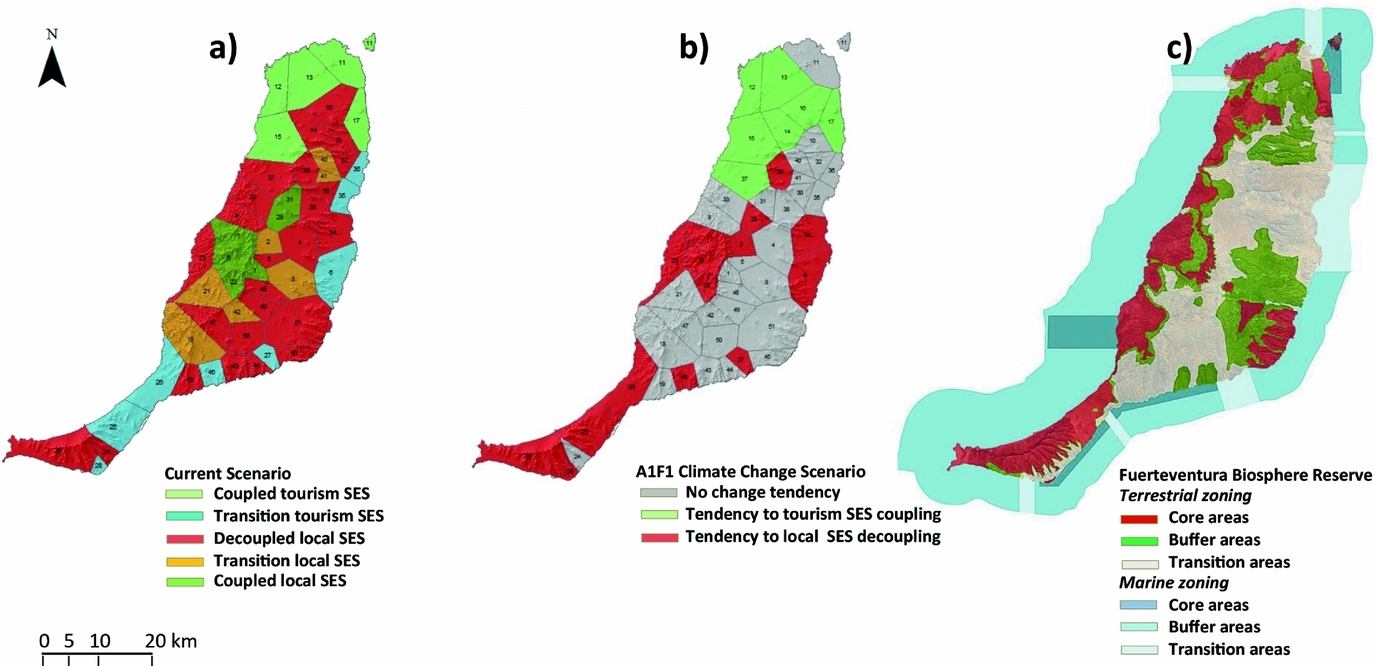
Figure 3 Mapping of the socio-ecological webs of Fuerteventura. (a) Current scenario; (b) climate change scenario (A1F1; Intergovernmental Panel on Climate Change); (c) Fuerteventura Biosphere Reserve. Codes of settlement numbers can be found in Appendix S1. SES = socio-ecological system.
Simulated changes in the SES
The planes of the CCAs applied to the data matrices of the four scenarios of the IPCC show the simulated socio-ecological structure according to the climatic scenarios. The CCAs of the current scenario and those of CC have similar ranges of variation (from –3.0 to 3.0), indicating that the present and simulated socio-ecological relationships are distributed in spaces of equal dimensions and are therefore comparable to each other (Figs 2 and 4). There is a similar displacement of the HSs in the four assumptions of change, although the intensity of change is more pronounced under the A1F1 scenario of high emissions (Fig. 4). In all situations, the displacement mainly affects SESs with a relative high coupling in the current scenario (coupled local SESs and coupled tourism SESs), and especially those that are linked to the tourism system, which change towards a greater degree of coupling (displacement towards the negative end of CCA axis 1; Fig. 4).

Figure 4 Canonical correlation analysis (CCA) plane of the socio-ecological changes simulated in Fuerteventura according to projected A1F1 Intergovernmental Panel on Climate Change scenario. Codes of settlement numbers can be found in Appendix S1.
Regarding HSs characterized in the current scenario as coupled local SESs, their variation with CC is towards rural decoupling (displacement tendency towards the positive end of CCA axis 2; Fig. 4), characterized by deruralization and deagrarianization processes.
The change tendency in the socio-ecological typology under the A1F1 emission scenario of high emissions is towards north–south variation in socio-ecological decoupling. The CC intensifies the ongoing rural decoupling in the core and buffer areas of the biosphere reserve (Fig. 3), which have the highest degrees of protection and were specially designed to manage changes in SESs.
DISCUSSION
The method developed allowed us to understand the functional connectivity between nature and human systems (socio-ecological webs) and to characterize the degree of socio-ecological coupling of each HS of Fuerteventura. The applied model is a simple tool that avoids the complexity involved in other models (Van Nes & Scheffer Reference Van Nes and Scheffer2005). Its limitations are those inherent to the availability and resolution of environmental and socio-economic databases at the required scale. We use a multidimensional approach to analyse multiple ecosystem components at the same time. This allows for the definition of different states of the system and the quantification of the intensity of changes due to environmental shifts (Barros et al. Reference Barros, Thuiller, Georges, Boulangeat and Münkemüller2016). Therefore, this numerical procedure permits the prediction of variations in SESs (‘novel systems’; Williams & Jackson Reference Williams and Jackson2007) under realistic scenarios of CC, within the limits set by the restrictions of the model.
Although this study focuses on a specific area, the method can be extrapolated to other areas, since it allows for the quantification of the relationship between landscape and socio-economy of any territory. Similar procedures have been used to characterize the links between different types of structures, mainly in rural cultural landscapes (Schmitz et al. Reference Schmitz, De Aranzabal, Aguilera, Rescia and Pineda2003; De Aranzabal et al. Reference De Aranzabal, Schmitz, Aguilera and Pineda2008; Schmitz et al. Reference Schmitz, Matos, De Aranzabal, Ruiz-Labourdette and Pineda2012), and to obtain variation models resulting from the simulation of CC scenarios (Ruiz-Labourdette et al. Reference Ruiz-Labourdette, Schmitz and Pineda2013).
In this island, natural capital provides minimal conditions for human survival and the extreme environmental conditions prevent high agricultural productivity (Fig. 1). Nevertheless, a rural culture emerged with a balanced relationship between people and nature on which the local economy depended. The cultural, ethnological and natural values of this SES were recognized with the establishment of the biosphere reserve.
Across the environmental gradients, the land uses and socio-economic characteristics of the inhabitants of the island vary (Fig. 2). The main socio-ecological gradient (first CCA axis) indicates the existence of both a coupled and socio-economically active local system, which preferentially occupies inland areas, where traditional productive activities persist, and a tourism system associated with coastal zones, where the local population is currently not well represented and has little participation in its management and governance. The rural–tourism contrast appears along the first CCA axis, characterizing the current socio-economic structure of Fuerteventura. The tourism industry has promoted significant economic and social change, involving the gradual transformation of traditional rural activities linked to the primary economic sector towards others based on the tertiary economic sector. Coastal zones are today the main tourist areas, many of which suffer from the typical impacts of tourism developments with weak management (impacts on hygiene, health and the internal structure of host communities; Butler Reference Butler2006). The substitution of rural culture by tourism energizes the labour market and modifies the cultural heritage and historical identity (Antošová Reference Antošová2014). This process has greatly increased the dependence of the local economy on the tourism industry.
The second CCA axis reveals a significant socio-ecological gradient, which is consistent with the variation expressed by the former axis. Such redundancy is good, because some errors in measuring the environmental data may be averaged out (Palmer Reference Palmer1993). In this case, an altitudinal gradient from the coast to inland is related to deruralization, deagrarianization and urbanization processes, mainly for the residence of the non-native population, and patrimonialization of traditional rural culture and natural areas by the local population. Traditional land-use abandonment and urbanization are processes that are listed among the main pressures and threats to European habitats (European Commission 2016) and are related to the uprooting and eradication of rural spaces (Chesnais Reference Chesnais2001). Urban expansion, deagrarianization and appreciation of natural and cultural rural goods (heritage valorization) are associated phenomena, being causes and consequences of the same process of change that leads to a new socio-cultural construction of patrimony and cultural heritage, where rural areas and local identity are fundamental determinants of territorial development (Sharpley & Jepson Reference Sharpley and Jepson2011). This is a frequent process in European rural areas, where the value of local heritage and territorial identity are taken into consideration in initiatives of support and programmes of the European Union (European Commission 2014). In the Canary Islands, initiatives have been promoted for managing heritage and establishing protected natural areas in an attempt to avoid planning errors that threaten island ecosystems (García-Rodríguez et al. Reference García-Rodríguez, García-Rodríguez and Castilla-Gutiérrez2016).
Cultural landscapes as world heritage elements were considered to be conservation opportunities for rural landscapes with exceptional values (Mitchell et al. Reference Mitchell, Rössler and Tricaud2009), but there has been abandonment or replacement of this approach by new economically competitive activities. The biosphere reserve has not prevented the decoupling of the secular relationship between human societies and nature in many areas of the island. This is not a unique case in relation to the establishment of protected areas (Schmitz et al. Reference Schmitz, Matos, De Aranzabal, Ruiz-Labourdette and Pineda2012).
We deduce that the Fuerteventura SES is composed of subsystems with different degrees of coupling: a strong human–environment interaction in a given subsystem can mean an intense decoupling for another. SESs are remarkably complex, dynamic and adjustable (Gual & Norgaard Reference Gual and Norgaard2010; Reynolds et al. Reference Reynolds, Grainger, Stafford Smith, Bastin, Garcia-Barrios, Fernández, Janssen, Jürgens, Scholes, Veldkamp, Verstraete, Von Maltitz and Zdruli2011) and can self-organize around different points or attractors (Biggs et al. Reference Biggs, Blenckner, Folke, Gordon, Norström, Nyström, Peterson, Hastings and Gross2012).
CC is today regarded as one of the main factors in the Fuerteventura SES that is modifying tourism trends due to its direct connection to nature and climate conditions (Hamilton & Tol Reference Hamilton and Tol2004; Bujosa & Rosselló Reference Bujosa and Rosselló2013). Island destinations are considered very vulnerable to climate impacts (Uyarra et al. Reference Uyarra, Côté, Gill, Tinch, Viner and Watkinson2005). Nevertheless, in this case, simulations conducted under four IPCC scenarios based on the available data show both a tendency to increase the decoupling of local systems and a greater coupling of tourism systems across the island (Figs 3a, 3b and 4). The projected trends in the climate parameters show accelerated warming and decreases of rainfall in the Canary Archipelago (García-Herrera et al. Reference García-Herrera, Gallego, Hernández, Gimeno, Ribera and Calvo2003; Martín et al. Reference Martín, Bethencourt and Cuevas-Agulló2012). Fuerteventura exhibits a desert-like climate and vegetation. CC would cause greater aridity and an increase in the tendencies of deruralization. The predicted increases in the decoupling of local systems and the coupling of tourism systems could be interpreted as responses of the local economy to greater difficulties in effectively using natural resources and to increasingly favourable climatic conditions for tourism.
CONCLUSION
The method developed allows for the interpretation of Fuerteventura in terms of socio-ecological webs, which depend on an environmental gradient and associated economic development. In social terms, this process is expressed by the variation of the inhabitants’ typology (from native local to non-native people). The local population is linked with the cultural and natural patrimonialization of rural areas, which is currently characterized by a deruralization process. Non-native people are associated with the tourism system. The Fuerteventura SES is composed of subsystems with different degrees of coupling. Tourism-coupled systems appear to be parallel to the local decoupling.
The establishment of a biosphere reserve seems not to have foreseen the decoupling of the secular relationship between human societies and nature in an island influenced by the tourism industry.
The IPCC scenarios that were tested according to our model indicate a tendency to increase both the decoupling of local systems and the coupling of tourism systems. It is noteworthy how CC intensifies the tendency to rural decoupling in the buffer and core zones of the biosphere reserve.
ACKNOWLEDGEMENTS
This research was supported by Fuerteventura Cabildo (Proj. 314/2006-228/2008) and CULTURESCAPES (Proj. H2015/HUH-3383; European Social Fund – Madrid Government). The authors thank Professor N. Polunin and three anonymous reviewers for their helpful and constructive comments.
Supplementary material
For supplementary material accompanying this paper, visit https://doi.org/10.1017/S0376892917000169


