Introduction
The outcome of crop–weed competition depends on the relative abilities of the crop and weed to obtain limited resources or tolerate a resource deficit (Patterson Reference Patterson1995). Light is the only environmental resource for which there is no soil, atmosphere, or plant reservoir (Patterson Reference Patterson1995). Competition for light is driven by total leaf area and vertical distribution and orientation of those leaves in the canopy (Kropff and van Laar Reference Kropff and van Laar1993). Many plants maintain a higher leaf area ratio (LAR) in the absence of competition, allowing them to better compete for light when competition exists (Anten Reference Anten2005). Partitioning of new biomass to leaves and stems is an important determinant of total leaf area, leaf display, and LAR. Plants can respond to environmental variation by altering the partitioning of new biomass among plant organs to maximize resource capture and growth (Bloom et al. Reference Bloom, Chapin and Mooney1985). Increased organ growth can be obtained through increases in size or number of components such as leaves or branches (Bradshaw Reference Bradshaw1965).
Soybean plasticity to seeding rate (Board Reference Board2000; Elmore Reference Elmore1998; Vega et al. Reference Vega, Sadras, Andrade and Uhart2000; Vega and Sadras Reference Vega and Sadras2003), row spacing (Elmore Reference Elmore1998; Knezevic et al. Reference Knezevic, Evans and Mainz2003), and variability in seedling emergence (Andrade and Abbate Reference Andrade and Abbate2005; Egli Reference Egli1993) have been demonstrated and attributed to soybean’s indeterminate growth habit and prolific branching ability (Kasperbauer Reference Kasperbauer1987). Soybean specific leaf weight has been shown to increase with light intensity (Bowes et al. Reference Bowes, Ogren and Hageman1972). When soybean was shaded to levels similar to those encountered when in competition with common cocklebur (Xanthium strumarium var. pensylvanicum), velvetleaf (Abutilon theophrasti Medik.), and jimsonweed (Datura stramonium L.), similar yield loss occurred, indicating that light from weed shading was the primary limiting resource (Stoller and Woolley Reference Stoller and Woolley1985). Drought during soybean reproduction resulted in decreased leaf area index (LAI) and vegetative biomass, and increased seed size, which compensated for fewer total reproductive structures per unit area (Andriani et al. Reference Andriani, Andrade, Suero and Dardanelli1991).
Common ragweed is a monoecious, annual weed in the Asteraceae family known for its early spring emergence and late-season seed production (Bassett and Crompton Reference Bassett and Crompton1975). Its greatest growth has been reported to occur in July and August in Ottawa, Canada (Bassett and Crompton Reference Bassett and Crompton1975). Dickerson and Sweet (Reference Dickerson and Sweet1971) reported that noncompeting plants emerging after July 8 produced an average of 3,135 seeds per plant, whereas one early-emerging plant produced 62,000 seeds. Common ragweed can grow to over 2 m in height under intraspecific competition (Clewis et al. Reference Clewis, Askew and Wilcut2001), suggesting that biomass partitioning has a plastic response to the presence of other plants.
Studies have reported that common ragweed interference can result in substantial yield loss (Barnes et al. Reference Barnes, Jhala, Knezevic, Sikkema and Lindquist2018; Coble et al. Reference Coble, Williams and Ritter1981; Cowbrough et al. Reference Cowbrough, Brown and Tardif2003; Shurtleff and Coble Reference Shurtleff and Coble1985; Weaver Reference Weaver2001). However, little is known about the growth response of soybean to common ragweed competition for light or soil water. Common ragweed has been shown to increase shoot biomass allocation with increasing intraspecific competition (Leskovšek et al. Reference Leskovšek, Datta, Knezevic and Simončič2012a). Patracchini et al. (Reference Patracchini, Vidotto and Ferrero2011) determined that common ragweed in monoculture produced less LAI and biomass per plant but more per unit area with increasing density. Common ragweed in monoculture produced fewer seeds per plant as intraspecific competition increased (Leskovšek et al. Reference Leskovšek, Eier, Batič and Simončič2012b). McConnaughay and Coleman (Reference McConnaughay and Coleman1999) reported no plastic response to extreme changes in water availability in velvetleaf, common lambsquarters (Chenopodium album L.), and Pennsylvania smartweed [Persicaria pensylvanica (L.) M. Gómez].
To improve our understanding of crop–weed competitive relationships, it is necessary to understand weed adaptive responses to unfavorable conditions (Brainard et al. Reference Brainard, Bellinder and DiTommaso2005). The effect of varying levels of available soil water on common ragweed competition and soybean in monoculture and mixture has not been determined. We hypothesized that soybean and common ragweed would respond to water availability and interference by altering their growth. Although increasing competition is expected to reduce overall growth and yield of soybean and common ragweed, it is expected that both species will alter biomass partitioning or leaf size to increase competitiveness for light and soil water. Therefore, the objective of this study was to characterize the growth response of soybean and common ragweed in mixture and monoculture to varying irrigation levels and increasing common ragweed density.
Materials and methods
A field experiment was conducted in 2015 and 2016 at the University of Nebraska–Lincoln’s Eastern Nebraska Research and Extension Center (ENREC) near Mead, NE (41.1649° N, 96.4234° W). The soil was a Filbert silt loam (fine, smectitic, mesic Vertic Argialbolls; 25.6% clay, 63.6% silt, 10.8% sand) with a pH of 6.8 and 2.7% soil organic carbon. A split-plot experimental design was used with four replications. Non-randomized main-plot irrigation treatments were established to achieve full, half, or zero replacement of evapotranspiration (ET) using recommendations of SoyWater (Specht et al. Reference Specht, Torrion, Setiyono, Cassman, Suat, Hubbard, Schulski, Li and Sorensen2010). Main plots were centered at 2.3, 9.9, and 19 m, respectively, from a solid-set irrigation system (Specht et al. Reference Specht, Williams and Weidenbenner1986, Reference Specht, Chase, Macrander, Graef, Chung and Markwell2001). Five subplot treatments 3 m wide (four soybean rows spaced 0.76 m apart) by 9 m long were randomized within the main plots and consisted of varying common ragweed densities, including 0 (weed-free), 2, 6, and 12 common ragweed plants m−1 row with soybean and 2 common ragweed plants m−1 row without soybean. These densities were chosen based on previous literature on soybean and common ragweed competition, where similar common ragweed densities resulted in low to high soybean yield loss, indicating a gradient of interspecific competition (Coble et al. Reference Coble, Williams and Ritter1981; Cowbrough et al. Reference Cowbrough, Brown and Tardif2003; Weaver Reference Weaver2001).
Experimental procedures
The field was disked in early spring to prepare a seedbed. Plots were hand-sown by broadcasting common ragweed seed (Roundstone Native Seed LLC, Upton, KY 42784) on April 30, 2015 and April 22, 2016. On May 17, 2015 and May 27, 2016, 50% common ragweed emergence was observed. Rainfall of 11 cm between May 9 and May 12, 2016 resulted in flooding of a portion of the experimental area for several days. Although common ragweed was sown earlier than in 2015, anoxic soil conditions killed emerged and germinating seeds, ultimately delaying 2016 emergence. Glyphosate-resistant soybean was planted at 370,500 seeds ha−1 in 76-cm rows on May 13, 2015 (Pioneer 31T11; DuPont Pioneer, Johnston, IA 50131) and May 19, 2016 (Asgrow 2636; Monsanto, St. Louis, MO 63110). Buffers and borders were maintained weed-free with glyphosate (900 g ae ha−1) applications and hand hoeing as needed. Uniform soybean emergence occurred on May 23, 2015 and May 27, 2016. Common ragweed was thinned by hand weeding to evenly spaced target densities restricted within a 15-cm band over the soybean row prior to soybean reaching the V2 growth stage. Hand pulling and hoeing were done to maintain common ragweed densities and remove naturally occurring weeds within the plots. Two irrigation gauges were placed in each main-plot replication. Irrigation was implemented on August 3, 2015 [100%, 3.8cm (± 0.12); 50%, 1.6cm (± 0.09)], July 25, 2016 [100%, 3.8cm (± 0.18); 50%, 1.4cm (± 0.16)], and August 09, 2016 [100%, 0.7cm (± 0.05)]; 50%, 0.4cm (± 0.04)].
Data collection
Volumetric soil water content was measured weekly from each 0 (soybean monoculture) and 6 common ragweed plants m−1 row subplot using a PR2 soil moisture probe (Dynamax Inc., Houston, TX 77099). Destructive samples of soybean and common ragweed were taken in all subplots at the soybean V3, R1, R4, and R6 growth stages. Destructive samples were taken by counting and clipping plants at the soil surface from a 1-m row sample at least 0.5 m from the edge of each subplot. In 2015, soybean plants were separated into stem, petiole, leaf, and reproductive tissue groups, and ragweed plants were separated into stem and leaf tissue groups for the entire 1-m sample. Soybean leaves were clipped at the base of the lamina separating each trifoliate leaflet. Soybean petioles were removed from the soybean stem, with the bud remaining with the petiole. Common ragweed petioles remained with the stem, and leaves were clipped at the base of the lamina. Soybean flowers and pods were removed to obtain reproductive tissue mass. Leaf area was measured on a LAI 3100 leaf area meter (LI-COR, Lincoln, NE 68504) on all plants in the entire 1 m of the V3 and R1 samples, whereas the R4 and R6 leaf area measurements were obtained from four randomly selected soybean and two ragweed plants within the 1-m sample. As a result of sample loss, biomass was not obtained from any plots and leaf area was not measured from the 50% irrigation main plots during the R6 destructive sample in 2015. In 2016, four random soybean plants and two randomly selected ragweed plants from the respective 1-m samples were separated into stem, petiole, leaf, and reproductive tissue groups as described above and used to scale the entire sample. Tissue samples were dried in paper bags at 65 C for 10 d, weighed, and summed to determine total aboveground biomass. Plant stem height was measured from two plants per plot at soybean R5 stage from the base of the stem to highest stem bud. To obtain common ragweed seed production, two randomly selected plants were harvested in the second week of October from the center two rows of each subplot, clipped at the soil surface, and dried to a constant weight; the seeds were then counted and the 100-seed weight determined from four random subsamples of 100 seeds. Soybean yield was obtained by harvesting 6.1 m of row using a plot combine and correcting grain mass (kg ha−1) to 13% moisture content (Barnes et al. Reference Barnes, Jhala, Knezevic, Sikkema and Lindquist2018). Soybean grain was dried at 65 C for 30 d and 100-seed weight determined. Final common ragweed density was obtained by counting the number of plants within the harvest area prior to soybean harvest.
Soybean and common ragweed partitioning coefficients (PCs; %) were calculated for the first three harvest intervals in 2015 and for all four harvest intervals in 2016 using Equation 1 (Knezevic et al. Reference Knezevic, Vanderlip and Horak2001):
 $${P}{{C}_{\left( {{\rm{stem, leaf, reproductive}}} \right)}}{\rm{ = \Delta }}{{W}_{\left( {{\rm{stem, leaf, reproductive}}} \right)}}{\rm{/\Delta }}{{W}_{\left( {{\rm{whole \,plant}}} \right)}}$$
([1])
$${P}{{C}_{\left( {{\rm{stem, leaf, reproductive}}} \right)}}{\rm{ = \Delta }}{{W}_{\left( {{\rm{stem, leaf, reproductive}}} \right)}}{\rm{/\Delta }}{{W}_{\left( {{\rm{whole \,plant}}} \right)}}$$
([1])
where PC (stem, leaf, reproductive) is the partitioning coefficient of stem, leaf, or reproductive tissue of soybean or common ragweed; ΔW (stem, leaf, reproductive) is the change in dry biomass of the stem, leaf, or reproductive tissue of soybean or common ragweed from the previous destructive sample; and ΔW (whole plant) is the change in dry biomass of total aboveground biomass of soybean or common ragweed from the previous destructive sample. Soybean and common ragweed specific leaf area (SLA; cm2 g−1) was calculated by dividing the leaf area by the leaf dry mass (Brainard et al. Reference Brainard, Bellinder and DiTommaso2005). Soybean and common ragweed LAR (cm2 g−1) were calculated by dividing the leaf area by the total aboveground dry mass (Hunt Reference Hunt1982). Leaf area data from the four destructive samples were converted to leaf area index (LAI; m2 m−2) based on the area of the sample and the final soybean or common ragweed density. Soybean PC leaf included the weight of the petiole, whereas soybean SLA, LAR, and LAI were calculated using only laminae. Daily maximum and minimum temperatures were acquired from the nearest High Plains Regional Climate Center (HPRCC) station approximately 5 km from the experimental field (41.14306° N, -96.48083° W). Temperatures were separately converted to cumulative growing degree days (GDDs) after emergence for soybean and common ragweed using Equation 2 (Gilmore and Rogers Reference Gilmore and Rogers1958):
 $${\rm{GDD = }}\sum {\rm{([\{ }}{{T}_{{\rm{max}}}}{\rm{ + }}{{T}_{{\rm{min}}}}{\rm{\} / 2] - }}{{T}_{{\rm{base}}}}{\rm{)}}$$
([2])
$${\rm{GDD = }}\sum {\rm{([\{ }}{{T}_{{\rm{max}}}}{\rm{ + }}{{T}_{{\rm{min}}}}{\rm{\} / 2] - }}{{T}_{{\rm{base}}}}{\rm{)}}$$
([2])
where T max and T min are the daily maximum and minimum air temperatures (C), respectively, and T base is the base temperature. A T base of 10 C was selected based on the minimum germination temperatures for common ragweed (Brandes and Nitzsche Reference Brandes and Nitzsche2006, Leskovšek et al. Reference Leskovšek, Datta, Knezevic and Simončič2012a, Reference Leskovšek, Eier, Batič and Simončič2012b) and soybean (Akyuz et al. Reference Akyuz, Kandel and Morlock2017; Major et al. Reference Major, Johnson, Tanner and Anderson1975). Partitioning coefficients are plotted as a function of GDDs accumulated since soybean emergence, where the GDD at a specific time is calculated as GDDt – (GDDt – GDDt – 1)/2.
Statistical analysis
Effects of year, irrigation, and density treatments, and their interactions on soybean and common ragweed PCs, total aboveground biomass (g m−2), SLA, and LAI were subjected to ANOVA in R version 3.3.2 (R Core Team 2016) using the ssp.plot (split-split plot) function in the agricolae package (de Mendiburu Reference de Mendiburu2016). Replacement ET level was treated as the main plot, and common ragweed density as the subplot. The stages at which sampling occurred were treated as pseudo-replications within subplots (sub-subplot). Soybean and common ragweed 100-seed weight and common ragweed seeds per plant were analyzed as above but without sampling stage as a variable. For all ANOVA tests, replication nested within year was treated as a random effect. If year-by-treatment interactions were significant, data were analyzed separately among years. Tukey’s least significant difference was used to separate means at α = 0.05. Contrast analyses were performed to better assess differences between monoculture and mixture subplots.
Results and discussion
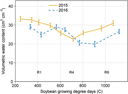
Temperature and rainfall in 2015 and 2016 were similar (Figure 1), and most of the available soil water lost through ET was replenished by rainfall. As a result of ample rainfall and adequate soil water content, irrigation was only triggered once in 2015 and twice in 2016. Volumetric water content at the 30-cm depth remained between 20% and 35% throughout most of the soybean reproductive stages in 2015 and 2016 (Figure 2) and was often greater at deeper soil depths (30 to 100 cm; data not shown). Therefore, substantial impacts of irrigation treatments on soybean or common ragweed growth and their interference are not expected. Year-by-treatment interactions for all variables were nonsignificant; therefore, data were combined across years.
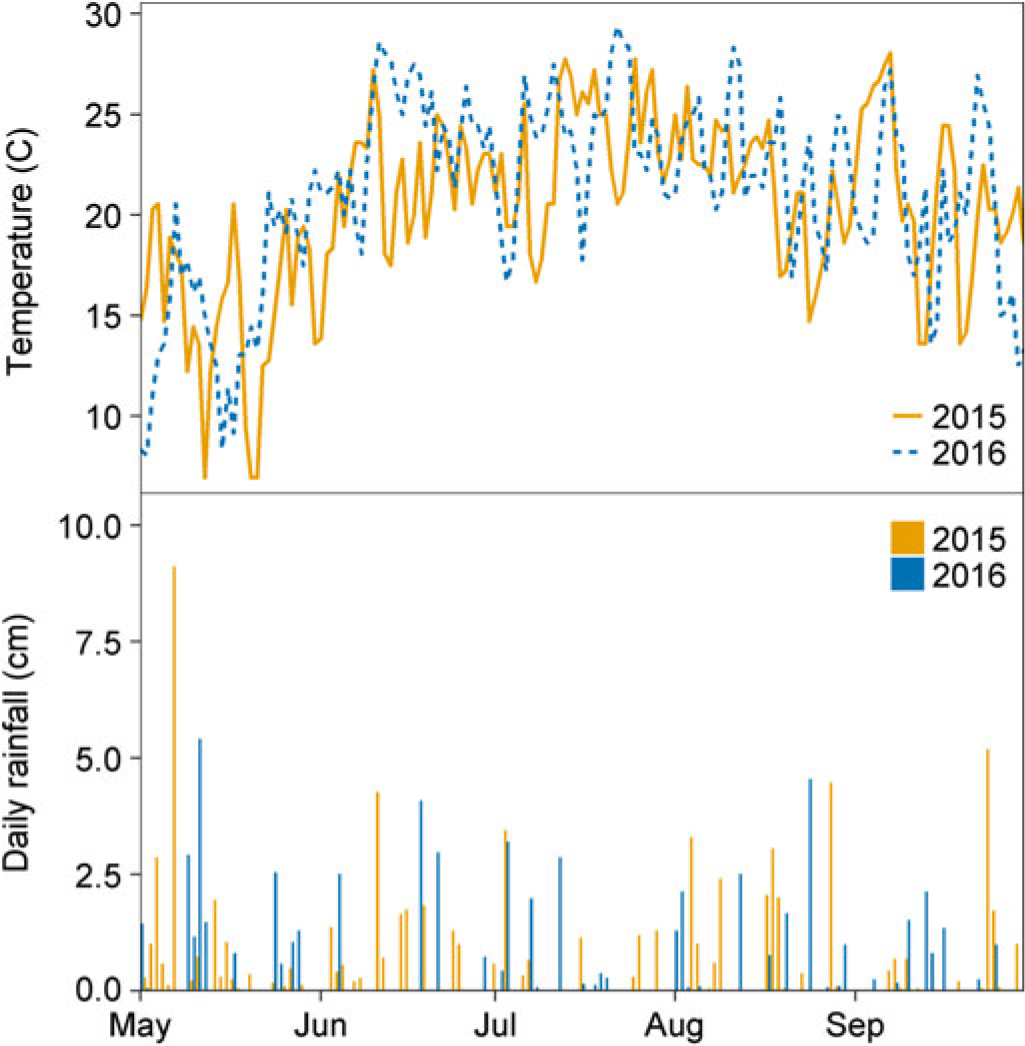
Figure 1. (A) Average daily air temperature (°C) and (B) total daily rainfall (cm) obtained from the nearest High Plains Regional Climate Center in a field experiment conducted in 2015 and 2016 at the University of Nebraska-Lincoln’s Eastern Nebraska Research and Extension Center (ENREC).

Figure 2. Volumetric water content (cm3 cm−3) collected throughout the growing season (R1, beginning bloom; R4, full pod; R6, full seed) at 30 cm depth in a field experiment conducted in 2015 and 2016 at the University of Nebraska-Lincoln’s Eastern Nebraska Research and Extension Center (ENREC).
Biomass partitioning
Soybean aboveground biomass partitioning to leaves, stems, and reproductive tissues was not affected by irrigation treatment or common ragweed density but did change throughout the season (Table 1). Seventy-five percent of new soybean biomass was partitioned to leaves from emergence to V3 (163 GDD) and decreased nearly linearly to 0.05 between the R4 to R6 stages (1,013 GDD) (Figure 3A). Soybean biomass partitioning to stems increased linearly from 0.25 from emergence to V3 (163 GDD) to 0.42 during R1 to R4 (701 GDD), then declined to 0.10 between the R4 and R6 stages (1,013 GDD; Figure 3A). As expected, biomass partitioning to reproductive tissue increased at an increasing rate from 0.02 during V3 to R1 (413 GDD) to 0.85 between R4 and R6 (1,013 GDD; Figure 3A). Soybean did not partition new aboveground biomass to stems or leaves differently with or without common ragweed present.
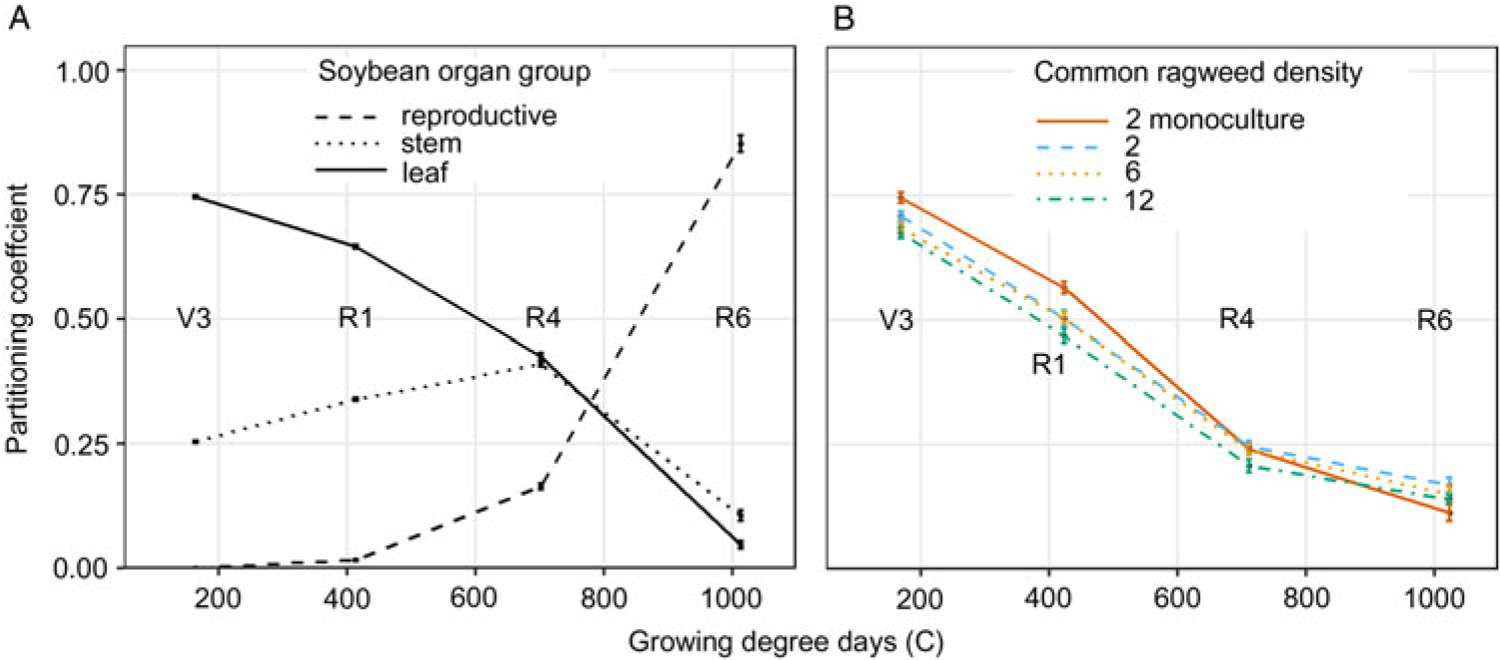
Figure 3. (A) Soybean partitioning coefficient of reproductive, stem, and leaf throughout the growing season in combined monoculture and mixture with common ragweed treatments at the V3 (third trifoliate), R1 (beginning bloom), R4 (full pod), and R6 (full seed) soybean growth stage. (B) Common ragweed partitioning coefficient of leaf throughout the growing season in monoculture (2 plants m−1 row) and in mixture (2, 6, and 12 plants m−1 row) with soybean in a field experiment conducted in 2015 and 2016 at the University of Nebraska-Lincoln’s Eastern Nebraska Research and Extension Center (ENREC).
Table 1. ANOVA for soybean partitioning coefficients, specific leaf area, leaf area ratio, leaf area index, aboveground biomass, height, and 100-seed weight in a field experiment conducted in 2015 and 2016 at the University of Nebraska-Lincoln’s Eastern Nebraska Research and Extension Center (ENREC) near Mead, NE.a,2

a Abbreviations: ET, evapotranspiration; LAI, leaf area index; LAR, leaf area ratio; PC, aboveground biomass partitioning coefficient of leaf, stem, or reproductive tissues; SLA, specific leaf area.
a Significance levels: NS, nonsignificant at α = 0.05; *P ≤ 0.05; **P ≤ 0.01; ***P ≤ 0.001.
Common ragweed destructive samples were separated only into leaves and stems. Therefore, the sum of PC leaf and PC stem will always add to 1.0, and their errors are identical. The fraction of new biomass partitioned to leaves declined, whereas that to stems increased throughout the growing season in all treatments, similar to the results of Leskovšek et al. (Reference Leskovšek, Datta, Knezevic and Simončič2012a) (Figure 3B). Ragweed biomass partitioning was affected by an interaction between common ragweed density and sampling stage (Table 2). In competition with soybean, common ragweed partitioned less to leaves and more to stems with increasing common ragweed density (Figure 3B). In monoculture, common ragweed partitioned more to leaves than all mixture densities throughout most of the growing season. However, late in the growing season (1,023 GDD), common ragweed in monoculture partitioned 6% less biomass to leaves than 2 common ragweed plants m−1 row in mixture (Figure 3B).
Table 2. ANOVA table for common ragweed partitioning coefficients, specific leaf area, leaf area ratio, leaf area index, aboveground biomass, height, 100-seed weight, and seed number in a field experiment conducted in 2015 and 2016 at the University of Nebraska-Lincoln’s Eastern Nebraska Research and Extension Center (ENREC). near Mead, NEa, b

a Abbreviations: ET, evapotranspiration; LAI, leaf area index; LAR, leaf area ratio; PC, aboveground biomass partitioning coefficient of leaf, stem, or reproductive tissues; SLA, specific leaf area.
b Significance levels: NS, nonsignificant at α = 0.05; *P ≤ 0.05; ** P ≤ 0.01; ***P ≤ 0.001.
Specific leaf area
Soybean SLA (cm2 g−1) varied by sampling stage but was not affected by irrigation treatment or common ragweed density (Table 1). This indicates that soybean did not compensate for common ragweed interference by adjusting SLA (Figure 4A). Lugg and Sinclair (Reference Lugg and Sinclair1979) reported that soybean SLA increased until the R1 stage and then decreased steadily until mid-pod-fill (R5 to R6), but also varied among soybean cultivars. The SLA values calculated for soybean in this study are within the range reported in the literature (Junior and Kawakami Reference Junior and Kawakami2013; Lugg and Sinclair Reference Lugg and Sinclair1979; Patterson and Flint Reference Patterson and Flint1983; Thompson et al. Reference Thompson, Nelson and Schweitzer1995). Soybean did not compensate for interplant competition by altering its biomass partitioning or adjusting its SLA (i.e., leaf thickness), indicating that these are not ways in which soybean adjusts for interplant competition for light.

Figure 4. (A) Specific leaf area of soybean at V3 (third trifoliate), R1 (beginning bloom), R4 (full pod), and R6 (full seed) in combined monoculture and mixture with common ragweed treatments and (B) specific leaf area of common ragweed in monoculture (2 plants m−1 row) and in mixture (2, 6, and 12 plants m−1 row) with soybean throughout the growing season in a field experiment conducted in 2015 and 2016 at the University of Nebraska-Lincoln’s Eastern Nebraska Research and Extension Center (ENREC).
Common ragweed was affected by an interaction between common ragweed density and sampling stage (Table 2). However, contrast analysis allowed us to determine that common ragweed SLA was affected by soybean presence or absence across sampling stages, but not by common ragweed density in mixture with soybean (Figure 4B). Common ragweed had lower SLA than soybean at all sampling stages, indicating that its leaves are thicker than that of soybean. In monoculture, common ragweed showed a similar trend in SLA to that of soybean throughout the growing season. Common ragweed growing in mixture with soybean had greater SLA than that in monoculture during vegetative growth, but then became smaller later in the season. Therefore, common ragweed leaves in mixture with soybean were thinner early in the season but thicker late in the season. Patracchini et al. (Reference Patracchini, Vidotto and Ferrero2011) observed similar values of common ragweed SLA and found no differences in SLA between monoculture densities ranging from 4 to 24 plants m−2 throughout the growing season. When common ragweed was grown in mixture with soybean, it reduced biomass partitioning to leaves in favor of stem growth but also compensated by increasing SLA (i.e., thinner leaves) to maintain leaf area, but only through the R1 sampling stage.
Leaf area ratio
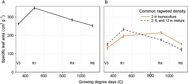
Soybean LAR was affected by sampling stage but not by mixture or irrigation treatments (Table 1). Throughout vegetative stages, soybean maintained a high LAR followed by a steady decline during reproductive stages (Figure 5A), much like the trend in biomass partitioning to leaves (Figure 3A) and SLA (Figure 4A).
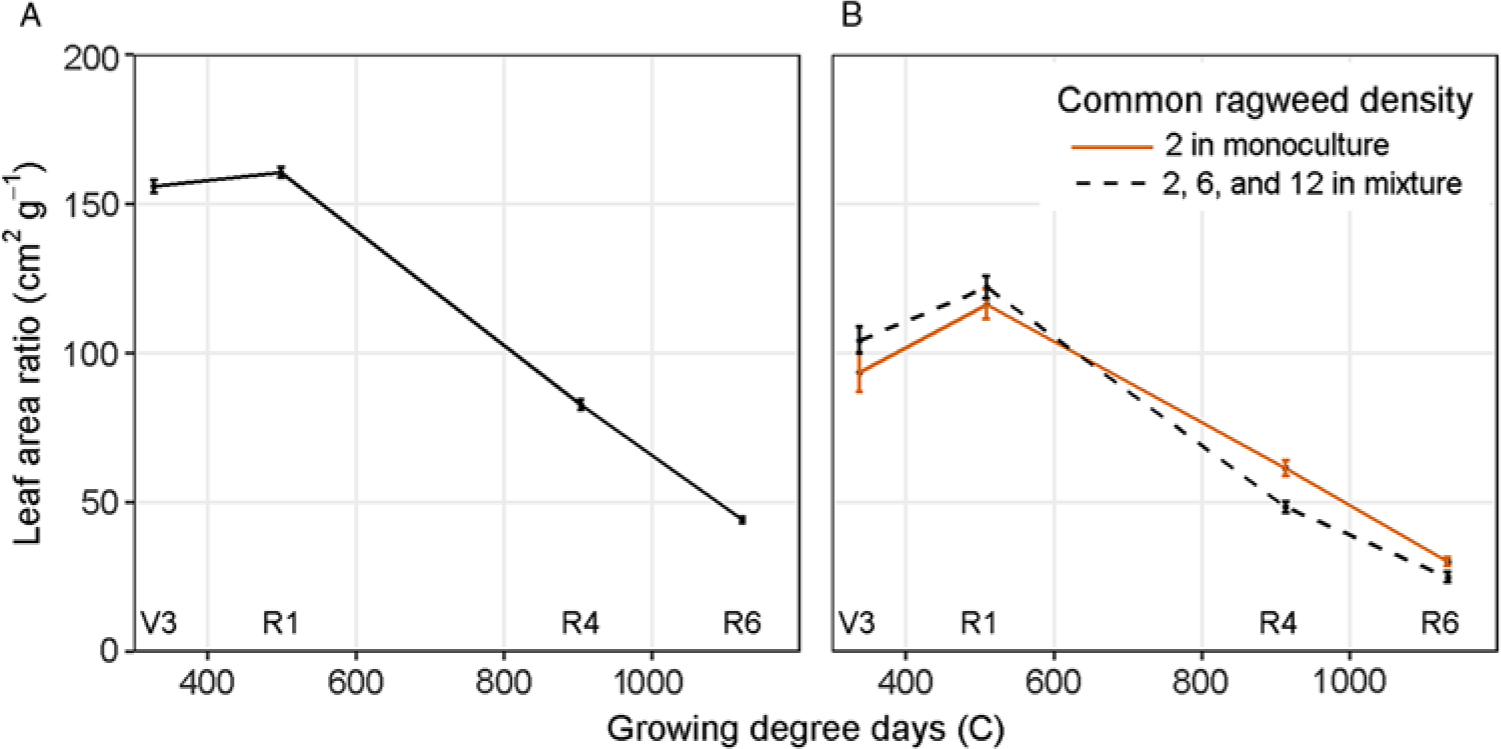
Figure 5. (A) Leaf area ratio of soybean at V3 (third trifoliate), R1 (beginning bloom), R4 (full pod), and R6 (full seed) in combined monoculture and mixture with common ragweed treatments. (B) Leaf area ratio of common ragweed in monoculture (2 plants m−1 row) and in mixture (2, 6, and 12 plants m−1 row) with soybean throughout the growing season in a field experiment conducted in 2015 and 2016 at the University of Nebraska-Lincoln’s Eastern Nebraska Research and Extension Center (ENREC).
Common ragweed LAR was affected by an interaction between density treatment and sampling stage (Table 2). However, contrast analysis allowed us to determine that common ragweed LAR was affected by soybean presence or absence across sampling stages, but not by common ragweed density in mixture with soybean (Figure 5B). Much like common ragweed’s response observed with SLA (Figure 4B), common ragweed in monoculture maintained a lower LAR early in the season and a greater LAR later in the season than common ragweed in mixture (Figure 5B). As previously discussed, common ragweed in monoculture partitioned more to leaf biomass early in the season and less late in the season than common ragweed in mixture (Figure 3B). However, the biomass partitioned to monoculture leaves early in the season was utilized to produce thicker leaves with lower SLA and, conversely, later in the season compared to common ragweed in mixture with soybean.
Leaf area index
A significant interaction between common ragweed density and sampling stage occurred for soybean LAI (Table 1). Soybean LAI was always greatest in the weed-free control and declined with increasing common ragweed density (Figure 6A). Soybean leaf senescence affected LAI after the R4 stage, similar to results reported in the literature (Setiyono et al. Reference Setiyono, Weiss, Specht, Cassman and Dobermann2008). Rate of soybean leaf senescence was not influenced by common ragweed density (Figure 6A). Hagood et al. (Reference Hagood, Bauman, Williams and Schreiber1980) reported that 10 and 20 velvetleaf plants m−2 reduced soybean LAI by 38% and 47%, respectively, during mid-reproductive stages, whereas in our study common ragweed interference reduced soybean LAI by as much as 80% and 40% at R4 in 2015 and 2016, respectively. The decline in soybean LAI with increasing common ragweed density must be associated with a reduction in soybean growth, as soybean did not change its biomass partitioning or SLA to compensate for lower light availability as ragweed density increased.
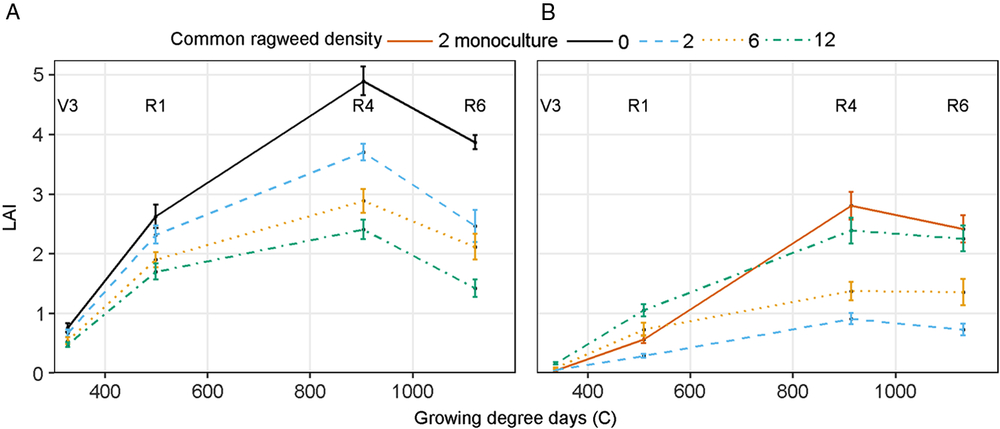
Figure 6. (A) Soybean leaf area index (LAI) at V3 (third trifoliate), R1 (beginning bloom), R4 (full pod), and R6 (full seed). (B) Common ragweed LAI as affected by common ragweed densities of 0, 2, 6, and 12 plants m−1 row throughout the growing season in a field experiment conducted in 2015 and 2016 at the University of Nebraska-Lincoln’s Eastern Nebraska Research and Extension Center (ENREC).
An interaction between sampling stage and common ragweed density affected common ragweed LAI (Table 2). Common ragweed LAI increased nearly linearly until the soybean R4 stage then declined as a result of leaf senescence (Figure 6B). Common ragweed LAI in mixture with soybean increased with increasing common ragweed density at all sampling times (Figure 6B). In the absence of soybean interference, common ragweed LAI was similar to its equivalent density in mixture (2 plants m−1 row) at the V3 sampling time but was subsequently much greater, ultimately reaching a similar LAI to that in the 12 plants m−1 row mixture treatment (Figure 6B). This suggests that the presence of soybean limited common ragweed leaf area growth, especially at lower densities. The greatest common ragweed LAI was achieved at the R4 soybean sampling stage in the monoculture of 2 plants m−1 row—a result that can be partially attributed to the increase in biomass partitioning to leaves, the increased SLA, and the greater LAR observed in the monoculture at that sampling stage compared to the mixture treatments (Figure 3B).
Aboveground biomass
An interaction between common ragweed density and sampling stage occurred for soybean total aboveground biomass (Table 1). Soybean aboveground biomass increased as the season progressed and declined with increasing common ragweed density (Figure 7A). These differences were seen as early as the V3 stage of development, with the highest common ragweed density (12 plants m−1 row) producing 24% less biomass than the weed-free treatment, indicating that common ragweed interference may reduce soybean growth very early in the season (Figure 7A). These differences became greater as the season progressed, with as much as 66% reduction in aboveground biomass in the 12 plants m−1 row treatment compared to the weed-free control at R4. Gustafson et al. (Reference Gustafson, Knezevic, Hunt and Lindquist2006) reported season-long interference from a mixture of weed species resulted in 26% to 86% reduction compared to weed-free. Velvetleaf interference reduced soybean biomass beginning early in the season and extending throughout the entire season, suggesting that even early-season weed interference can reduce soybean biomass (Hagood et al. Reference Hagood, Bauman, Williams and Schreiber1980). These differences can be partially attributed to the lack of plasticity in soybean biomass partitioning, SLA, and LAR observed in this study.
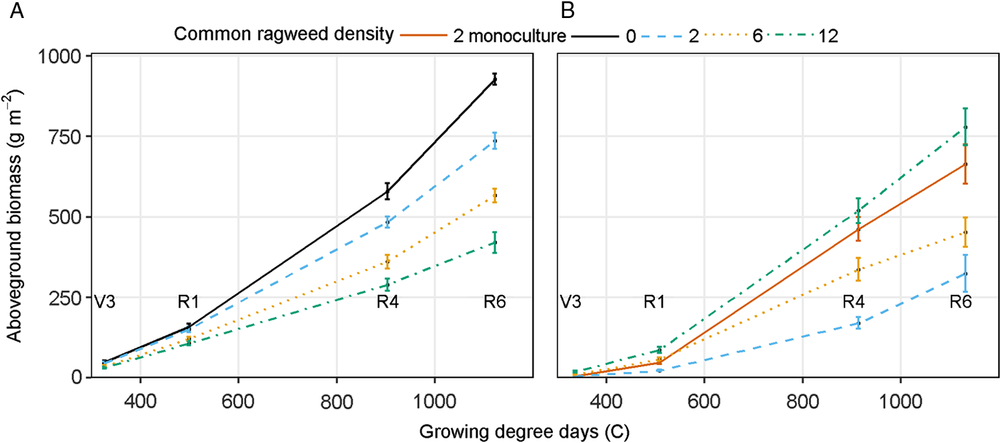
Figure 7. (A) Soybean aboveground biomass at V3 (third trifoliate), R1 (beginning bloom), R4 (full pod), and R6 (full seed). (B) Common ragweed aboveground biomass as affected by common ragweed densities of 0, 2, 6, and 12 plants m−1 row throughout the growing season in a field experiment conducted in 2015 and 2016 at the University of Nebraska-Lincoln’s Eastern Nebraska Research and Extension Center (ENREC).
Common ragweed aboveground biomass was affected by an interaction between sampling stage and common ragweed density (Table 2). Common ragweed in monoculture (2 plants m−1 row) produced up to 271% greater biomass than the 2 plants m−1 row in mixture with soybean, indicating that soybean greatly reduced common ragweed aboveground biomass (Figure 7B). With soybean interference, common ragweed biomass was smallest with the 2 plants m−1 row and increased with common ragweed density, regardless of when it was sampled. Differences were small at V3 sampling stage but became progressively greater as the season progressed. The biomass produced by the highest common ragweed density at R6 was 383% larger than that of the lowest density. Patracchini et al. (Reference Patracchini, Vidotto and Ferrero2011) reported that higher common ragweed density resulted in greater aboveground biomass per unit area but less biomass per plant. Leskovšek et al. (Reference Leskovšek, Eier, Batič and Simončič2012b) reported greater biomass per plant in 1.3 plants m−2 density compared with 6.6 plants m−2 density. Common ragweed aboveground biomass followed a similar trend to its LAI accumulation throughout the season prior to leaf senescence within the mixture treatments. Monoculture-grown common ragweed had the greatest LAI compared to all mixture treatments late in the season, but aboveground biomass was not greatest in this treatment. Common ragweed plasticity in biomass partitioning, SLA, and LAR later in the growing season allowed for greater SLA and the greatest biomass partitioning to leaves in monoculture, resulting in greater LAR and LAI compared to all other mixture densities, even when aboveground biomass of the monoculture was not the greatest. This ability to adjust biomass partitioning, SLA, and LAR is a clear competitive advantage for common ragweed.
Stem height
Soybean height measured at R5 was not affected (Table 1). Soybean stem height averaged 96.5 cm across all treatments. The lack of difference in late-season soybean stem height is a result of no difference in soybean biomass partitioning to stems observed throughout the growing season (Figure 3A). This indicates that soybean was unable to adjust to the presence of common ragweed by increasing its stem height.
Common ragweed stem height measured at the soybean R5 stage was not affected by irrigation treatment but was affected by common ragweed density (Table 2). Ragweed densities of 2 plants m−1 row in monoculture and 2, 6, and 12 plants m−1 row in mixture resulted in ragweed heights of 121.0 (± 2.9), 127.1 (± 2.5), 134.2 (± 1.8), and 132.5 (± 1.7) cm, respectively. This indicates that common ragweed increased its height with greater ragweed densities, with 6 and 12 plants m−1 row resulting in taller plants than 2 plants m−1 row. Additionally, 2 plants m−1 row in monoculture resulted in shorter plants than 2 plants m−1 row in mixture. This supports the increase in biomass partitioning to stems observed in common ragweed in mixture compared to monoculture and with increasing common ragweed density in mixture (Figure 3B). The increase in common ragweed biomass partitioning to stems under increasing competition (Figure 3B) indicates that ragweed is able to increase in height to avoid soybean interference. This plastic response to changing density allows ragweed to be more competitive for light.
Seed size and number
Soybean 100-seed weight was not affected by irrigation treatment but was affected by common ragweed density (Table 1). Common ragweed densities of 0, 2, 6, and 12 plants m−1 row resulted in soybean 100-seed weights of 14.6 (± 0.09), 12.2 (± 0.19), 10.5 (± 0.28), and 9.3 (± 0.29) g 100 seed−1, respectively. Each treatment of increasing ragweed density resulted in decreased seed weight, with 12 plants m−1 resulting in a 36% reduction in seed weight. Eaton et al. (Reference Eaton, Feltner and Russ1973) reported that soybean 100-seed weight was reduced 11% with 90 d of Venice mallow (Hibiscus trionum L.) competition compared to weed-free soybean. Wyse et al. (Reference Wyse, Young and Jones1986) reported a 12% reduction in 100-seed weight by 4 Jerusalem artichoke (Helianthus tuberosus L.) m−1 row.
Common ragweed 100-seed weight was not affected, with mean 100-seed weight of 0.31 g (Table 2). Palmblad (Reference Palmblad1968) reported constant seed weight produced from densities ranging from 55 to 11,000 plants m−2 for smooth brome (Bromus inermis Leyss.), shepherd’s purse (Capsella bursa-pastoris L.), horseweed (Conyza canadensis L. Cronq.), buckhorn plantain (Plantago lanceolata L.), broadleaf plantain (Plantago major L.), woodland groundsel (Senecio sylvaticus L.), sticky groundsel (Senecio viscosus L.), and common catchfly (Silene gallica L.). Downy brome (Bromus tectorum L.) seed size declined with increased density (Palmblad Reference Palmblad1968). Increasing common ragweed density reduced the number of common ragweed seeds per plant (Table 2). Irrigation treatment did not affect seeds per plant. The 2 plants m−1 row density in monoculture and mixture had the greatest seed production of 6,010 seeds plant−1. In mixture with soybean, 6 and 12 plants m−1 row resulted in 3,180 and 2,590 seeds plant−1. Leskovšek et al. (Reference Leskovšek, Eier, Batič and Simončič2012b) reported decreasing common ragweed seed number per plant with increasing intraspecific competition.
Results indicate that soybean’s adjustment in biomass partitioning, SLA, and LAR is not the method that soybean uses to remain plastic under interspecific competition for light. Although there was no competition for soil water throughout the experiment, no belowground biomass was measured. These results suggest that one of the benefits of common ragweed’s plasticity is its resilience to competition, which resulted in stable seed size, unlike soybean, which reacted to increasing competition with reduced seed size.
Author ORCIDs
Ethann R. Barnes https://orcid.org/0000-0002-6697-3839; Amit J. Jhala https://orcid.org/0000-0001-8599-4996
Acknowledgments
No conflicts of interest have been declared. This research received no specific grant from any funding agency, commercial, or not-for-profit sectors. The authors acknowledge Jacob Nikodym and Ian Rogers for their help in this project.