


Introduction
Silvopastoral systems (SPSs) are characterized by the integration of pasture, trees and grazing animals in the same area. Their use has increased over recent years as they are considered sustainable alternatives for pasture intensification (Gomes et al., Reference Gomes, Pedreira, Bosi, Cavalli, Holschuch, Mourão, Pereira and Pedreira2019; Bosi et al., Reference Bosi, Pezzopane and Sentelhas2020a). In those systems, livestock and wood production are associated with enhanced land use efficiency and provision of ecosystem services as species diversification and carbon (C) fixation (Alves et al., Reference Alves, Almeida and Laura2015; Dias et al., Reference Dias, Costa, Severiano, Bilego, Furtini Neto, Almeida, Brand and Vilela2020; Pezzopane et al., Reference Pezzopane, Bonani, Bosi, da Rocha, Bernardi, Oliveria and Pedroso2020a). Nevertheless, in SPSs, complex interactions occur among the components of the system, i.e. pasture, trees and animals. Thus, positive outcomes are dependent upon the ability to ensure synergistic interactions among such components (Kichel et al., Reference Kichel, Sousa, Almeida and Costa2018; Santos et al., Reference Santos, Júnior, Vilela, Maciel and França2018; Pezzopane et al., Reference Pezzopane, Bernardi, Bosi, Oliveira, Marconato, Pedroso and Esteves2019a).
When managed properly, SPSs may have higher soil fertility as compared to intensively managed full sun systems (INT) due to the diversification of soil organic matter (SOM) and soil microbiota through root sloughing of diverse species and litterfall (Nair et al., Reference Nair, Buresh, Mugendi, Latt, Buck, Lassoie and Fernandes1999; Wedderburn and Carter, Reference Wedderburn and Carter1999). The diversification of the SOM and its carbon/nitrogen ratio (Dias et al., Reference Dias, Costa, Severiano, Bilego, Furtini Neto, Almeida, Brand and Vilela2020) results in varied N mineralization rate, benefiting the long-term supplementation of N for the understory species (Paciullo et al., Reference Paciullo, Castro, Gomide, Maurício, Pires, Muller and Xavier2011a). This factor, along with the physiological changes caused by the shading environment, generally results in forage species with a higher crude protein (CP) content and in vitro dry matter digestibility (IVDMD) as compared to those managed under full sun (Santos et al., Reference Santos, Júnior, Vilela, Maciel and França2018; Lima et al., Reference Lima, Paciullo, Silva, Morenz, Gomide, Rodrigues and Chizzotti2019; Dias et al., Reference Dias, Costa, Severiano, Bilego, Furtini Neto, Almeida, Brand and Vilela2020). Moreover, the presence of trees reduces surface runoff and allows for exploring deeper soil layers for water uptake that, in conditions with proper water availability, increases the total water use by the system (Do Nascimento et al., Reference Do Nascimento, Pedreira, Sollenberger, Pereira, Magalhães and Chizzotti2019; Bosi et al., Reference Bosi, Pezzopane and Sentelhas2020b; Glatzle et al., Reference Glatzle, Stuerz, Giese, Pereira, Almeida, Bungenstab, Macedo and Asch2021). Finally, shading reduces radiation and thermal stress in the animals (Pezzopane et al., Reference Pezzopane, Nicodemo, Bosi, Garcia and Lulu2019b), which may result in greater animal performance (Paciullo et al., Reference Paciullo, Castro, Gomide, Maurício, Pires, Muller and Xavier2011a).
Despite the benefits brought about by the forest component, the presence of trees induces microclimate modifications, mainly related to radiation quantity and quality to the understory species (Bosi et al., Reference Bosi, Pezzopane and Sentelhas2020a). Such factors are determinants for forage growth and, even though some forage species display shade tolerance mechanisms (Santos et al., Reference Santos, Júnior, Vilela, Pulrolnik, Bufon and França2016; Geremia et al., Reference Geremia, Crestani, Mascheroni, Carnevalli, Mourão and Silva2018; Pang et al., Reference Pang, Van Sambeek, Navarrete-Tindall, Lin, Jose and Garret2019; Pezzopane et al., Reference Pezzopane, Bernardi, Bosi, Oliveira, Marconato, Pedroso and Esteves2019a), shading may significantly reduce their growth, due to the lesser amount of energy, i.e. photosynthetically active radiation (PAR), available for photosynthesis and lower tillering as compared to full sun pastures (Geremia et al., Reference Geremia, Crestani, Mascheroni, Carnevalli, Mourão and Silva2018; Pezzopane et al., Reference Pezzopane, Bernardi, Bosi, Oliveira, Marconato, Pedroso and Esteves2019a). The lower forage mass allied with sward structure modifications caused by shading may impact negatively the animal ingestive behaviour (Geremia et al., Reference Geremia, Crestani, Mascheroni, Carnevalli, Mourão and Silva2018), reducing forage intake and, consequently, animal performance and productivity. In addition to modifications in the radiation regime, in conditions of low water availability, inter-specific competition for water between the trees and the understory species results in drought stress and reduced growth of the latter (Tian et al., Reference Tian, Cacho, Youssef, Chescheir, Fischer, Nettles and King2017). Analogously, in soils with low fertility, the inter-specific competition for nutrients may reduce forage growth (Jose et al., Reference Jose, Gillespie and Pallardy2004).
The success or failure of the SPSs rely on the reasonable growth of the understory species, which, in turn, rely basically on the optimization of the tree density and its effect on the microclimate imposed on the shaded plants (Santos et al., Reference Santos, Júnior, Vilela, Maciel and França2018). The effects of the trees on the microclimate depends upon the location, size of the trees and layout of the production system. Nevertheless, in general, greater inter-row spacing between tree lines and intra-row spacing between trees allow for higher PAR transmission and lower inter-specific competition for resources. In this context, for a balanced production among the systems components, management practices as thinning and pruning may be beneficial to the production system (Santos et al., Reference Santos, Júnior, Vilela, Maciel and França2018; Pezzopane et al., Reference Pezzopane, Bernardi, Bosi, Oliveira, Marconato, Pedroso and Esteves2019a, Reference Pezzopane, Bonani, Bosi, da Rocha, Bernardi, Oliveria and Pedroso2020a; Gomes et al., Reference Gomes, Pedreira, Santos, Bosi, Lulu and Pedreira2020).
The hypothesis of the current study is that the thinning of the trees in a SPS provides conditions for the shaded pasture to have similar productivity and superior nutritive traits as those of an intensively managed full sun pasture (INT). Thus, the goal of this study was to compare the productive and nutritive traits of the Piatã palisadegrass (Urochloa (syn. Brachiaria) brizantha (Hochst ex A. Rich.) Stapf cv. BRS Piatã) cultivated in an SPS after thinning of eucalyptus trees (Eucalyptus urograndis clone GG100) with an INT of Piatã palisadegrass.
Materials and methods
Experimental area and design
The study was carried out in a SPS and in an intensively managed full sun system at Embrapa Pecuária Sudeste, São Carlos, SP, Brazil (21°57′S, 47°50′W, 860 m asl.) from October of 2016 to March of 2018. Climate is classified as tropical (Köppen: Cwa), with two well-defined seasons: dry (April to September), with 19.9°C and 250 mm of average temperature and total precipitation, respectively; and rainy (October to March), with 23.0°C and 1100 mm of average temperature and total precipitation, respectively. Local relief is plain to mildly hilly. The soil is classified as a Typic Haplustox with sandy-loam texture (Soil Survey Staff, 2014).
Productive and nutritive traits of Piatã palisadegrass (Urochloa (syn. Brachiaria) brizantha (Hochst ex A. Rich.) Stapf cv. BRS Piatã) were evaluated under two productive systems: (1) full sun intensive system (INT), managed under rainfed conditions with lime application to increase base saturation to 60% and fertilization during the rainy season and grazed under rotational stocking; (2) SPS, managed under rainfed conditions with soil and grazing management similar to those of the INT, and shaded by eucalyptus trees (Eucalyptus urograndis clone GG100). A total of 1998 trees (333 trees/ha) were planted in eighteen single rows in April of 2011, with nearly East-West orientation, spaced 15 × 2 m but thinned previous to the onset of the experiment, in July, to 15 × 4 m (Fig. 1). The thinning was performed by alternately cutting 50% of the trees on each row. In October of 2017, the trees were, in average, 27.8-m height and presented an average of 25.9 cm of diameter at breast height (1.3 m; DBH).

Fig. 1. Colour online. Intensive system (INT) (III and IV) and silvopastoral system (SPS) (I and II) areas. Solid and dashed lines delimit the areas and paddocks, respectively (a); Schematic representation of the SPS after the thinning of the trees indicating where data were collected (SPS_1, SPS_2; SPS_3 and SPS_4) (b); meteorological field station at the SPS (c); detail of the INT (d) and SPS (e) systems.
Each system was six ha, split into two areas of three ha which were further subdivided into six 0.5-ha paddocks (Fig. 1) managed as rotational stocking systems following a schedule of 7 days of stocking period and 35 days of rest period. At the beginning of the study soil presented the following chemical properties according to Primavesi et al. (Reference Primavesi, Andrade, Alves, Rosso, Batista, Prates, Ortiz, Mello, Ferraz, Linhares, Machado, Moeller, Alves, Silva, Nogueira and Souza2005) respectively for INT and SPS systems: pHH2O = 5.9 and 5.4, organic matter = 43.1 and 37.7 g/dm3, P-resin = 9.8 and 5.6 mg/dm3, K = 2.0 and 1.4 mmolc/dm3, Ca = 22.7 and 19.9 mmolc/dm3, Mg = 10.8 and 9.8 mmolc/dm3, Cation Exchange Capacity (CEC) = 61.0 and 57.7 mmolc/dm3; basis saturation (V) = 77.9 and 54.1% and the physical characteristics: sand = 591 and 549 g/kg, silt = 70 and 54 g/kg and clay = 339 and 397 g/kg. Based on soil testing, each year, lime was applied to increase base saturation to 60%, P fertilizer (super single phosphate, 18% P2O5) was applied to increase soil P to 12 mg/dm3, and K fertilizer (KCl, 60% K2O) to increase exchangeable K to 3% soil CEC. Nitrogen fertilization of the pastures was top-dressed during the rainy season with 132 kg of N applied as urea (45% N), split into three applications. Grazing was performed by Canchim (3/8 Nelore + 5/8 Charolais) beef steers by adjusted stocking density (‘put and take’ technique – Mott and Lucas, Reference Mott and Lucas1952) as a function of the visual assessment of the pre-grazing forage mass.
Forage production and nutritive value evaluation
Throughout the experimental period, forage production and nutritive value were evaluated in five grazing cycles representatives of the seasons of the year from December of 2016 to March of 2018: summer, autumn, winter and spring of 2017 and summer of 2018. Measurements were performed in three paddocks of each experimental area and, as there were two experimental areas per treatment, a total of six repetitions per production system were used. In the SPS, the measurements were made in four positions between the tree rows: under the tree row (SPS_1), 3.75-m (SPS_2), 7.5-m (SPS_3) and 11.25-m (SPS_4) distant from the North row (Fig. 1).
Pre- and post-grazing forage mass were determined by cutting the forage inside a metallic 0.5 × 0.5-m square frame. Four samples were taken in each position of the SPS (totalling 16 per paddock) and four samples were taken in each paddock of the INT. The samples were weighed and homogenized by position, in the case of the SPS or by paddock, in the case of the INT. Subsequently, two subsamples were taken from each position (SPS) or paddock (INT). One subsample was dried in a forced-air drying oven (65°C–72 h) for dry matter (DM) content determination and the other hand-separated into leaf, stem and dead material for plant-part determination. Whenever a leaf had more than 50% of its area senesced, it was considered as dead material. Leaf fraction was scanned on a model LI- 3100 (Li-Cor, Lincoln, Nebraska, EUA) for leaf area determination. Subsequently, the leaf, stem and dead material fractions were dried in a forced-air drying oven (65°C–72 h).
The pre-grazing live forage mass was calculated considering only the leaf and stem fractions (kg DM/ha1) and forage accumulation (kg DM/ha1) was calculated by subtracting the post-grazing forage mass (grazing cycle n − 1) from the pre-grazing forage mass (grazing cycle n), and correcting for disappeared dead material, as proposed by Bosi et al. (Reference Bosi, Pezzopane, Sentelhas, Santos and Nicodemo2014). Additionally, the leaf area index (LAI) and specific leaf area (SLA; cm2/g) were calculated.
For CP content and IVDMD determination, the dried pre-grazing forage samples previously used for DM content determination were used. The samples were analysed by the Fourier transform-near infrared (NIR) technique, using a spectrometer model NIRFlex N-500 with polarization interferometer (Büchi, Flawil, Switzerland). The measurements were performed using a proprietary calibration model developed and validated by Embrapa Pecuária Sudeste (R 2 = 0.944 for CP and R 2 = 0.923 for IVDMD) specifically for Urochloa spp.
Microclimate parameters evaluation
The volumetric soil moisture was characterized (cm3 of water/cm3 of soil) at depths of 0.0–0.3, 0.3–0.6, 0.6–1.0 m with a capacitive probe (Diviner®) and averaged for determination of soil moisture from 0.0–1.0 m depth. In the SPS, PAR was measured continuously at a height of 70 cm above soil level using linear quantum sensors SQ-301 (Apogee, Logan, Utah, EUA) at the four positions determined for forage evaluations (SPS1 to SPS4). In the INT, measurements were taken at the same height as in the SPS using a quantum sensor PQS1 (Kipp & Zonen, Delft, The Netherlands). Both sensors were connected to a datalogger (Campbell Scientific CR1000), programmed to take irradiance measurements (μmol/m2 s) each 10 s and integrate the values daily (MJ/m2 day). In the SPS, PAR transmission was calculated according to Eqn (1).

where TSPS_i is the percentage of PAR transmission in the position i (1, 2, 3, 4) of the SPS; PARUSPS_i is the PAR underneath the tree canopy in the position i; and PARINT is the PAR in the INT.
Statistical analysis
Data were subjected to the Shapiro-Wilk's test (P > 0.05) for normality of the residuals and outliers were removed when necessary. The pre-grazing live forage mass, forage accumulation, LAI, SLA, CP content and IVDMD were analysed using a randomized block design with six repetitions. Data were subjected to analysis of variance using the General Linear Model procedure of SAS (2016) considering treatments and blocks as fixed effects and repetitions as random effects. Means of the SPS positions (SPS1 to SPS4) were compared to each other by the Tukey's test (P < 0.05). Furthermore, each SPS position was individually compared to the INT, considered as reference, by the two-sided Dunnett's test (P < 0.05). The analysis was performed using the Statistical Analysis System – SAS v. 9.4 (SAS Inc., Cary, EUA).
Results
The incidence of PAR in the INT (Fig. 2(a)), which is similar to the incidence of PAR above the tree canopy in the SPS, varied among the seasons of the year. The summers of 2017 and 2018 and the spring of 2017 presented the greatest values of approximately 9 MJ/m2 day, while the winter of 2017 had intermediary values of around 8 MJ/m2 day, and finally, the autumn of 2017 presented the lowest values, which were around 6 MJ/m2 day.
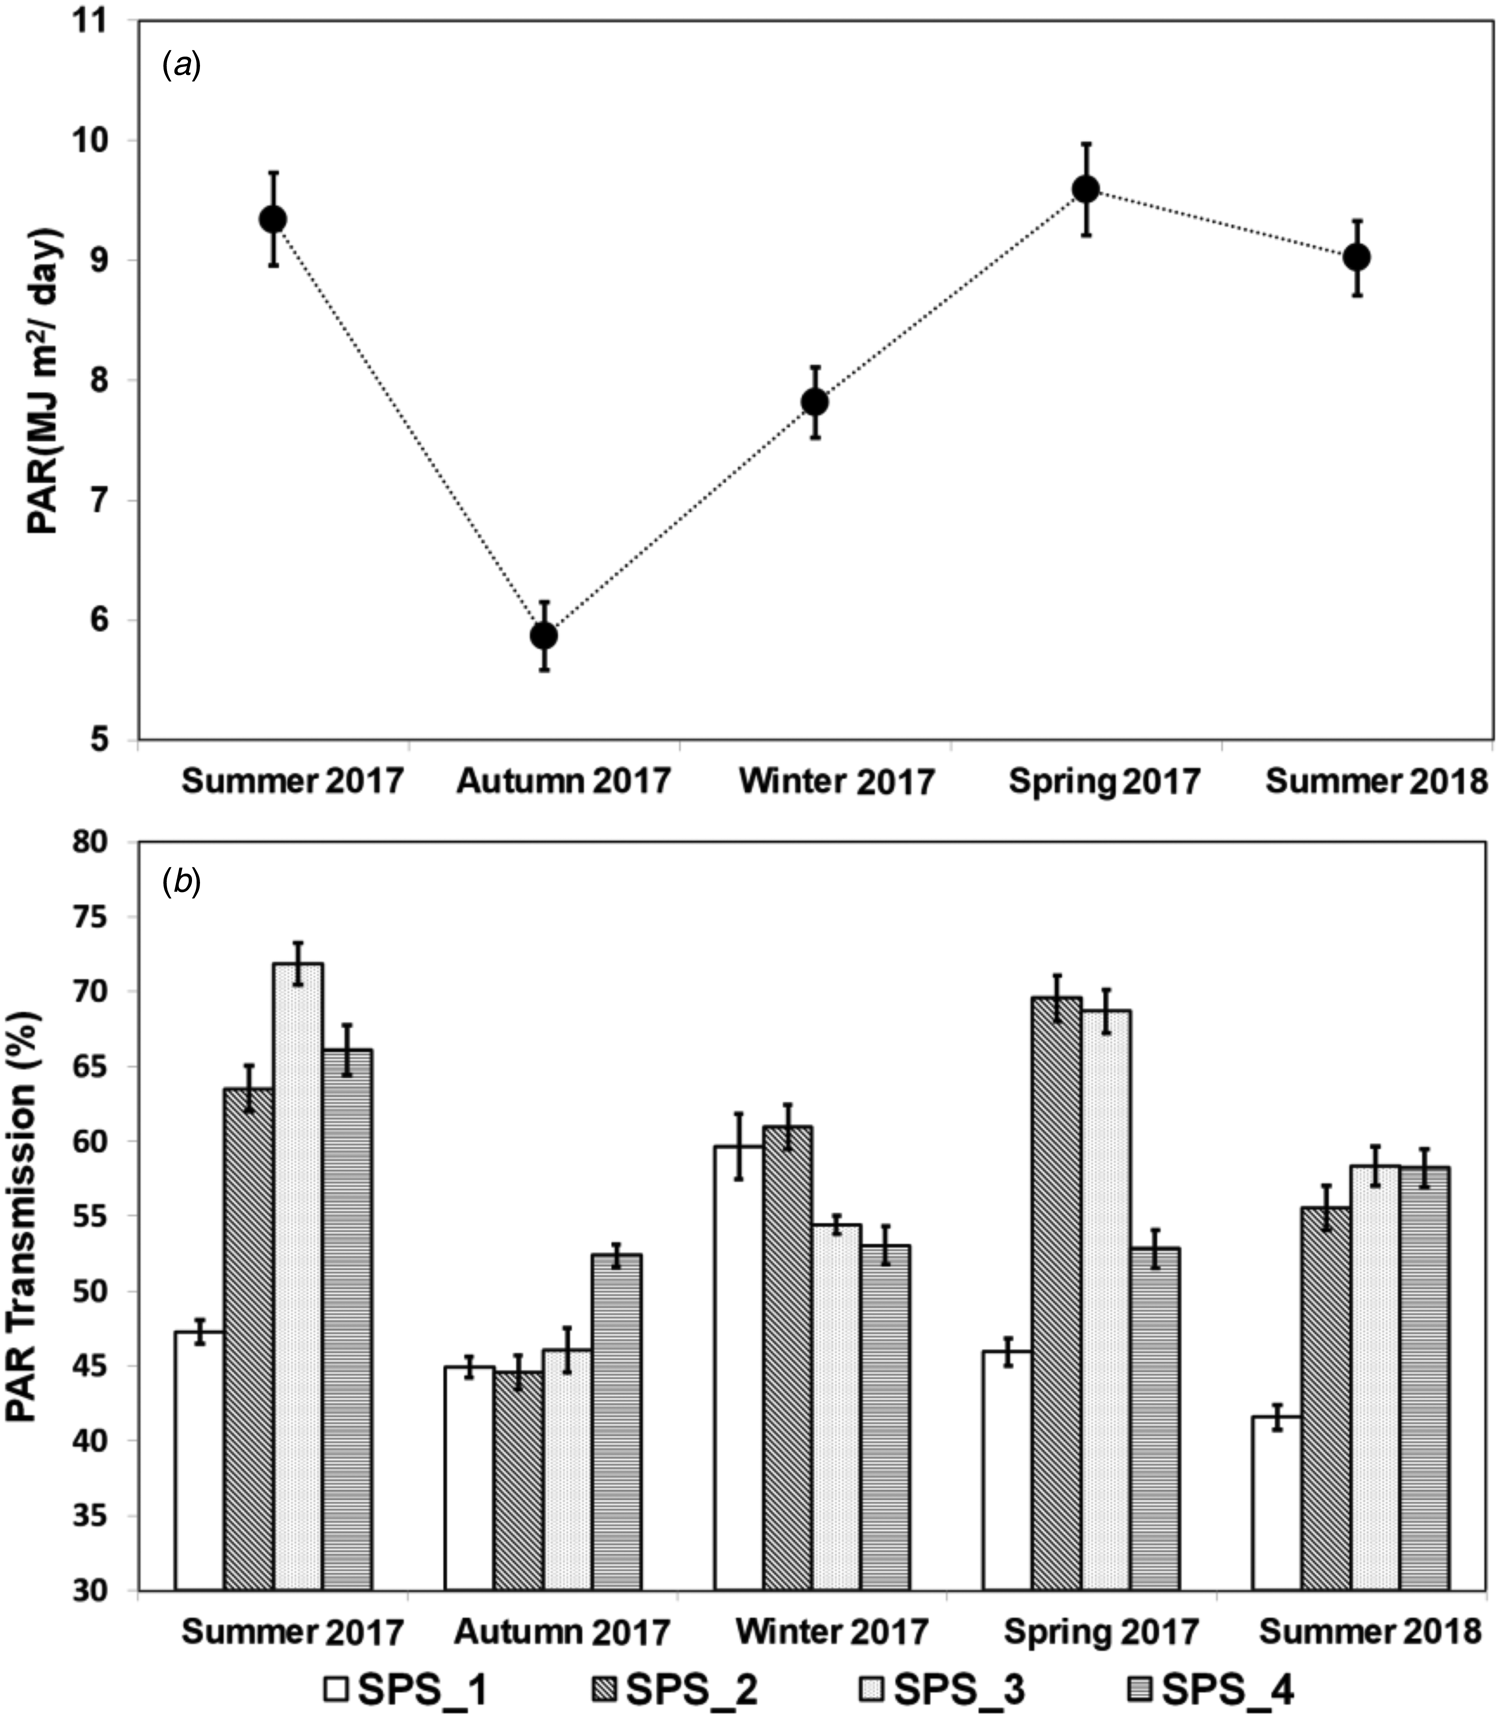
Fig. 2. Photosynthetically active radiation (PAR) incidence in the intensive system (a) and PAR transmission (b) in a silvopastoral system (SPS) at four positions within the system (SPS_1: under trees, SPS_2: 3.75 m, SPS_3: 7.50 m and SPS_4: 11.25 m from the north row of trees) during the five pasture growth cycles (Summer 2017, Autumn 2017, Winter 2017, Spring 2017 and Summer 2018). Vertical bars represent the standard error of the means.
The PAR transmission through the tree canopy in the SPS varied among the positions and among the seasons of the year (Fig. 2(b)). The differences of PAR transmission were substantial when comparing the seasons of the year for each position studied. In the SPS1 position, the winter of 2017 presented the highest transmission value, of about 60%, whereas the values were approximately 45% transmission in the other three seasons of 2017. The lowest value 40% of PAR transmission was recorded the summer of 2018. When considering the SPS2 position, the values varied substantially ranging from the maximum value of approximately 70% in the spring of 2017 to the minimum value of 45% in the autumn of the same year. The summer and winter of 2017 presented intermediary values ranging from 60 to 65%, while the summer of 2018 presented a value of about 55%.
A substantial variation in PAR transmission was also registered in the SPS3 position. The greatest values were slightly higher than 70%, recorded in the summer of 2017, while the lowest values were of only about 45% in the autumn of the same year. In the spring of 2017, summer of 2018 and winter of 2017 the values of PAR transmission registered were of approximately 70, 60 and 55%, respectively. For the SPS4 position, the greatest PAR transmission was registered for the summer of 2017 with values around 65%, followed by the summer of 2018 with values around 60% and finally, by the autumn, spring and winter of 2017 with values ranging from 50 to 55%.
The PAR transmission also varied among the positions studied in each season. In the summer of 2017, the highest PAR transmission was registered in the SPS3 followed by the SPS4 position. Additionally, the SPS2 position had slightly lower values than SPS4, but substantially greater values when compared to SPS1. During the autumn of 2017, SPS4 presented higher values when compared to the SPS1, SPS2 and SPS3 positions, which had similar PAR transmissions. During the winter of 2017, the PAR transmissions in the SPS1 and SPS2 were similar and higher when compared to the SPS3 and SPS4 positions, which presented similar values. In the spring of 2017, the values registered in the SPS2 and SPS3 positions were similar, and greater when compared to the other positions. Additionally, for this season, the SPS4 had higher PAR transmission than SPS1. Finally, during the summer of 2018, PAR transmission was similar in the SPS3 and SPS4 positions, which presented values slightly greater than SPS2 and substantially greater when compared to SPS1.
Soil moisture in the 0.6–1.0 m layer was lower in all seasons and positions (Fig. 3) when compared to the 0.0–0.3 and 0.3–0.6 m layers. On the other hand, when comparing the 0.0–0.3 and 0.3–0.6, the results recorded were similar. In the 0.6–1.0 m layer, the soil moisture ranged from values slightly lower than 0.15 cm3/cm3 to values slightly lower than 0.20 cm3/cm3, whereas in the other layers studied, the soil moisture ranged from values slightly lower than 0.20 cm3/cm3 to values around 0.25 cm3/cm3. In all soil layers, the lowest soil moisture was registered during the winter of 2017, while the other seasons presented similar results among them. The same pattern of variation occurred when comparing the INT and the four positions of the SPS in each season. In this context, the soil moisture was similar among the INT, the SPS3, and the SPS4 positions. The soil moisture values of these positions were slightly greater when compared to the SPS2 position in the 0.0–0.3 and 0.3–0.6 m layers, and similar in the 0.6–1.0 and 0.0–1.0 m layers. On the other hand, the values of soil moisture of the INT, SPS2, SPS3 and SPS4 positions were substantially and systematically greater when compared to those of the SPS1 position.
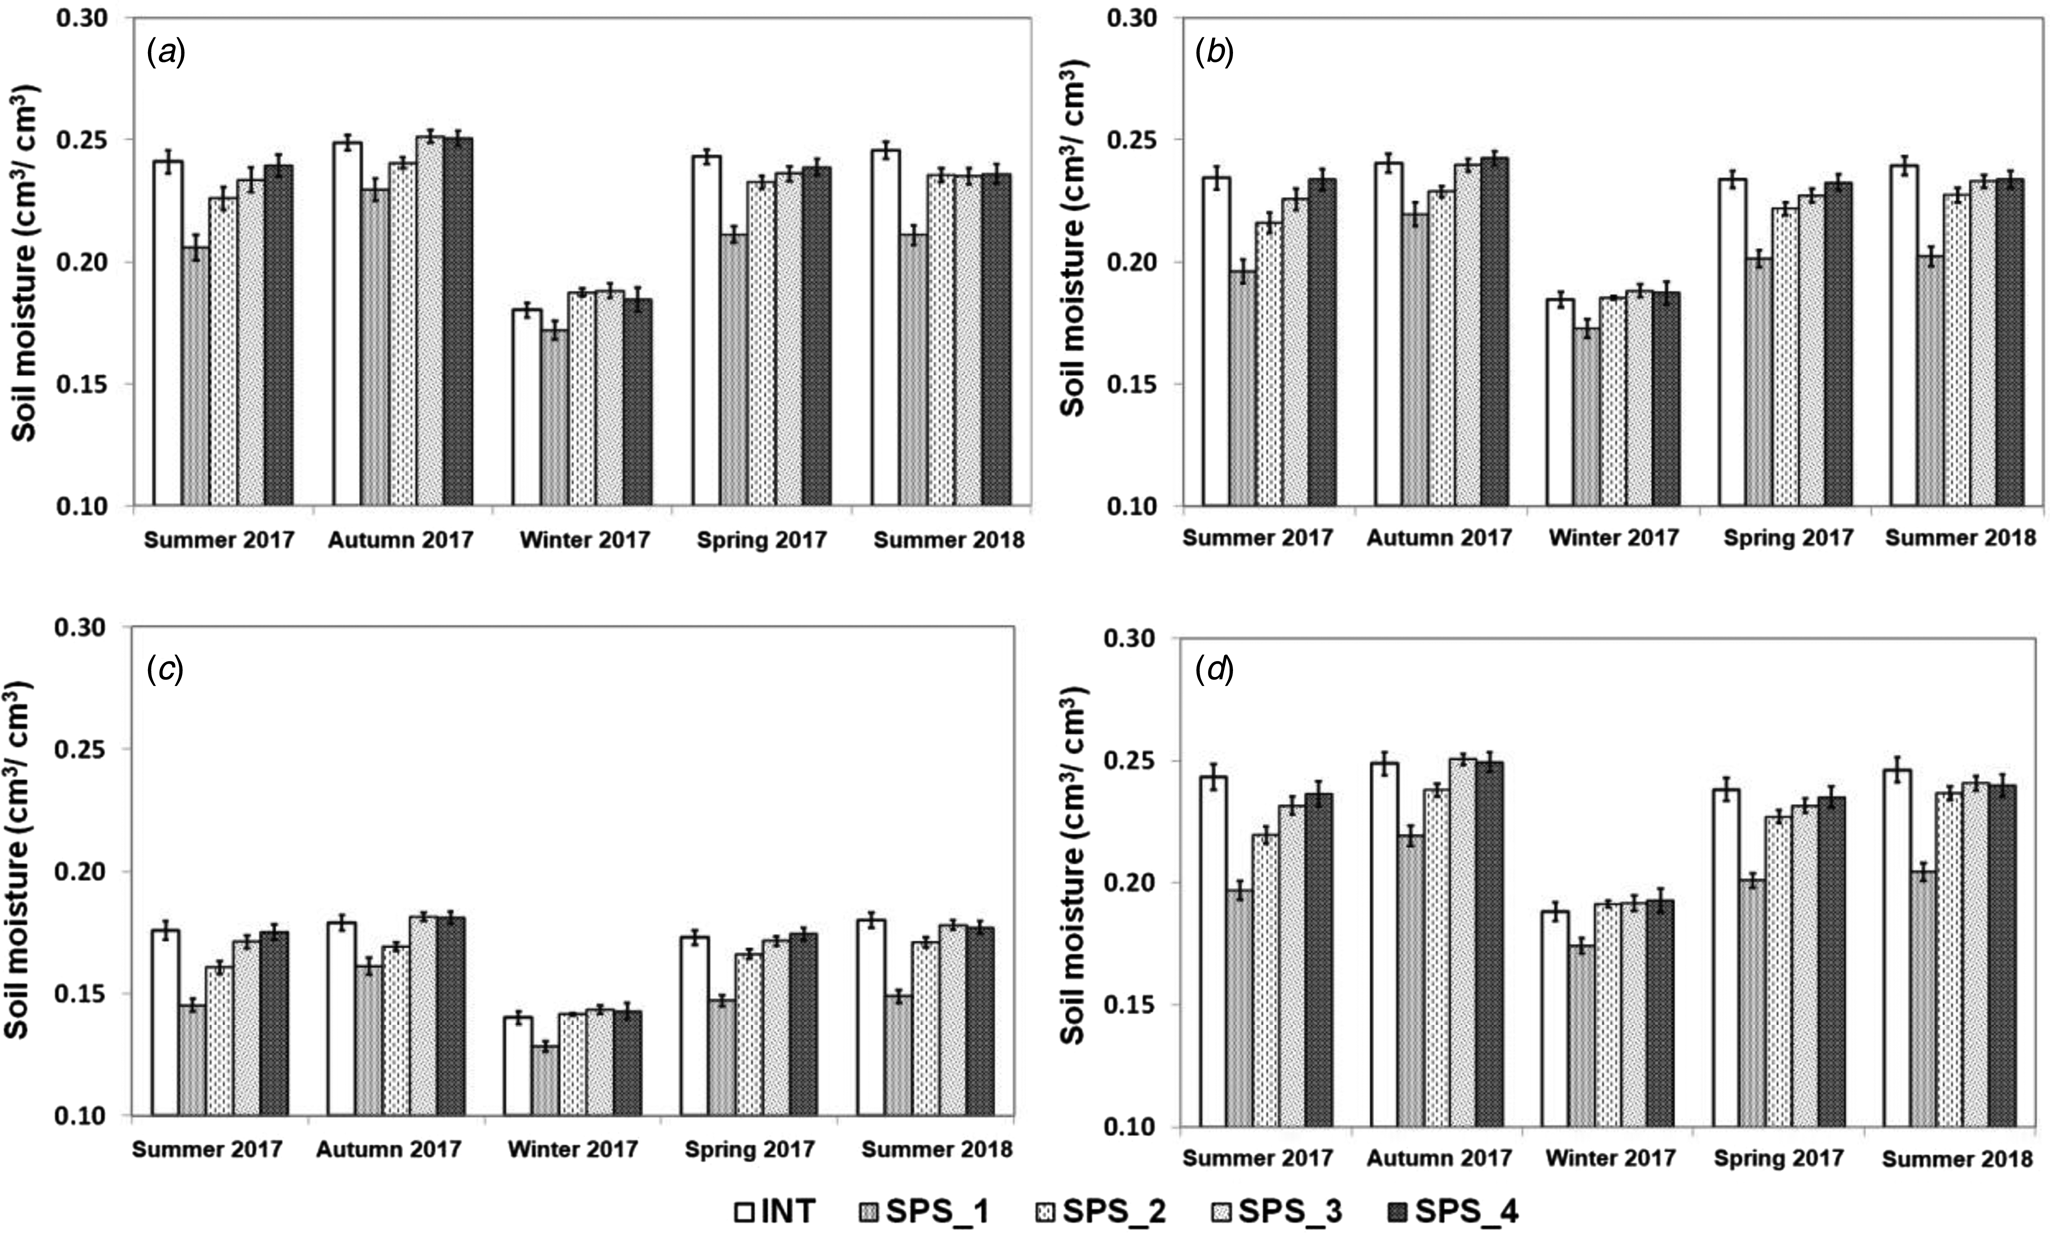
Fig. 3. Soil moisture (cm3/cm3) in the layers 0.0–0.3 m (a), 0.3–0.6 m (b), and 0.6–1.0 m (c) and 0.0–1.0 m (d) in the intensive system (INT) and in a silvopastoral system (SPS) at four positions within the system (SPS_1: under trees, SPS_2: 3.75 m, SPS_3: 7.50 m and SPS_4: 11.25 m from the north row of trees) during the five pasture growth cycles (Summer 2017, Autumn 2017, Winter 2017, Spring 2017 and Summer 2018). Vertical bars represent the standard error of the means.
When comparing the four positions in the SPS, the pre-grazing live forage mass did not differ during the summers of 2017 and 2018, and during the spring of 2017 (Table 1). Nevertheless, the pre-grazing live forage mass was greater in the SPS3 position than in the SPS1 position during the autumn of 2017 (P = 0.018) and in the SPS4 position than in the SPS1 position during the winter of 2017 (P = 0.026). Moreover, when comparing the positions of the SPS to the INT, the positions SPS1, SPS2 and SPS4 during the autumn of 2017 (P = 0.021), the position SPS1 during the winter (P = 0.039) and all the positions during the summer of 2018 (P = 0.002) presented smaller pre-grazing live forage mass, while for the other seasons there were no differences between each position and the INT.
Table 1. Productive and nutritive characteristics of palisadegrass in an intensive system (INT) and in a silvopastoral system (SPS) at four positions within the system (SPS_1: under trees, SPS_2: 3.75 m, SPS_3: 7.50 m and SPS_4: 11.25 m from the north row of trees) during five growth cycles

Letters compare SPS positions by Tukey's t test P ≤ 0.05.
*ns Significant and non-significant by Dunnett's test P ≤ 0.05, comparing SPS_1, SPS_2, SPS_3 and SPS_4 positions to a reference of a full sun system. Numbers within parentheses represent the standard error of the means.
There were no differences in forage accumulation when comparing the four positions during the summer, winter and spring of 2017, and summer of 2018, whereas, during the autumn of 2017, this variable was greater in the SPS3 position when compared to the SPS1 position (P = 0.028). No differences in forage accumulation were registered when comparing each of the four positions in the SPS to the INT.
When comparing the four positions in the SPS system, SLA differed only in the summer of 2017 (P = 0.008), in which the SPS1 presented greater SLA than the SPS3 position, while the positions did not differ among themselves in the other seasons (Table 2). When the four positions were compared to the INT, all positions in the spring (P < 0.001) and summer of 2017 (P < 0.0001) presented greater SLA than the INT. Additionally, the positions SPS1 and SPS2 during the autumn of 2017 (P = 0.042) also presented greater SLA as compared to the INT. On the other hand, during the winter of 2017, and summer of 2018 there were no differences between each of the four positions and the INT. The LAI did not vary among the positions of the integrated system except for the value registered the position SPS3 in the autumn of 2017 that was greater than the other positions (P = 0.006) (Table 2). Furthermore, there were no differences between each of the positions in the SPS and the INT.
Table 2. Leaf area characteristics of palisadegrass in an intensive system (INT) and in a silvopastoral system (SPS) at four positions within the system (SPS_1: under trees, SPS_2: 3.75 m, SPS_3: 7.50 m and SPS_4: 11.25 m from the north row of trees) during five seasons
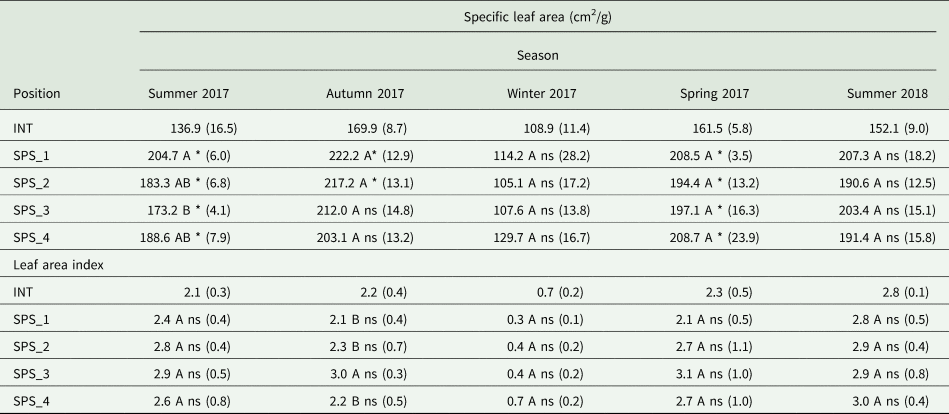
Letters compare SPS positions by Tukey's t test P ≤ 0.05.
*ns Significant and non-significant by Dunnett's test P≤ 0.05, comparing SPS_1, SPS_2, SPS_3 and SPS_4 positions to a reference of a full sun system. Numbers within parentheses represent the standard error of the means.
The leaf percentage did not differ among the SPS positions in any season evaluated (Fig. 4). In the spring of 2017, the leaf percentage in the SPS positions were higher than in the INT, comprising more than half of the forage mass in the SPS positions as compared to 32% in the INT. In addition, the leaf percentage in the SPS1 and SPS2 were higher than in the INT in the summer of 2018. There were no differences in leaf percentage between each of the SPS positions and the INT in the remainder of the seasons evaluated (Fig. 4).
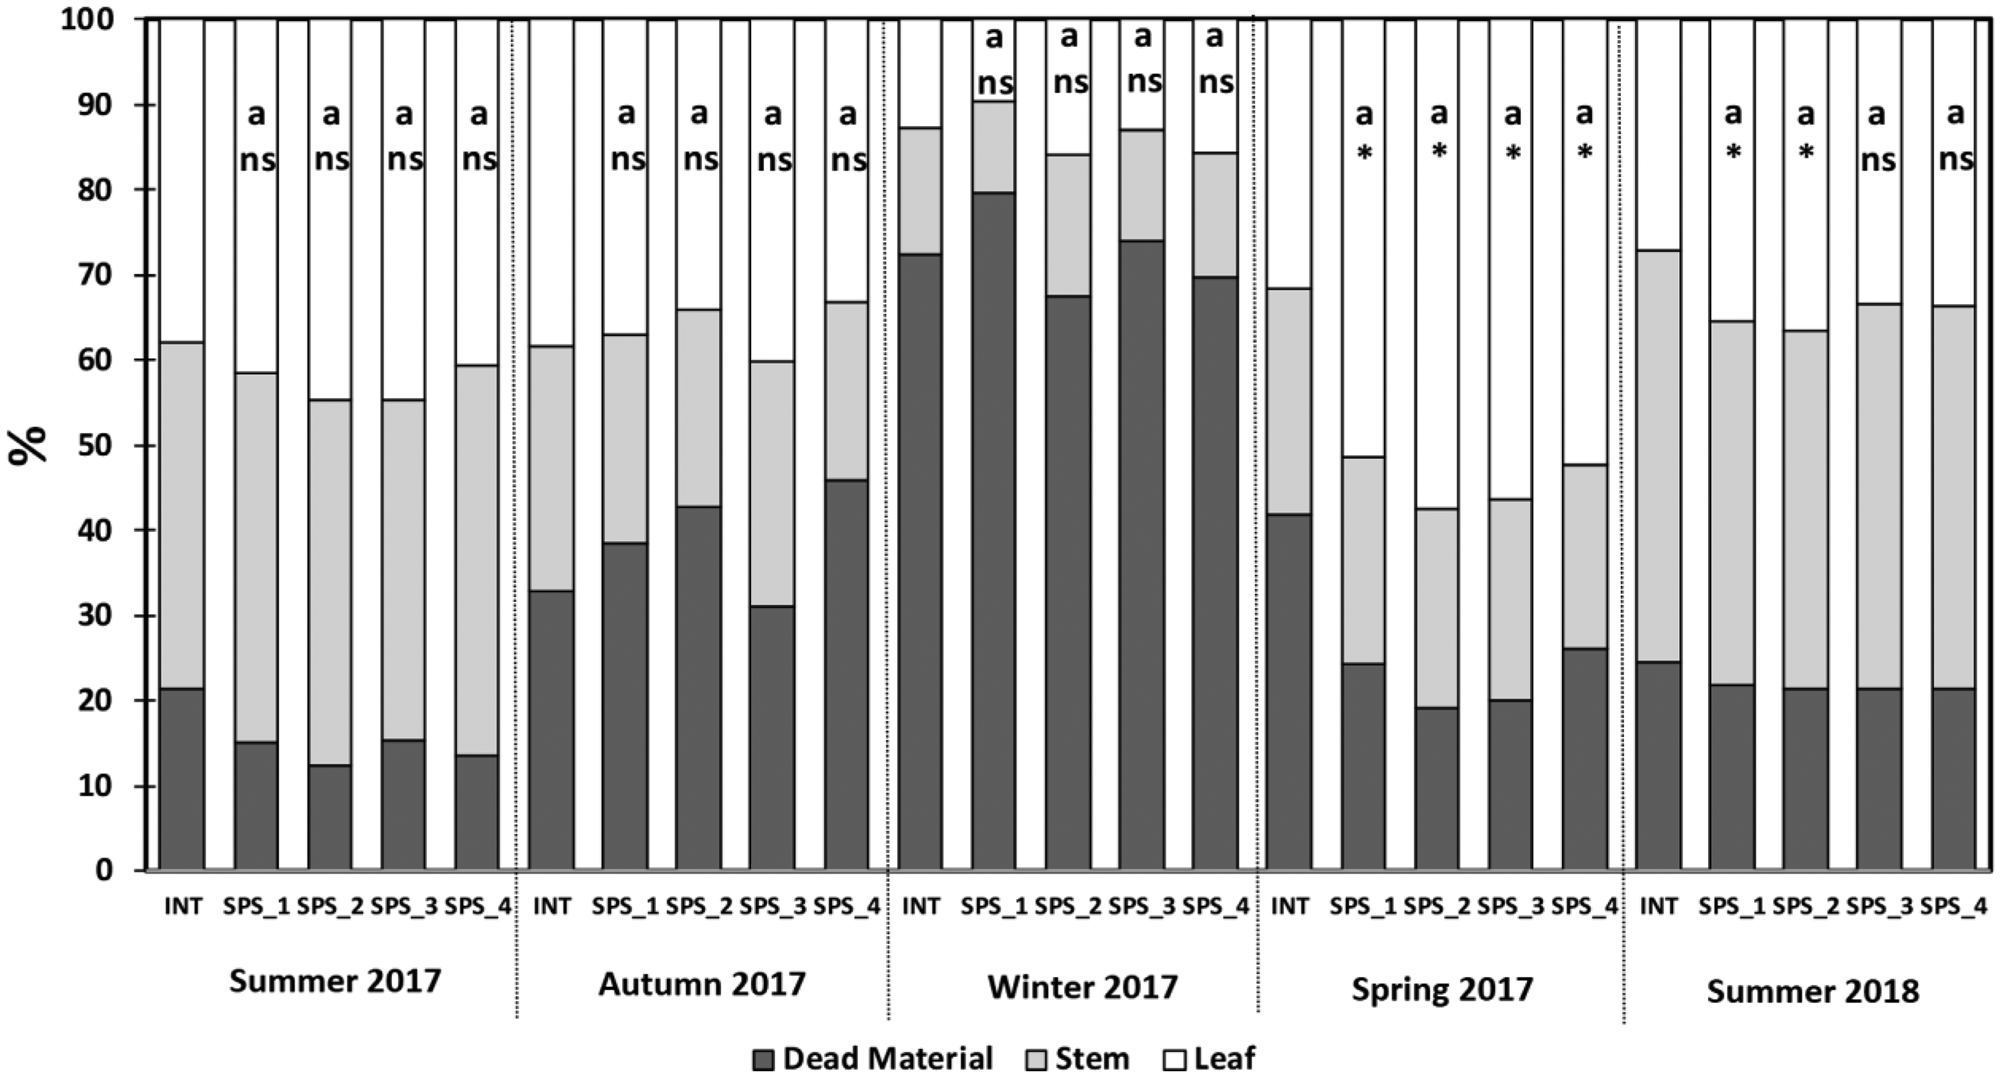
Fig. 4. Plant-part composition (leaf, stem and dead material) in an intensive system (INT) and in a silvopastoral system (SPS) at four positions within the system (SPS_1: under trees, SPS_2: 3.75 m, SPS_3: 7.50 m and SPS_4: 11.25 m from the north row of trees) during five growth cycles. Statistical comparisons were made solely for leaf percentage. Letters compare SPS positions by Tukey's t test P ≤ 0.05. *ns Significant and non-significant by Dunnett's test P ≤ 0.05, comparing SPS_1, SPS_2, SPS_3 and SPS_4 positions to a reference of a full sun system.
When comparing the four positions in the SPS, no differences in CP content were registered (Table 3). When comparing each of the four positions to the INT, the positions SPS1, SPS2 and SPS3 in the summer of 2017 (P = 0.001), SPS3 and SPS4 in the winter of 2017 (P = 0.018), and the four positions in the spring of 2017 (P < 0.001) and summer of 2018 (P < 0.001), presented greater CP content than the INT. During autumn there were no differences between each of the positions and the INT (P = 0.195).
Table 3. Nutritive characteristics of palisadegrass in an intensive system (INT) in a silvopastoral system (SPS) at four positions within the system (SPS_1: under trees, SPS_2: 3.75 m, SPS_3: 7.50 m and SPS_4: 11.25 m from the north row of trees) during five growth cycles
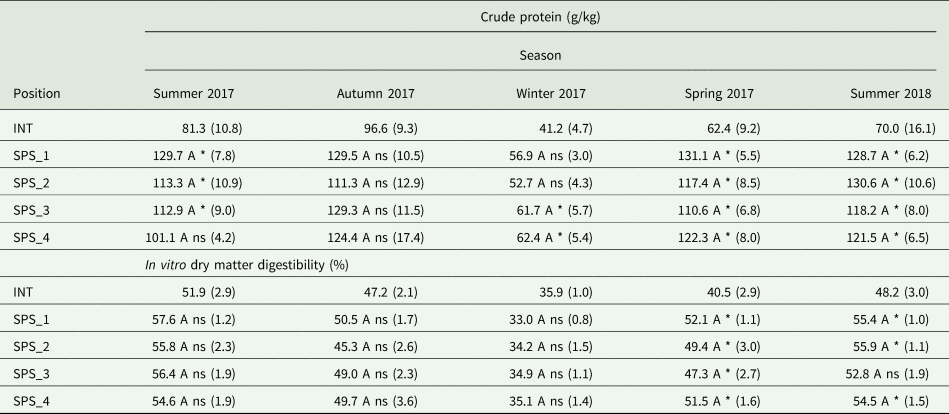
Letters compare SPS positions by Tukey's t test P ≤ 0.05.
*ns Significant and non-significant by Dunnett's test P ≤ 0.05, comparing SPS_1, SPS_2, SPS_3 and SPS_4 positions to a reference of a full sun system. Numbers within parentheses represent the standard error of the means.
For the IVDMD, there were no differences among the positions in the SPS (Table 3). Furthermore, all the positions in this system during the spring of 2017 (P < 0.001), and the positions SPS1, SPS2 and SPS3 during the summer of 2018 (P = 0.003), presented greater IVDMD, when compared to the INT, while for the other seasons there were no differences between the two systems (P = 0.188 for the summer of 2017; P = 0.556 for the autumn of 2017; P = 0.414 for the winter of 2017).
Discussion
The PAR transmission in this study was greater in all seasons when compared to studies carried out at the same experimental area before the thinning of the trees (Bosi et al., Reference Bosi, Pezzopane and Sentelhas2020a; Pezzopane et al., Reference Pezzopane, Bonani, Bosi, da Rocha, Bernardi, Oliveria and Pedroso2020a). The gap between the transmissions of the previous studies and the current study is greater when the comparison is made to the last year evaluated in the previous studies, because of the growing of the trees in those studies. The last year evaluated by those studies presented trees with size similar to the trees of this study, measuring 26.4-m height and DBH of 21.7 cm in February of 2016 (Bosi et al., Reference Bosi, Pezzopane and Sentelhas2020a), as compared to 27.8-m height and DBH of 2.59 cm measured in October of 2017 during this study.
When comparing the PAR transmission of this study to that registered in the last year evaluated by Pezzopane et al. (Reference Pezzopane, Bonani, Bosi, da Rocha, Bernardi, Oliveria and Pedroso2020a) and Bosi et al. (Reference Bosi, Pezzopane and Sentelhas2020a), the greatest increments were of 25, 20 and 19%, during the winter, summer and autumn of 2017, respectively. The lower increments of about 10% during the spring of 2017 and summer of 2018 are probably a consequence of the lateral growth of the trees during the experimental period. After thinning, as the competition for light among the trees diminishes, the lateral growth is stimulated. Additionally, during autumn and winter, as the near east-west orientation of the tree rows and the local latitude promotes high shading throughout the inter-row areas, the effects of thinning are raised. Analogously, Pezzopane et al. (Reference Pezzopane, Bernardi, Azenha, Oliveira, Bosi, Pedroso and Esteves2020b) working with an integrated crop-livestock-forest system for pasture renovation following the thinning of the trees, observed higher increments of PAR transmissions during the seasons of higher solar declinations when compared to the same system before the thinning (Pezzopane et al., Reference Pezzopane, Bernardi, Bosi, Oliveira, Marconato, Pedroso and Esteves2019a).
The increase in PAR transmission decreased the differences in pre-grazing live forage mass and forage accumulation between the SPS and INT positions when compared to the study performed before the thinning (Pezzopane et al., Reference Pezzopane, Bonani, Bosi, da Rocha, Bernardi, Oliveria and Pedroso2020a), showing the potential of tree management on increasing productivity of forage species. The absence of differences in forage accumulation between the INT and the SPS throughout the experiment is probably due to pasture morphological and physiological adaptations (Gomes et al., Reference Gomes, Pedreira, Bosi, Cavalli, Holschuch, Mourão, Pereira and Pedreira2019). Furthermore, pre-grazing live forage mass was similar among the positions of the SPS and the INT during the summer of 2017, when PAR transmission was approximately 70% in the SPS2, SPS3 and SPS4 (Table 1). Other studies confirm 70% of PAR transmission as the lower limit to ensure forage productivity in integrated systems, when drought stress is not severe (Bosi et al., Reference Bosi, Pezzopane, Sentelhas, Santos and Nicodemo2014; Lopes et al., Reference Lopes, Paciullo, Araujo, Morenz, Gomide, Maurício and Braz2017; Pezzopane et al., Reference Pezzopane, Bernardi, Bosi, Oliveira, Marconato, Pedroso and Esteves2019a). Besides the thinning, the high transmission through the trees is explained by the lower solar declination in the summer at the experimental site. On the other hand, in the summer of 2018, the development of the tree canopy reduced the PAR transmission and resulted in lower pre-grazing live forage in all SPS positions (Table 1). Under such conditions, more lenient grazing is recommended to avoid overgrazing and ensure appropriate pasture regrowth following defoliation and, consequently, long-term persistence.
Similar to the summer of 2018, the PAR transmissions in the SPS1, SPS2 and SPS4 positions during the autumn of 2017 were lower than 70% and, thus, the pre-grazing live forage mass was also lower than that of the INT (Table 1). On the other hand, the pre-grazing forage mass and forage accumulation in the SPS3 position were similar to that observed in the INT and higher than the other SPS positions in the same season. The ‘parabolic yield effect’ (Newman et al., Reference Newman, Bennett and Wu1998) describes higher yields achieved by the crops in central positions between tree lines when compared to positions next to the tree lines and occurs in diverse integrated systems (Newman et al., Reference Newman, Bennett and Wu1998; Reynolds et al., Reference Reynolds, Simpson, Thevathasan and Gordon2007; Mendes et al., Reference Mendes, Lacerda, Cavalcante, Fernandes and de Oliveria2013; Deiss et al., Reference Deiss, Moraes, Pelissari, Neto, Silva and Adreolla2014; Nicodemo et al., Reference Nicodemo, Castiglioni, Pezzopane, Tholon and Carpanezzi2016; Pezzopane et al., Reference Pezzopane, Bernardi, Bosi, Oliveira, Marconato, Pedroso and Esteves2019a). Thus, in SPSs, the higher pre-grazing live forage mass in central positions may play a key role in ensuring enough feed for livestock and pasture persistence.
The impact of the presence of trees in the production system upon soil moisture is dependent on local macroclimatic factors, and number and orientation of the trees. Thus, divergent results have been recorded about the issue. Some studies registered higher soil moisture in integrated systems when compared to full sun systems (Do Nascimento et al., Reference Do Nascimento, Pedreira, Sollenberger, Pereira, Magalhães and Chizzotti2019; Bosi et al., Reference Bosi, Pezzopane and Sentelhas2020b) and attributed that to the lesser evapotranspiration of shaded pastures. Other studies registered lower soil moisture in SPSs mainly near the tree lines (Pezzopane et al., Reference Pezzopane, Bosi, Nicodemo, Santos, da Cruz and Parmejiani2015; Glatzle et al., Reference Glatzle, Stuerz, Giese, Pereira, Almeida, Bungenstab, Macedo and Asch2021) and attributed that to the great water uptake by the trees in those positions. In this study, the winter of 2017 was the driest season (Fig. 3) and the greatest water competition between the forage species and the trees in the tree line resulted in a difference in pre-grazing live forage mass between SPS1 and INT (Tian et al., Reference Tian, Cacho, Youssef, Chescheir, Fischer, Nettles and King2017; Glatzle et al., Reference Glatzle, Stuerz, Giese, Pereira, Almeida, Bungenstab, Macedo and Asch2021). The low precipitation in this season is typical of the experimental location (Alvares et al., Reference Alvares, Stape, Sentelhas, Gonçalves and Sparovek2013) and diminishes forage production even in full sun systems (Brunetti et al., Reference Brunetti, Cavalcanti, Dias, Pezzopane and Santos2020). Thus, it remains uncertain whether the differences in live forage mass between the SPS sites and INT were caused by water stress, as observed by Pezzopane et al. (Reference Pezzopane, Bernardi, Azenha, Oliveira, Bosi, Pedroso and Esteves2020b), or by thinning the trees.
Understory pastures have less energy available for growth, i.e. PAR, as compared to full sun pastures. Hence, shaded plants display several morphological and physiological adaptations that allow for a better use of the available energy. Among those adaptations, the increase in SLA in shaded pastures is one of the most discussed (Pezzopane et al., Reference Pezzopane, Bernardi, Bosi, Oliveira, Marconato, Pedroso and Esteves2019a). Plants grown under low irradiation generally have thinner leaves with a high SLA, which increases light interception per unit leaf biomass, at the expense of a reduced number of chloroplasts and photosynthetic enzymes per unit leaf area (Evans and Poorter, Reference Evans and Poorter2001). Thus, this is advantageous for the plant in environments with low light regimes where a high number of chloroplasts and enzymes per unit leaf are not required. In the present study, the higher SLA in the four SPS positions in the summer and spring of 2017, and in the SPS1 and SPS2 positions of the autumn of the same year (Table 2) minimized the gap in forage accumulation and pre-grazing live forage mass between the SPS positions and the INT by the better use of the available energy. Additionally, the development of thinner leaves in the SPS positions equalled the LAI between the SPS and INT (Table 2), even when the biomass in the INT was higher (Table 1) and leaf percentages between the SPS and INT were similar as in the case of the autumn of 2017 (Fig. 4). During the winter of 2017, however, probably the lack of water availability offset the low-radiation effect on SLA, impairing the differences in SLA between the SPS and the INT, as the development of thicker leaves is a plant adaptation for decreasing evapotranspiration by reducing the leaf area subjected to transpiration (Fernández et al., Reference Fernández, Wang and Reynolds2002).
Differently from what occurs for forage productivity, pasture nutritive value is generally enhanced by the presence of trees in the system (Paciullo et al., Reference Paciullo, Gomide, Castro, Fernandes, Muller, Pires, Fernandes and Xavier2011b; de Carvalho et al., Reference de Carvalho, Domiciano, Mombach, do Nascimento, Cabral, Sollenberger, Pereira and Pedreira2019; Dias et al., Reference Dias, Costa, Severiano, Bilego, Furtini Neto, Almeida, Brand and Vilela2020). The diversification and enrichment of the SOM and soil microbiota through root sloughing of diverse species, litterfall (Nair et al., Reference Nair, Buresh, Mugendi, Latt, Buck, Lassoie and Fernandes1999; Wedderburn and Carter, Reference Wedderburn and Carter1999), and animal droppings (Belsky et al., Reference Belsky, Mwonga, Amundson, Duxbuty and Ali1993) are beneficial for the supplementation of mineral N for the understory species (Wilson, Reference Wilson1996; Paciullo et al., Reference Paciullo, Gomide, Castro, Fernandes, Muller, Pires, Fernandes and Xavier2011b), which explains the higher forage CP content in most seasons of this study when comparing the SPS positions to the INT (Table 3). In addition, under shaded environments with lower temperatures, the C4 photosynthesis enzymes are less efficient than in full sun pastures with higher temperatures (Long, Reference Long1983). The decrease in efficiency results in higher enzyme concentration per tissue mass and, as a great part of the leaf N is present in photosynthesis enzymes, higher N content in leaf tissue (Long, Reference Long1983).
Unlike values for the CP content, the IVDMD was higher in the SPS than in the INT only during the spring of 2017 and summer of 2018 (Table 3), the two seasons most distant from the thinning of the trees. The higher IVDMD in understory pastures (Santos et al., Reference Santos, Júnior, Vilela, Pulrolnik, Bufon and França2016) may be partly attributed to the higher CP content, but also to higher temperatures in full sun pastures when compared to understory pastures (Bosi et al., Reference Bosi, Pezzopane and Sentelhas2020a). Warming frequently increases the fibre content of forages, which reduces forage quality and digestibility (Nelson and Moser, Reference Nelson, Moser and Fahey1994; Dumont et al., Reference Dumont, Andueza, Niderkorn, Luscher, Porqueddu and Picon-Cochard2015). Bula (Reference Bula1972) has demonstrated that alfalfa cultivars grown under high temperatures had a greater number of smaller, more densely packed mesophyll cells as compared to plants grown under mild temperatures. The smaller cells have a higher surface: volume ratio which, in turn, results in a higher amount of cell wall and lower amount of cell content than the bigger cells and, thus, lower forage digestibility. Moreover, as higher temperatures promote faster development of warm-climate forages, it is possible that the understory pasture was physiologically less mature than the full-sun pasture. This, in turn, also contributes to the higher IVDMD in the SPS, as pasture digestibility generally decreases as the plant ages (Ferreira et al., Reference Ferreira, Abreu, Martinez, Braz and Ferreira2018). Thus, in the seasons close to the thinning of the trees, the tree's removal may have increased the understory temperature because of higher PAR transmission and lower transpiration by the trees, minimizing the differences in IVDMDs between the pasture grown in the SPS positions and in the INT. Nevertheless, more studies are needed to confirm this hypothesis.
Conclusion
Pre-grazing live forage mass and forage accumulation were similar in the silvopastoral and full sun pastures in the first summer of evaluation due to the low solar declination. However, due to the higher solar declination and the growing of the remaining trees, the pre-grazing live forage mass of the understory pasture was lower than that of the full sun pasture in the subsequent seasons and in the second summer evaluated. The CP content in the forage was higher in the understory pasture than in the full-sun pasture throughout the study. Conversely, the IVDMD of the understory pasture was only higher than that of the full sun pasture in the seasons which occurred distant from the thinning of the trees, indicating that such practice may impair the differences usually registered on forage digestibility. Thinning of trees in SPSs can be adopted to provide forage production similar to full sun pastures with higher protein content.
Acknowledgements
The authors are thankful to the Sustainable Rural Project – Cerrado, partnership between IDB, the United Kingdom Government, the Brazilian Ministry of Agriculture, Livestock and Supply, IABS and ICLF Network Association, through Embrapa, funded this study and granted scholarship to the first author.
Author contributions
J. R. M. P., A. C. C. B. and P. P. A. O. conceived and designed the study. J. R. M. P., W. L. B. and C. B. conducted data gathering. C. B. performed statistical analyses. H. B. B. and R. P. N. wrote the first draft of the article. All authors revised the article.
Financial support
São Paulo Research Foundation (FAPESP) funded this study (grant 2016/02959-1) and granted scholarships to the second and third authors (grants 2016/14538-0 and 2014/11931-8, respectively). The Sustainable Rural Project – Cerrado, partnership between IDB, the United Kingdom Government, the Brazilian Ministry of Agriculture, Livestock and Supply, IABS and ICLF Network Association, through Embrapa, funded this study and granted scholarship to the first author. National Council for Scientific and Technological Development (CNPq) granted a research productivity fellowship to the second author.
Conflict of interest
The authors declare there are no conflicts of interest.
Ethical standards
Not applicable.


