Introduction
The seed biotechnology industry has responded to the proliferation of herbicide-resistant weeds by developing genetically modified row-crop cultivars resistant to the synthetic auxin herbicides 2,4-D and dicamba (Behrens et al. Reference Behrens, Mutlu, Chakraborty, Dumitru, Jiang, LaVallee, Herman, Clemente and Weeks2007; Egan et al. Reference Egan, Barlow and Mortensen2014; Feng and Brinker Reference Feng and Brinker2014; Mortensen et al. Reference Mortensen, Egan, Maxwell, Ryan and Smith2012; Richburg et al. Reference Richburg, Wright, Braxton and Robinson2012; Wright et al. Reference Wright, Shan, Walsh, Lira, Cui, Song, Zhuang, Arnold, Lin, Yau, Russell, Cicchillo, Peterson, Simpson, Zhou, Ponsamuel and Zhang2010). Monsanto’s XtendFlex® system (Monsanto, 800 North Lindbergh Boulevard, St Louis, MO 63167) is predicated on the use of dicamba-resistant cotton (Behrens et al. Reference Behrens, Mutlu, Chakraborty, Dumitru, Jiang, LaVallee, Herman, Clemente and Weeks2007; Feng and Brinker Reference Feng and Brinker2014). The adoption of XtendFlex® technology is high and accounted for greater than 60% of cotton acres in the midsouthern United States during 2017, as producers are combating increasingly difficult to control weed populations (USDA 2017). Furthermore, the history of off-target dicamba movement is also prompting certain growers to protect crops from potential off-target exposure to the synthetic auxin herbicides by adopting a defensive planting strategy involving the use of dicamba-resistant cultivars (Egan et al. Reference Egan, Barlow and Mortensen2014; Mortensen et al. Reference Mortensen, Egan, Maxwell, Ryan and Smith2012).
Whereas XtendFlex® cultivars are resistant to dicamba, many susceptible cultivars are commonly planted. Cotton’s susceptibility to dicamba has been well documented (Egan et al. Reference Egan, Barlow and Mortensen2014; Marple et al. Reference Marple, Al-Khatib, Shoup, Peterson and Claassen2007, Reference Marple, Al-Khatib and Peterson2008). However, adoption of auxin herbicide–based weed control programs will likely increase the incidence of off-target exposure to auxin herbicides on susceptible crops. As such, 2,708 complaints of damage to more than 1.4 million hectares of soybean were reported across many states during 2017 (Bradley Reference Bradley2017). Off-target exposure primarily occurs through contamination of spray equipment, spray drift, or postdepositional volatilization, each of which tends to occur at sublethal herbicide concentrations (Egan et al. Reference Egan, Barlow and Mortensen2014; Mortensen et al. Reference Mortensen, Egan, Maxwell, Ryan and Smith2012).
Crop injury from off-target exposure to sublethal concentrations of dicamba has been a reported issue since at least the 1970s (Behrens and Lueschen Reference Behrens and Lueschen1979; Bovey and Meyer Reference Bovey and Meyer1981). The number of recent complaints of off-target exposure during the 2017 growing season indicate that off-target auxin exposure events will likely continue (Bradley Reference Bradley2017; Egan et al. Reference Egan, Barlow and Mortensen2014). Exacerbating the potential for damage from dicamba is the propensity of dicamba to persist in spray equipment via sequestration (Boerboom Reference Boerboom2004; Cundiff et al. Reference Cundiff, Reynolds, Thomas and Mueller2017). Equipment contamination constitutes a large concern, especially in regions where growers often rely on commercial application for weed control (Mortensen et al. Reference Mortensen, Egan, Maxwell, Ryan and Smith2012).
Dicamba and other synthetic auxin herbicides cause distinct injury symptoms on susceptible crops and thus are among the active ingredients most frequently cited in claims of off-target herbicide damage (Egan et al. Reference Egan, Barlow and Mortensen2014). Injury symptoms such as leaf malformation and stem and petiole epinasty are conspicuous on susceptible crops affected by auxin herbicides and often have led to investigation of the relationship between dicamba applications and damage to susceptible crops (Marple et al. Reference Marple, Al-Khatib, Shoup, Peterson and Claassen2007; Sciumbato et al. Reference Sciumbato, Chandler, Senseman, Bovey and Smith2004). Johnson et al. (Reference Johnson, Fisher, Jordan, Edmisten, Stewart and York2012) quantified the response of 3-wk-old cotton to dicamba concentrations ranging from 0.547 g ae ha−1 to 140 g ae ha−1 and noted injury ranging from 47% to 75% and significant yield loss at one site-year from exposure to the two highest concentrations. Everitt and Keeling (Reference Everitt and Keeling2009) found that increased dicamba concentration led to increased injury, especially in preflowering cotton. However, 140 g ai ha−1 dicamba was necessary for yield losses greater than 15% (Everitt and Keeling Reference Everitt and Keeling2009). Similarly, Marple et al. (Reference Marple, Al-Khatib, Shoup, Peterson and Claassen2007) characterized the response of 6- to 8-leaf cotton to dicamba concentrations ranging from 1.40 g ae ha−1 to 5.61 g ae ha−1 and found that all concentrations caused minimal visible injury that disappeared by 56 DAT, and 5.61 g ae ha−1 was necessary to reduce yields. This difference seems to suggest that cotton at advanced stages of growth is more susceptible than younger cotton to yield loss from dicamba exposure. Egan et al. (Reference Egan, Barlow and Mortensen2014) reaffirmed that exposure to dicamba during early (vegetative) growth stages generally results in minimal yield losses.
Increased dicamba use will likely continue to exacerbate the occurrence of off-target exposure events on susceptible cotton. Therefore, an experiment was conducted to evaluate cotton sensitivity to a sublethal concentration of dicamba and subsequent injury and yield effects as influenced by the crop’s growth stage at exposure. The objective of this experiment was to identify the cotton growth stage most susceptible to injury and yield loss from a sublethal concentration of dicamba and to characterize yield partitioning following exposure to sublethal applications of dicamba.
Materials and Methods
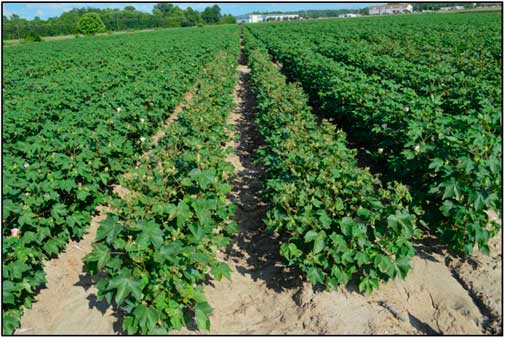
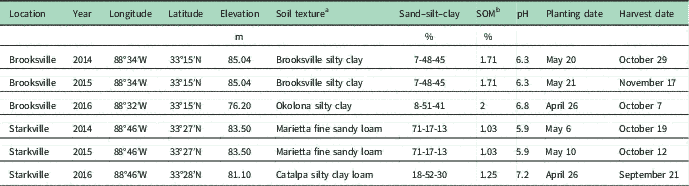
Field studies were conducted at the R. R. Foil Plant Research Facility in Starkville, MS, and the Black Belt Branch Experiment Station in Brooksville, MS, in 2014, 2015, and 2016 to determine cotton sensitivity to a sublethal concentration of dicamba at various growth stages. Site details for each of the 6 site-years are provided in Table 1. The cultivar ‘DP 1321 B2RF’ (Monsanto) was seeded at a rate of 128,440 seeds ha−1 and a depth of 2.5 cm in each site-year. Experiments at each location were managed with standard production practices recommended by the Mississippi State University Extension Service.
Table 1 Details for locations of experiments in 2014, 2015, and 2016.
a Source: U.S. Department of Agriculture–Natural Resources Conservation Service. http://websoilsurvey.sc.egov.usda.gov/App/WebSoilSurvey.aspx. Accessed: November 2, 2016.
b SOM, soil organic matter.
At each site-year, individual experimental units were four 97-cm rows of 12.2-m length. Each experiment was conducted as a randomized complete block design with each block containing a nontreated control (NTC) plot for comparison. Dicamba (Clarity®, BASF, 100 Park Avenue, Florham Park, NJ 07932) application timing was the experimental factor. The only formulations of dicamba labeled for use in Xtend™ crops are XtendiMax™, FeXapan™ (DuPont USA, 1007 Market Street, Wilmington, DE 19898), and Engenia™ (BASF). However, because the active herbicidal acid is identical in all these formulations and in the diglycolamine salt formulation of dicamba (Clarity®), the dicamba formulation of Clarity® was used in these experiments.
The initial application (PRE) was made immediately following planting; with 14 subsequent applications made weekly to separate replicated plots until 14 wk after emergence (WAE). Previous research suggests that a dicamba concentration of 35 g ae ha−1 is sublethal but still results in visible symptomology on susceptible cotton (Smith et al. Reference Smith, Irby, Reynolds, Bruce and Willers2012). This concentration is in the range used in previous studies to simulate off-target dicamba exposure (Egan et al. Reference Egan, Barlow and Mortensen2014; Johnson et al. Reference Johnson, Fisher, Jordan, Edmisten, Stewart and York2012; Marple et al. Reference Marple, Al-Khatib, Shoup, Peterson and Claassen2007). Dicamba applications were made at 4.8 kph using a CO2-pressurized plot backpack sprayer calibrated to deliver 140 L ha−1 at 276 kPa through a four-nozzle spray boom equipped with TTI11002 spray tips (TeeJet® Technologies, Glendale Heights, IL 60139) at a height of 51 cm above the crop canopy. Dicamba applications were made to the center 2 rows of each plot, with the outer rows of the treated area serving as a buffer between plots.
Visible estimates of crop injury were made at 7, 14, 21, and 28 d after treatment (DAT) in each treated plot, with injury ranging from 0 (no injury) to 100 (complete plant mortality) (Frans et al. Reference Frans, Talbert, Marx and Crowley1986). Node stacking, leaf margin fusing, chlorosis, cupping, and changes in height were the most commonly identified injury symptoms (Figure 1). Node above cracked-boll (NACB) counts from the center 2 rows of each plot were recorded when the NTC reached 5 or fewer nodes above white flower (Bourland et al. Reference Bourland, Oosterhuis and Tugwell1992; Kerby et al. Reference Kerby, Supak, Banks and Snipes1992).
Figure 1 Characteristic cotton injury symptomology from exposure to a dilute concentration of dicamba. Node stacking, leaf cupping, and leaf margin chlorosis were the most commonly evaluated symptoms.
Cotton height was recorded following harvest aid application, and a 3-m section of plants from the second row of each plot were then hand harvested using the partitioned sections of a large box shown in Figure 2 (Jenkins et al. Reference Jenkins, McCarty and Parrot1990). All plots were machine harvested using a 2-row plot picker, and seed cotton weight from the machine-harvested plot was recorded. Machine-harvested yield data were combined with the total hand-harvested seed cotton weight for each plot to calculate total seed cotton yield. In each of the 2016 experiments, gin turnout data were recorded from a 250-g sample collected from box-mapped seed cotton in each plot. Fiber quality was determined using a high-volume instrument at Texas Tech Fiber and Biopolymer Research Institute (1001 East Loop 289, Lubbock, TX 79403).
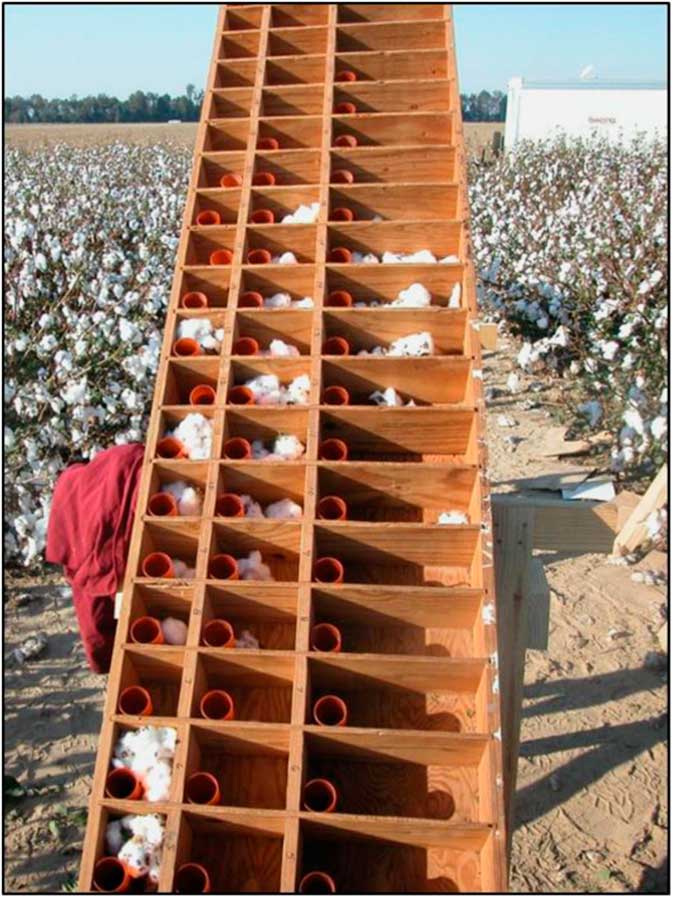
Figure 2 Box used for partitioning hand-harvested seed cotton to be used for plant-mapping analyses. Bolls are removed from each plant by fruiting site and partitioned in the corresponding slot of the box.
Injury, relative maturity, crop height, and machine-harvested cotton yield reduction data were subjected to an ANOVA using the PROC MIXED feature of SAS v. 9.4 software (SAS Institute, Cary, NC 27513), with treatments separated using Fisher’s protected LSD at the alpha = 0.05 level of significance. Additionally, machine-harvested yield reduction data were regressed by application timing using PROC REG to assess the relationship between application timing and cotton response. Machine-harvested yield data are presented as percent reductions relative to the yield of the NTC.
Hand-harvested data were also subjected to an ANOVA and mean separation using PROC MIXED. Hand-harvested data were analyzed by horizontal position, vertical zone, and maturity cohort. Yield partitioned to a given position or zone is presented as raw seed cotton weight and as a percentage of the total seed cotton weight from each treatment. All bolls harvested from the fruiting site immediately adjacent to the main stem on each branch were partitioned to position 1, with bolls on the next horizontal fruiting position partitioned to position 2, and any bolls harvested from the third fruiting site and beyond partitioned to position 3. Yield was also partitioned on a vertical basis. All bolls taken from fruiting sites on sympodial (reproductive) branches up to the 8th main stem node partitioned to zone 1, bolls from branches on the 9th to 12th nodes partitioned to zone 2, and bolls on branches stemming from the 13th and beyond nodes partitioned to zone 3 (Huff et al. Reference Huff, Dodds, Irby and Reynolds2010; Jenkins et al. Reference Jenkins, McCarty and Parrot1990). Bolls harvested from any fruiting site on a monopodial (vegetative) branch were classified as vegetative, whereas bolls harvested from any position on a plant that had lost apical dominance were classified as aborted, and each of these classifications was treated as a discrete fruiting site independent of vertical or horizontal partitioning. Thus, when summing the total hand-harvested yield from a given exposure timing, there are two methods that each sum to the same number: (1) add the weights corresponding to each position plus the vegetative and aborted weights; or (2) add the weights corresponding to each vertical zone plus vegetative and aborted weights.
Assuming cotton exhibits a 6-d horizontal fruiting interval and a 3-d vertical fruiting interval, an analysis was conducted based on fruiting-site age cohorts, which contain fruiting sites of the same age. In this system, cohort 7 would include the first fruiting position on node 11, the second on node 9, and the third on node 7 (Huff et al. Reference Huff, Dodds, Irby and Reynolds2010; Jenkins et al. Reference Jenkins, McCarty and Parrot1990). Bednarz and Nichols (Reference Bednarz and Nichols2005) reported different values for vertical and horizontal fruiting intervals that might be attributed to differing environments and the evolution of varieties; however, values reported by Jenkins et al. (Reference Jenkins, McCarty and Parrot1990) were used, as they were determined in environments similar to the ones in this research.
Year and location combinations were classified together as environments during analyses. All data met appropriate model assumptions; studentized residual values were calculated for each data point before ANOVA, and values in excess of 2.5 were removed as outliers. Application timing was considered a fixed factor, while environment was considered a random factor. This experiment was designed to use multiple-environment trials (METs) to estimate treatment effects over broad inference spaces, and thus all data were pooled over environment, and treatment means are reported using least-squares means (Blouin et al. Reference Blouin, Webster and Bond2011; Carmer et al. Reference Carmer, Nyquist and Walker1989). This approach to including environment data analysis using METs for broad inference-based studies is useful for making inferences over a wide range of environmental parameters, including time and space (Blouin et al. Reference Blouin, Webster and Bond2011; Carmer et al. Reference Carmer, Nyquist and Walker1989; Walker et al. Reference Walker, Bond, Ottis, Gerard and Harrell2008; Yang Reference Yang2010).
Results and Discussion
Cotton Morphological Response
Observed cotton injury symptoms were consistent with those described in previous research and included loss of apical dominance, leaf cupping and chlorosis, and height effects (Figure 1) (Johnson et al. Reference Johnson, Fisher, Jordan, Edmisten, Stewart and York2012; Marple et al. Reference Marple, Al-Khatib and Peterson2008). Cotton growth stage at exposure timing, crop injury, NACB counts, crop height, machine-harvested yield reductions, and total hand-harvested seed cotton yield averaged over environment are shown in Table 2. Cotton growth stage was approximately the same in each experiment at similar exposure timings, and average weather parameters during the growing seasons (April to November) fell within or close to average historical ranges. Injury was observed from exposure to dicamba at 1 to 9 WAE. The most severe injury ranged from 24% to 32% and occurred from exposure at 6 and 7 WAE, which correlated with 8- to 10-node cotton in early reproductive growth stages (presence of pinhead or match-head squares). This result is consistent with previous findings regarding visible injury occurrence following dicamba exposure (Egan et al. Reference Egan, Barlow and Mortensen2014; Marple et al. Reference Marple, Al-Khatib and Peterson2008). No significant injury was recorded when exposure occurred after 9 WAE, which corresponded to 13-node cotton beginning to flower. Maturity was delayed following exposure from 7 to 10 WAE on 10- to 14-node cotton with reproductive growth. Although only the 7 WAE exposure timing associated with delayed maturity corresponded to a reduction in total hand-harvested yield (Table 2), it is important to note the possibility of lost yield potential if an early frost were to occur on cotton with delayed maturity. When exposure occurred from 8 to 10 or at 13 WAE, crop height was increased. Exposure to dicamba at 6 WAE (8-node squaring cotton) resulted in an 18% reduction in machine-harvested yield, whereas exposure at 7 WAE (10-node squaring cotton) resulted in a reduced total hand-harvested yield. This observation corroborates previous findings that estimates of injury based on in-season observations are not always reliable indicators of yield effects; in fact, yield reductions tend to be minimal when cotton is exposed to dilute concentrations of dicamba (Egan et al. Reference Egan, Barlow and Mortensen2014; Everitt and Keeling Reference Everitt and Keeling2009; Marple et al. Reference Marple, Al-Khatib, Shoup, Peterson and Claassen2007). Polynomial modeling of the machine-harvested yield reductions by exposure timing was conducted and found no adequate models (unpublished data).
Table 2 The effect of application timing of 35 g ae ha−1 dicamba on injury, relative maturity, crop height, yield reduction, and total yield averaged over environment. a
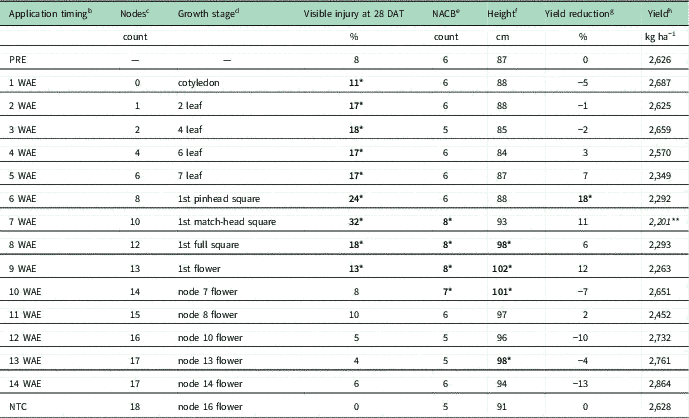
a Bolded values with one asterisk (*) are significantly increased relative to the nontreated check (NTC). Italicized values with two asterisks (**) are significantly decreased relative to the NTC.
b Application timing, the number of weeks after emergence (WAE) at which application occurred. NTC, nontreated check.
c Nodes, the number of nodes on cotton plants at the time of application.
d Growth stage, the cotton growth stage at the time of application.
e NACB, nodes above cracked boll.
f Average crop height at defoliation.
g Average machine-harvested seed cotton yield reduction relative to the NTC.
h Total yield: total weight of the hand harvested seed cotton of plots treated at the same timing.
Hand-Harvested and Mapped Yield Data
By Horizontal Position
Table 3 shows seed cotton weight by horizontal fruiting position, vegetative position, aborted terminal partitioning, and weight by vertical zone averaged over environment. Reductions in seed cotton weight partitioned in position 1 bolls resulted from exposure to dicamba at 3 to 9 WAE, ranging from 2-node cotton to 13-node flowering cotton. A further reduction in seed cotton weight partitioned in position 2 bolls was observed if exposure occurred at 3 to 6 WAE to cotton ranging from 2-node to early squaring growth stages. No effects were observed on seed cotton weight partitioned in position 3 bolls. Increased seed cotton weight partitioned on vegetative branches occurred following exposure at 2 and 3 WAE on 1- to 2-node cotton. Additional increases were observed in yield partitioned to plants with aborted terminals when cotton exposure to dicamba occurred at 3 to 7 WAE (2-node to 10-node squaring cotton). Only 28 kg ha−1 of seed cotton was partitioned on plants with aborted terminals in the NTC, whereas up to 1,048 kg ha−1 was on plants with aborted terminals when exposure occurred at 3 to 7 WAE. Table 4 contains seed cotton weight by position or zone expressed as a percent of the total seed cotton weight of plants in each exposure timing averaged over environment. An average of 75% of seed cotton yield in the NTC was partitioned to position 1 bolls with an additional 16% on position 2 bolls, 3% on position 3 bolls, 5% on bolls on vegetative branches, and 1% on bolls on plants with aborted terminals. When dicamba exposure occurred from 3 to 7 WAE and 2 to 6 WAE, reduced percent yield partitioned to position 1 and 2 bolls occurred, respectively. Increased percent yield on position 3 bolls occurred following exposure at 9 WAE (13-node cotton beginning to flower) along with increased yield partitioned to vegetative branches following exposure at 2, 3, and 5 through 7 WAE. Further increases up to 43% of yield partitioned to plants with aborted terminals occurred from dicamba exposure at 3 to 7 WAE.
Table 3 The effect of application timing of 35 g ae ha−1 dicamba on seed cotton yield partitioning by horizontal position and vertical zone averaged over environment. a
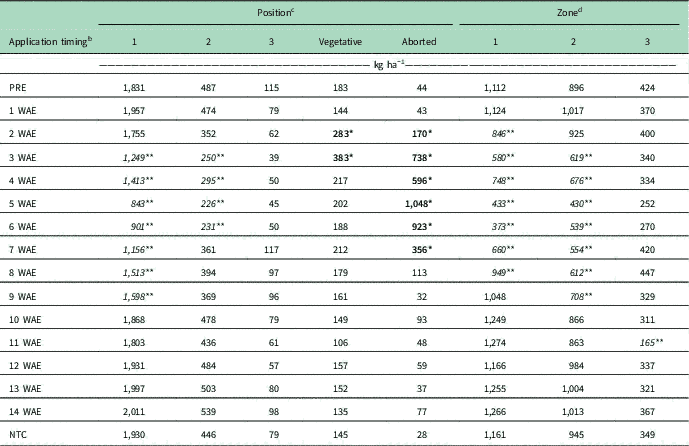
a Bolded values with one asterisk (*) are significantly increased relative to the nontreated check (NTC). Italicized values with two asterisks (**) are significantly decreased relative to the NTC.
b Application timing, the number of weeks after emergence (WAE) at which application occurred.
c Position 1, located at position 1 fruiting sites; position 2, located at position 2 fruiting sites; position 3, located at position 3 fruiting sites; vegetative, any fruiting sites partitioned on monopodial (vegetative) branches; aborted, any fruiting sites partitioned on plants that have lost apical dominance.
d Zone 1, located on branches from nodes 5 through 8; zone 2, located on branches from nodes 9 through 12; zone 3, located on branches from node 13 and beyond.
Table 4 The effect of application timing of 35 g ae ha−1 dicamba on cotton yield partitioning as a percent of the total treatment weight by horizontal position and vertical zone averaged over environment. a
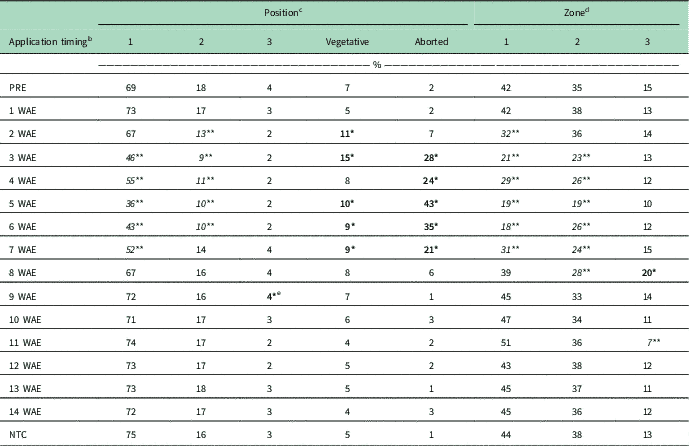
a Bolded values with one asterisk (*) are significantly increased relative to the nontreated check (NTC). Italicized values with two asterisks (**) are significantly decreased relative to the NTC.
b Application timing, the number of weeks after emergence (WAE) at which application occurred
c Position 1, located at position 1 fruiting sites; position 2, located at position 2 fruiting sites; position 3, located at position 3 fruiting sites; vegetative, any fruiting sites partitioned on monopodial (vegetative) branches; aborted, any fruiting sites partitioned on plants that have lost apical dominance.
d Zone 1, located on branches from nodes 5 through 8; zone 2, located on branches from nodes 9 through 12; zone 3, located on branches from node 13 and beyond.
e Data are presented rounded to the nearest whole percent, resulting in this value being significant but rounded down, whereas others are not significant but have been rounded up to the same value.
By Vertical Zone
Reductions in seed cotton weight partitioned in zones 1 and 2 were observed following dicamba exposure from 2 to 8 or 3 to 9 WAE, respectively, comprising cotton ranging from 1-node to flowering (Table 3). A reduction in weight partitioned in zone 3 resulted from exposure to dicamba at 11 WAE to approximately 15-node cotton containing up to 8 flowering nodes (Table 3). When seed cotton weight is expressed as a percent of total weight for each treatment, decreased yield in zones 1, 2, and 3 resulted from exposure at 2 to 7, 3 to 8, and 11 WAE, respectively (Table 4). An increase in percent yield partitioned in zone 3 was observed following exposure at 8 WAE (Table 4).
By Maturity Cohort
The results of the analysis of yield partitioned by fruiting structure age were similar to the horizontal position and vertical zone analyses, in that loss of yield partitioned to older fruiting sites often accompanied corresponding increases in yield partitioned to younger fruiting sites (unpublished data).
Fiber Quality
Delayed maturity observed from many treatments during the first 2 yr necessitated fiber-quality analysis during the final year of the study. Table 5 shows the results for gin turnout, micronaire, fiber length, fiber length uniformity, fiber strength, and fiber elongation by treatment averaged over environment. No differences were recorded for any treatment for gin turnout, fiber length, or fiber elongation. Micronaire was increased from exposure to dicamba at 11 WAE (15-node flowering cotton), and fiber length uniformity was decreased from exposure at 9 to 10 WAE (13- to 14-node flowering cotton). Fiber strength results were irregular. Exposure at 6 or 14 WAE (early squaring and full-bloom cotton, respectively) increased fiber strength, while exposure at 9 WAE (early flowering cotton) reduced fiber strength (Table 5). Overall, only small effects were found on fiber quality, except for the increase in micronaire score from exposure to dicamba at 11 WAE and the decrease in fiber length uniformity that resulted from exposure to dicamba at 9 and 10 WAE. Changes in micronaire score can cost producers financially if they are above 5.0 or below 3.4, which would result in discounted market value (Anonymous 2013). Fiber length uniformity is a key property for manufacturing efficiency, as reductions of approximately 1.5% in fiber length uniformity are potentially problematic.
Table 5 Cotton gin turnout, micronaire reading, fiber length, fiber length uniformity, fiber strength, and fiber elongation as affected by application timing of 35 g ae ha−1 dicamba averaged over environment. a
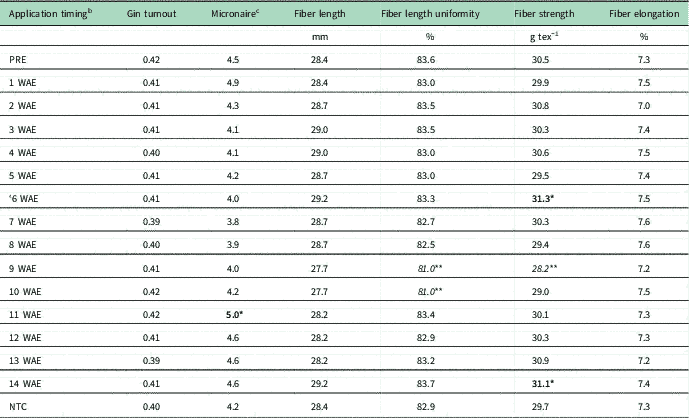
a Bolded values with one asterisk (*) are significantly increased relative to the nontreated check (NTC). Italicized values with two asterisks (**) are significantly decreased relative to the NTC.
b Application timing, the number of weeks after emergence (WAE) at which application occurred.
c Micronaire score: below 3.4 or above 5.0 indicate poor fiber permeability and qualify for discounted value; 3.5–3.6 or 4.3–4.9 indicates cotton of base value; 3.7–4.2 indicates cotton of premium value.
Significance of Findings for Cotton Management
Cotton yield distribution as well as total lint yield are both important considerations in assessing crop yield. While cotton has the ability to recover from early-season stress by producing new growth and compensatory yield structures, the partitioning of yield can be a concern for producers. If exposure occurs at early- to mid-reproductive growth, overall yield may not be reduced; however, a greater proportion of yield may be partitioned to outer positions, upper nodes, and plants with aborted terminals, which can delay maturity and is often associated with reductions in micronaire, although changes in micronaire were minimal in these data. As demonstrated here, cotton has a compensatory ability to recover from exposure to concentrations of dicamba up to 35 g ae ha−1. These findings are consistent with previous literature (Egan et al. Reference Egan, Barlow and Mortensen2014; Everitt and Keeling Reference Everitt and Keeling2009; Marple et al. Reference Marple, Al-Khatib, Shoup, Peterson and Claassen2007). While observation of foliar damage to cotton following exposure to dicamba is often alarming, it may not be a true indication of yield losses. However, these data show that the timing of exposure is important and that exposure during early reproductive growth appears most probable to delay maturity and adversely affect yield.
Acknowledgments
The authors would like to thank Cotton Incorporated and Monsanto Company for partial funding of this research. No conflicts of interest have been declared.