INTRODUCTION
Autoclaved aerated concrete (AAC) is widely used as a building material because of its superior heat-insulation efficiency and fire resistance (Grutzeck, Reference Grutzeck, Scheffler and Colombo2005). A typical process for the AAC production includes hydrothermal treatment of a mixture of quartz sand, lime, cement, gypsum, and some other additives at high temperatures (typically, 180–200°C) under a saturated steam pressure, which results in the formation of crystalline calcium silicate hydrates, namely, tobermorite [Ca5Si6O16(OH)2–4H2O]. Since both the quantity and quality of tobermorite formed in the AAC significantly affect the mechanical properties of AAC (Mitsuda et al., Reference Mitsuda, Sasaki and Ishida1992), understanding the mechanism of tobermorite formation during the hydrothermal treatment (i.e., autoclave process) is very important in AAC production.
The synthesis of tobermorite under hydrothermal conditions has been extensively studied for various starting materials including several types of silica sources and various additives. It has been revealed that Al compounds have significant effects on the tobermorite formation process (Larosa-Thompson and Grutzeck, Reference Larosa-Thompson and Grutzeck1996). Kinetic approaches have also been tried for clarification of the tobermorite formation (Houston et al., Reference Houston, Maxwell and Carroll2009). However, the tobermorite formation process is more complicated in the industrial AAC production because of various impurities in raw materials. Therefore, the formation mechanism of tobermorite is not thoroughly understood.
We have developed a relatively large-sized autoclave cell for in situ transmission XRD, which has sufficient space for the sample and the water reservoir (Kikuma et al., Reference Kikuma, Tsunashima, Ishikawa, Matsuno, Ogawa, Matsui and Sato2009, Reference Kikuma, Tsunashima, Ishikawa, Matsuno, Ogawa, Matsui and Sato2010). The temperature and pressure in the cell can be controlled with high precision, and it is relatively easy to control water content around the sample. In addition, a two-dimensional pixel array detector was introduced to improve the time resolution. In the present study, we conducted in situ time-resolved XRD during the autoclave process using the newly developed cell, and the effect of Al compounds to the tobermorite formation reaction in the AAC process was investigated as well.
EXPERIMENT
Materials and sample preparation
The starting materials were mixtures of 54.4 wt% crushed natural quartz sand, 4.7 wt% quicklime (Kawai Sekkai, Ogaki, Japan), 38.9% high early strength Portland cement (Ube-Mitsubishi, Ube, Japan), and 2.0 wt% gypsum (Wako: research grade, Osaka, Japan). Al compound used in this study was γ-Al2O3 (Wako: research grade). Mixtures without Al addition [Al/(Al+Si)=0.037] and with 5 mol% Al addition [Al/(Al+Si)=0.088] were prepared. Both of them were fully mixed in the presence of water at 50°C for several minutes using a motor-driven blade stirrer. The water-to-solid ratio was 0.75 by weight. For each run, the slurry mixture was poured into a plastic beaker and kept at 60°C for more than 12 h for the cement in the mixture to become hydrated. The hydrated mixture was then cooled, and cut into a specimen with dimensions of 6×18 mm2 and thickness of 3.0 mm, immediately before the in situ measurement was conducted. In this study we did not use a foaming agent (e.g., Al metal powder), to avoid a nonuniformity of X-ray transmission in the samples.

Figure 1. Stuck of time-resolved XRD patterns for sample without Al addition. Temperature was raised from 100 to 190°C and held at 190°C. T, tobermorite; P, portlandite; Q, quartz; MS, monosulfate; KA, katoite; HE, hydroxylellestadite.
In situ XRD measurement
XRD measurements were carried out at the BL19B2 beamline of SPring-8. A 30 keV incident X-ray beam was selected so that the transmittance of the X-ray beam through the samples would be around 50%. The temperature of the autoclave cell was controlled by a copper heater block surrounded by a heat insulator. First, the temperature was raised to 100°C at a ramping rate of 2°C/min. The temperature was held at 100°C for 15 min. During this period, the cell was evacuated for a few seconds, and about 95% of the air was removed from the cell. After the steam pressure was built up again at 100°C, the first XRD measurement was conducted. After 15 min at 100°C, the temperature was raised again to 190°C at a ramping rate of 1°C/min, and then held at 190°C for 12 h. During this process, the XRD measurements were conducted using a photon-counting pixel array detector, PILATUS 100 K (DECTRIS, Baden, Switzerland). The exposure time was 60 s for each image, and the measurement interval was 4.25 min, including the time for moving the detector. During the exposure time, the cell, together with the heater block, was oscillated in the vertical direction by 3.0 mm at a rate of 0.6 mm/s to average over a larger area of the sample.
Analysis of non-crystalline phase
In the present in situ experiment, we were able to observe the intensity change of an amorphous halo at around 3.4 nm−1, where the halo of non-crystalline C-S-H is observed. Non-crystalline C-S-H is formed by the hydration of cement and is well-known as a major precursor to tobermorite formation (Taylor, Reference Taylor1997; Mitsuda et al., Reference Mitsuda, Sasaki and Ishida1992). The integrated intensity from 3.427 to 3.434 nm−1 (no background subtracted) was regarded as the C-S-H intensity in our previous studies (Kikuma et al., Reference Kikuma, Tsunashima, Ishikawa, Matsuno, Ogawa, Matsui and Sato2009, Reference Kikuma, Tsunashima, Ishikawa, Matsuno, Ogawa, Matsui and Sato2010). In the present study this method was used to estimate the quantity of C-S-H.
RESULTS AND DISCUSSION
Phase evolution
Figure 1 shows the time-resolved XRD data set for the sample without Al addition. Several constituents involved in the reaction are clearly observed. The time dependence of the relative peak intensities for each major constituent is plotted in Figures 2a and 2b for samples without Al addition and with 5 mol% Al addition, respectively. The pressure inside the cell was confirmed to be saturated steam pressure in all experiments. The sum of the (211) and (002) intensities for hydroxylellestadite [HE:Ca10(SiO4)3(SO4)3(OH)2], and the sum of the (211) and (220) intensities for katoite [KA:Ca3Al2(SiO4)3−x(OH)4x with x=1.5 to 3.0], a type of hydrogarnet, are plotted to obtain larger peak integrals and better statistics. For tobermorite, the (002) and (220) peaks are separately plotted. All data are normalized based on the XRD measurements of the same sample in our laboratory after in situ XRD.
In these two experiments, monosulfate [MS:Ca4Al2O6(SO4)-14H2O], portlandite [P:Ca(OH)2] were observed at the beginning of the autoclave process, and their intensities decreased as the reactions proceeded. Finally both phases completely disappeared. Quartz initially decreased slowly, and the decreasing rate became slightly faster in the middle stage and then became slower again toward the end. As intermediate phases, KA and HE were observed in the middle of the reactions. In the later stage, HE decreased and disappeared, whereas KA decreased slowly and partly remained. Tobermorite began to be observed after the temperature reached 190°C, at which the intensity of C-S-H was a maximum. Then, tobermorite formation increased toward the end of the autoclave process. Anhydrite (A:CaSO4) began to be observed when HE was a maximum, and then increased gradually until the end. This suggests SO42− ions released from HE are involved in anhydrite formation.

Figure 2. Time dependence of peak intensities for each major constituents during the autoclave process: (a) sample without Al addition and (b) sample with 5 mol% Al addition.
Tobermorite formation via C-S-H and KA
As shown in Figure 2, Al addition accelerated crystallization of tobermorite, especially along the c-axis, i.e., the (002) direction. On the other hand, C-S-H and KA exhibited unique behavior with Al addition. To clarify this point, the relation between C-S-H and tobermorite intensity is plotted in Figure 3 and the relation between KA and tobermorite intensities is plotted in Figure 4. It can be seen in both figures that after temperature reached 190°C, C-S-H and KA (with Al addition) decreased with increasing intensity of tobermorite. This suggests that there are at least two pathways to tobermorite formation, namely, the C-S-H route and the KA route. For the C-S-H behavior shown in Figure 3, the amounts of initial C-S-H (blue arrows) as well as remaining C-S-H (green arrows) were decreased by Al addition. In other words, the C-S-H formation in the initial stage was limited and subsequent tobermorite formation via C-S-H was accelerated by Al addition. Consequently, the main route of tobermorite formation may shift from the C-S-H route to the KA route.

Figure 3. (Color online) Time dependence of C-S-H (3.4 nm−1) and tobermorite (002) intensities for samples without Al addition and with 5 mol% Al addition. Blue arrows correspond to the amount of initial C-S-H and green arrows correspond to the amount of remaining C-S-H.
Change of d-spacing along c-axis of tobermorite
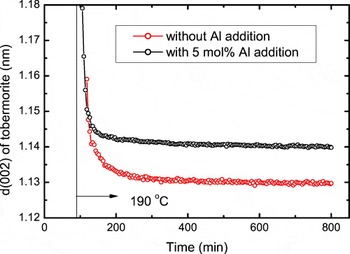
Figure 5 shows time dependence of d-spacing along the c-axis of tobermorite for the samples without Al addition and with 5 mol% Al addition. For the sample without Al addition, the d-spacing decreased drastically in the early stage

Figure 4. (Color online) Time dependence of KA (katoite) and tobermorite (002) intensities for samples without Al addition and with 5 mol% Al addition.

Figure 5. (Color online) Time dependence of d-spacing of tobermorite along the c-axis for samples without Al addition and with 5 mol% Al addition.
and gradually leveled off to a constant value. On the other hand, for the sample with Al addition, decrease of the d-spacing leveled off more quickly. The tobermorite structure consists of Si-tetrahedra chains, Ca–O sheets, and interlayer Ca atoms (Merlino et al., Reference Merlino, Bonaccorsi and Armbruster1999). The behavior of d-spacing shown in Figure 5 can be attributed to the c-axis expansion during the reaction caused by the substitution of Al in Si-tetrahedra for Al containing system. Consequently, Al in Si-tetrahedra may affect the tobermorite crystallization in addition of the reaction routes. The mechanism in detail is still not clear, however, and a microstructure analysis such as NMR study may be helpful.
ACKNOWLEDGMENTS
This study was performed with the approval of JASRI (Proposal Nos. 2008B1864 and 2009B1788). The authors are grateful to Dr. M. Sato and Dr. H. Toyokawa of JASRI for their great help at SPring-8.