Introduction
Oocyte maturation is the last phase of oogenesis and consists of nuclear and cytoplasmic modifications, two interlinked processes that are essential for fertilization and embryo development (Eppig, Reference Eppig1996). Nuclear maturation is underlined by the meiotic process whereas cytoplasmic maturation is characterized by morphological and functional modifications. In almost all known species, immature oocytes are arrested at first meiotic prophase (PI), which is characterized by a large nucleus, the germinal vesicle (GV). PI arrest persists up to the time of hormonal stimulus when meiosis resumes and induces germinal vesicle breakdown (GVBD) leading the oocyte to a second block, which is removed by the spermatozoon at fertilization (Dale, Reference Dale1983; Yanagimachi, Reference Yanagimachi, Knobil and Neill1994; Tosti & Boni, Reference Tosti and Boni2011 for a review).
Cytoplasmic maturation is associated with a considerable increase in oocyte size depending on storage of foodstuffs and informational macromolecules such as mRNAs, proteins and transcription factors. At this time, the growing oocyte undergoes a regional redistribution of cytoplasmic organelles such as mitochondria, ribosomes, endoplasmic reticulum, cortical granules and the Golgi complex. This reorganization is functional to the acquisition of meiotic competence that ultimately will influence the basic properties of the future embryo (Dale & Elder, Reference Dale and Elder1997; Ferreira et al., Reference Ferreira, Vireque, Adona, Meirelles, Ferriani and Navarro2009).
Among the organelles described, a pivotal role is played by the mitochondria due to their function as energy suppliers. In particular, it has been shown that ATP synthesized by mitochondria is crucial for protein synthesis and phosphorylation, which in turn represents a fundamental requirement for progression of oocyte maturation (Stojkovic et al., Reference Stojkovic, Machado, Stojkovic, Zakhartchenko, Hutzler, Goncalves and Wolf2001).
During oogenesis of Drosophila, zebrafish, Xenopus, mouse, pig and human, mitochondria undergo a series of changes in their morphology, quantity and distribution (Tourmente et al., Reference Tourmente, Lecher, Degroote and Renaud1990; Bavister & Squirrell, Reference Bavister and Squirrell2000; Sun et al., Reference Sun, Wu, Lai, Park, Cabot, Cheong, Day, Prather and Schatten2001; Wilding et al., Reference Wilding, Carotenuto, Infante, Dale, Marino, Di Matteo and Campanella2001a; Van Blerkom et al., Reference Van Blerkom, Davis, Mathwig and Alexander2002; Nishi et al., Reference Nishi, Takeshita, Sato and Araki2003; Torner et al., Reference Torner, Brüssow, Alm, Ratky, Pöhland, Tuchscherer and Kanitz2004; Dumollard et al., Reference Dumollard, Duchen and Carroll2007; Zhang et al., Reference Zhang, Ouyang, Hou, Schatten, Chen and Sun2008). Changes in mitochondria structure and size have been also reported during oogenesis in mammals (Wassarman & Josefowicz, Reference Wassarman and Josefowicz1978; Motta et al., Reference Motta, Nottola, Makabe and Heyn2000).
Observations in mammals, sea urchin, Xenopus, fish and C. elegans show that mitochondria undergo a dramatic increase in number due to a replication of mitochondria precursors that starts during the pre-vitellogenic phase of oogenesis and ceases at the end of maturation, with an enormous amplification during vitellogenesis. During maturation, the growing population of mitochondria is relocated to different regions of the oocyte. It seems that the early phases of relocation are similar between species while the final phases are more different, generating the variable patterns of mitochondria distribution observed in mature oocytes (Dumollard et al., Reference Dumollard, Duchen and Sardet2006). In GV stage oocytes of ascidians (Prodon et al., Reference Prodon, Chenevert and Sardet2006), Xenopus (Wilk et al., Reference Wilk, Bilinski, Dougherty and Kloc2005) and mammals (Nishi et al., Reference Nishi, Takeshita, Sato and Araki2003), mitochondria are found surrounding the GV and then migrate from the centre to the periphery of the oocyte after GVBD. The resultant distribution pattern plays an important role in oocyte maturation as inadequately distributed mitochondria can cause an inadequate distribution of ATP throughout the cytoplasm, which subsequently leads to retardation or arrest of oocyte development as well as to subsequent problems with embryogenesis (Nagai et al., Reference Nagai, Mabuchi, Hirata, Shoda, Kasai, Yokota, Shitara, Yonekawa and Hoshi2006).
During oocyte maturation, mitochondria also undergo a significant increase in membrane potential (Δψm) that reflects mitochondria activity (Van Blerkom & Davis, Reference Van Blerkom and Davis2007). More evidence suggests that mitochondria activity may be associated with the developmental potential of oocytes (Quinn et al., Reference Quinn, Warnes, Kerin and Kirby1984; Acton et al., Reference Acton, Jurisicova, Jurisica and Casper2004).
Ascidians are marine invertebrates that are found worldwide and used as model for developmental studies. The Styela plicata differs from the other ascidians in that it lacks a clear reproductive apparatus, hence many of the mechanisms related to its reproductive process are virtually unknown (Satoh, Reference Satoh1994). According to previous authors (Jeffery & Capco, Reference Jeffery and Capco1978), we classified GV immature oocytes at three stages of growth and investigated the activity and distribution pattern of mitochondria reorganization.
Materials and methods
Animals and oocytes
The ascidians Styela plicata were collected in the Gulf of Naples and held in tanks with running seawater at 16°C until use. Animals were anesthetized in ice and the ovary was dissected to collect oocytes with a Pasteur pipette. Oocytes were then transferred to Petri dishes that contained filtered seawater (FSW). Oocytes with an intact GV were selected according to Jeffery & Capco (Reference Jeffery and Capco1978) and differentiated on the basis of oocyte size, cytoplasmic pigmentation and accessory cell morphology.
Confocal microscopy
Oocytes
The three stages of GV oocytes were denuded by removing the chorion chemically using a solution of 0.03% (w/v) protease (Protease E from Streptomyces griseus, Sigma-Aldrich, Milan, Italy) in FSW by gentle pipetting. Oocytes were then washed three times in FSW to remove residual protease. Denuded oocytes were kept in 0.1% agarose-coated Petri dishes to prevent adhesion and lysis of nude oocytes.
Staining of mitochondria with DIOC6
GV nude oocytes were incubated in the dark at room temperature for 10 min with the fluorescent dye 3,3′-dihexyloxacarbocyanine iodide (DIOC6, Molecular Probes, Leiden, The Netherlands), a vital stain for mitochondria, at the final concentration of 5 μg/ml in dimethylsulfoxide (DMSO; Sigma-Aldrich, Milan, Italy). Oocytes were then rinsed in FSW, mounted and observed with an inverted confocal laser-scanning microscope Zeiss LSM 510. After excitation with the 488 nm line of an Argon-ion laser, DIOC6 fluorescence was detected with a green filter (long-pass 515).
Staining of mitochondria with JC-1
The vital mitochondria dye 5,5′,6,6′-tetrachloro-1,1′,3,3′-tetraethylbenzimidazolylcarbocyanine iodide (JC-1; Invitrogen, Milan, Italy) is a tool to investigate mitochondria activity. The dye undergoes a reversible change in fluorescence emission from green to red as mitochondria membrane potential increases. Cells with high membrane potential promote the formation of J-aggregates, which fluoresce red; cells with low potential contain monomeric JC-1 fluoresce green. The red/green ratio is an indicator of the mitochondria potential and is not impacted by mitochondria shape, density or size.
GV oocytes at different stages were incubated with the inner mitochondria membrane potential probe JC-1 at 5 μM, diluted from a 7.7 mM stock solution in DMSO, for 30 min in the dark at room temperature. After staining, oocytes were washed three times in FSW, mounted and observed with inverted confocal laser-scanning microscope Zeiss LSM 510.
The monomer and J-aggregate forms were excited simultaneously by 488 nm Argon laser sources. JC-1 monomers were detected using the green filter (band-pass 500–530); JC-1 dimers, formed on mitochondria membranes with high potential, were detected with a red filter (long-pass 560).
Green and red images were collected simultaneously under similar detect-gains and pinholes and then merged into a new image by confocal microscope at the same time. Red/green fluorescence ratios were calculated from the green and red intensity value pairs detected from entire oocyte in the merged images by using Metamorph software (Universal Imaging, USA) version 7.1.3.0. The mean ± standard deviation (SD) of each group was calculated and analysis of variance (ANOVA) was applied to determine whether there were significant differences among groups. Then pair-wise comparison of means was analysed by the least significant difference (LSD) test. The statistical significance level was set at P < 0.05. An increase in the ratio was interpreted as an increase in Δψm.
Control oocytes were exposed to the mitochondria uncoupler carbonyl cyanide 3-chlorophenylhydrazone (CCCP; Sigma-Aldrich Milan, Italy) for 10 min at the final concentration of 5 μM prior to JC-1 exposure.
Transmission electron microscopy (TEM)
Procedures were carried out at room temperature. The three stages of GV oocytes were fixed after collection in 2.5% glutaraldehyde in FSW, washed three times for 10 min in the same buffer, postfixed in 1% osmium tetroxide in FSW, washed three times for 10 min in the same buffer and dehydrated in an ascending series of ethanol. Oocytes were treated for 15–20 min with propylene oxide, infiltrated in 1:1 propylene oxide/Epon 812 overnight, and embedded in fresh resin. Thin sections were cut on a Leica Ultracut ultramicrotome, collected on 200-mesh thin bar copper grids, stained with 4% uranyl acetate in methanol and 3% lead citrate, observed and photographed with a LEO 912AB Electron Microscope (Zeiss, Göttingen, Germany).
Results
Oocytes classification
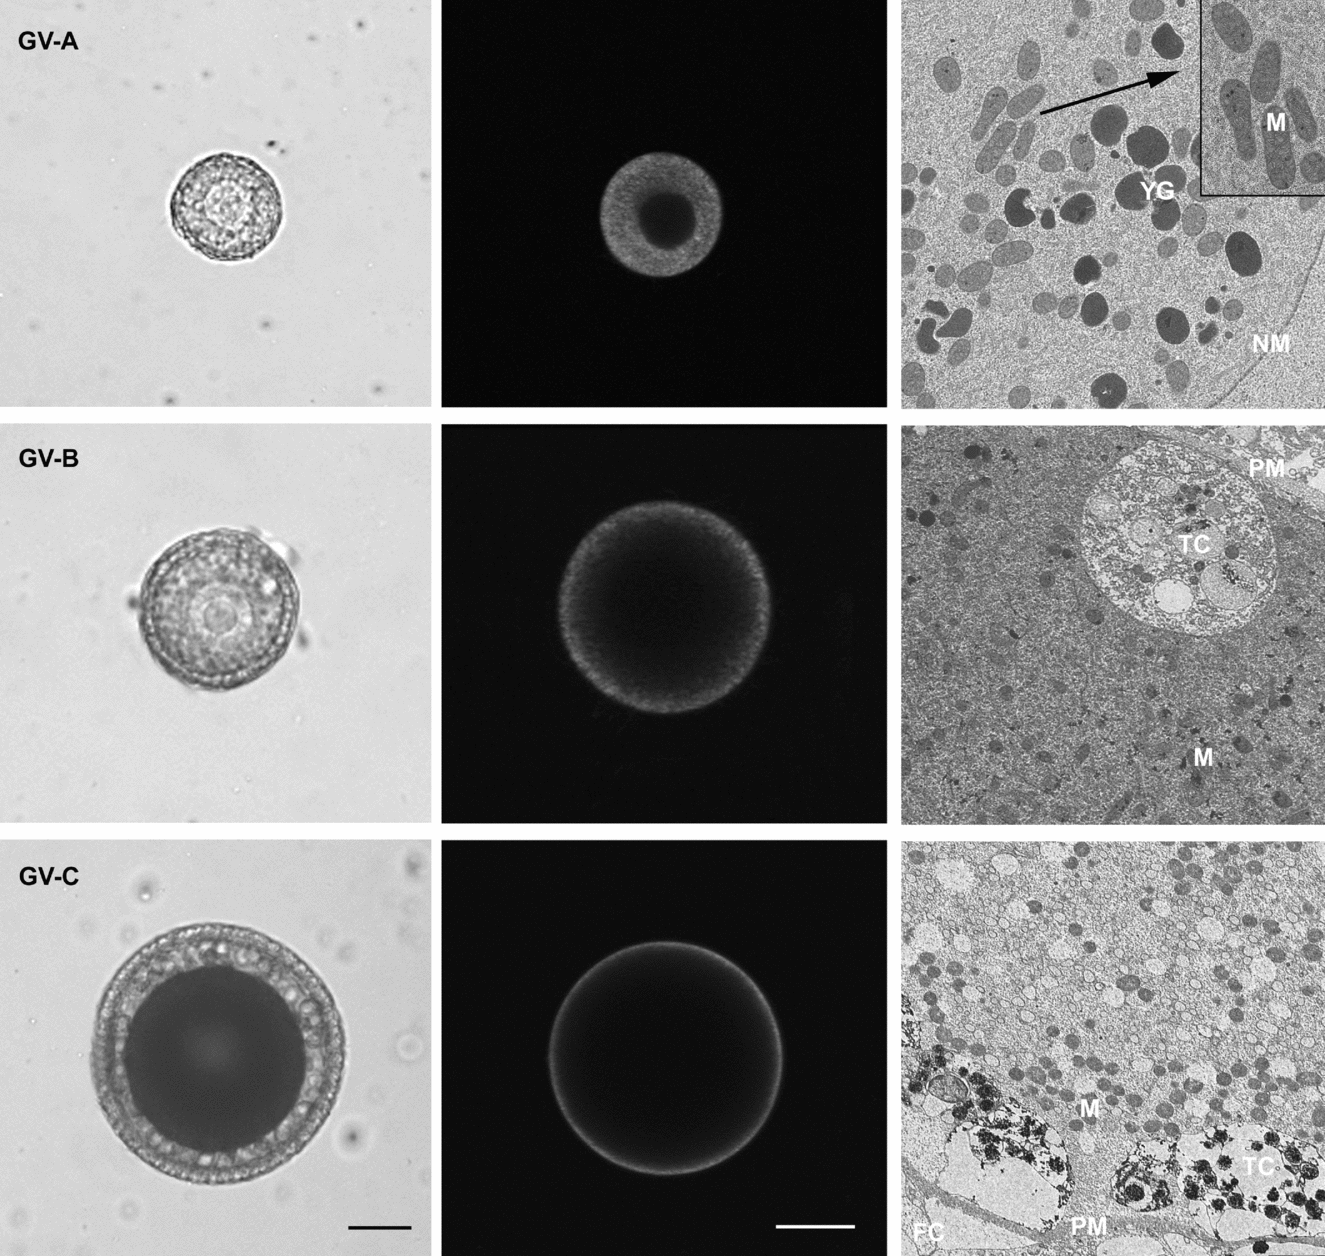
We identified three categories of GV stage oocytes using criteria of oocyte size and pigmentation, and morphology of accessory cells (Fig. 1, left column). The smallest GV stage oocyte, ‘GV-A’ corresponding to pre-vitellogenic stage, is equal or less than 70 μm in diameter, non-pigmented and surrounded by a layer of flat follicle cells. In the middle GV stage oocyte, ‘GV-B’ corresponding to vitellogenic stage, the diameter is 70–140 μm, the cytoplasm is yellow and follicle cells are columnar. The full grown GV stage oocyte, ‘GV-C’ corresponding to post-vitellogenic stage, is equal or more than 140 μm in diameter, shows brown cytoplasm and is surrounded by a layer of columnar follicle cells attached to a vitelline coat, with an innermost adherent layer of test cells.

Figure 1 Mitochondria distribution pattern during oocyte growth of Styela plicata. The left image of each row displays light micrographs of the three oocyte stages: stage A oocytes (GV-A) represents the pre-vitellogenic stage; stage B oocytes (GV-B) represents the vitellogenic stage and stage C oocytes (GV-C) represents the post-vitellogenic stage. In all considered stages a clear germinal vesicle is evident. The middle and right images show, respectively, DIOC6 staining and the electron micrograph related to the stage considered. DIOC6 staining disclosed that mitochondria are: (i) distributed throughout the cytoplasm in GV-A; (ii) absent in the perinuclear region and diffused in cortical cytoplasm in GV-B; and (iii) located exclusively in the subcortical cytoplasm in GV-C. This distribution pattern is confirmed by transmission electron microscopy (TEM) micrographs: the cytoplasm of GV-A oocyte contains yolk granules (YG) and mitochondria (M) homogenously diffused, the latter sometimes appears grouped (insert shows magnification from the dashed rectangle) close to the nuclear membrane (NM). The GV-B stage oocyte shows mitochondria scattered within pericortical cytoplasm identified by the presence of test cells (TC) beneath the plasma membrane (PM). In GV-C, numerous mitochondria are located in the subcortical cytoplasm that also contains test cells. FC = follicle cells. Original magnifications: GV-A ×1500, insert ×4000; GV-B ×2000; GV-C ×800. Scale bars represent 30 μm in GV-A and 50 μm in GV-B and GV-C.
Mitochondria distribution
Confocal analysis
Mitochondria distribution in GV oocyte stages was evaluated with DIOC6 staining (Fig. 1, middle column).
In the smallest stage A oocyte, the mitochondria appear to be spread homogeneously throughout the cytoplasm. In stage B oocyte, the mitochondria located in the inner region start to move throughout the cortical cytoplasm, in fact fluorescence disappears in the perinuclear area. Finally, in the fully grown stage C oocyte, mitochondria are found exclusively at the cell periphery, forming a thick subcortical domain.
TEM
TEM analysis of the three GV stage oocytes was undertaken to correlate stage-specific spatial remodeling of mitochondria with distribution observed in living oocytes after DIOC6 staining. GV-A stage oocytes show numerous dispersed yolk granules (YG) and mitochondria distributed homogeneously in the cytoplasm. In GV-B oocytes, mitochondria are uniformly scattered within the pericortical cytoplasm. In the GV-C stage oocyte mitochondria are grouped in subcortical cytoplasm also marked by the presence of test cells (Fig. 1, right column).
Mitochondria activity
After staining with JC-1, the specific pattern of mitochondria activity was evident during oocyte growth. In GV-A stage oocytes, clusters of high-polarized mitochondria, yellow/orange fluorescence, occurred in the perinuclear region, while low-polarized mitochondria, green fluorescence, occurred throughout the cytoplasm. In GV-B stage oocytes, except for perinuclear region in which mitochondria are absent, low- and high-polarized mitochondria are uniformly diffused throughout the cytoplasm. However, with continued growth, the spatial distribution that characterized low- and high-polarized mitochondria became less distinct; in fact they co-localized in the pericortical region (Fig. 2).
Figure 2 Scanning laser confocal images of germinal vesicle (GV) stage oocytes labelled with JC-1. Orange-red fluorescence indicates high-polarized mitochondria while green fluorescence indicates low-polarized mitochondria. In GV-A stage oocytes, high-polarized mitochondria are grouped in clumps in the perinuclear region and in low-polarized mitochondria are diffused in the cytoplasm. In GV-B stage oocytes, high- and low-polarized mitochondria are scattered within the pericortical cytoplasm, but are co-localized in the subcortical cytoplasm in GV-C stage oocyte.
In order to validate whether the yellow/orange fluorescent mitochondria represented the active state, and green fluorescent mitochondria represented the inactive or low-active state, we used CCCP to uncouple mitochondria oxidative phosphorylation. Preincubation with CCCP abolishes J-aggregate fluorescence in all considered stages, confirming that the JC-1 response in GV stage oocytes is sensitive to changes in membrane potential (image not shown).
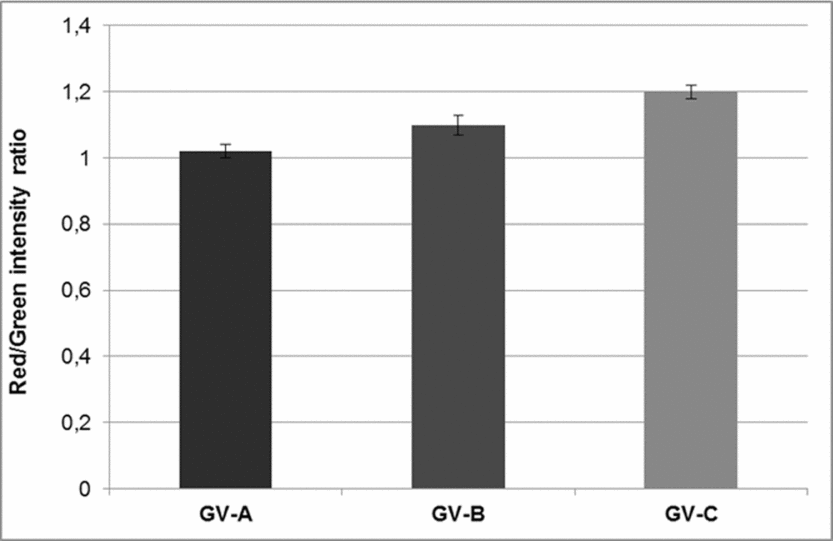
Analysis of red/green ratio revealed a significant increase in mitochondria membrane potential, that reflects mitochondria activity as follows: 1.02 ± 0.02 in GV-A, 1.13 ± 0.03 in GV-B, and 1.24 ± 0.02 in GV-C (n = 13 and P < 0.05 for all the stages considered; Fig. 3).
Figure 3 Mitochondrial activity of GV stage oocytes was assessed by ΔΨm, measured by the ratio between red/green fluorescence of the probe JC-1. Bars indicate the standard deviation (SD) of the mean. A significant (P < 0.05) increase during oocyte growth is observed. GV-A versus GV-B versus GV-C (P < 0.05).
Discussion
Mitochondria are transmitted maternally and originate from a restricted founder population, which is modified during oogenesis. Gradients in the distribution of mitochondria present in the oocytes exert a potential long-term effect on blastomeres receiving different numbers of mitochondria and on embryonic axes formation (Dumollard et al., Reference Dumollard, Duchen and Carroll2007). This is particularly interesting in ascidians as in these species plasm segregation starts immediately after fertilization, giving rise to a polarized zygote (Dale, Reference Dale and Woodhead1989).
In the Styela, we used three clearly different GV oocytes that corresponded to different growth periods and showed a stage-specific spatial distribution and activity of mitochondria. In fact, by using structural and functional approaches, we showed that during oocyte growth, mitochondria are characterized by distinct changes in their distribution pattern, being homogeneously distributed in the cytoplasm at the smallest stage A that changes to a more disperse reorganization and migration at the periphery in stage B, up to a clustering in the subcortical region at the largest stage C.
Furthermore, this pattern correlates with a significant increase during the growth stages of the inner membrane potential, which reflects the mitochondria activity.
Trafficking of cytoplasmic organelles, during maturation, is due to cytoskeletal microfilaments and microtubules and this repositioning depends on the needs of the cell during each stage of development.
Active mitochondria relocate during oocyte maturation or fertilization in several species (Bavister & Squirrell, Reference Bavister and Squirrell2000) and the literature reports that differences of mitochondria localization and functionality have been associated with developmental competence (Wilding et al., Reference Wilding, Dale, Marino, Di Matteo, Alviggi, Pisaturo, Lombardi and De Placido2001b, Reference Wilding, De Placido, De Matteo, Marino, Alviggi and Dale2003; Cummins, Reference Cummins2004; Van Blerkom, Reference Van Blerkom2004; Ferreira et al., Reference Ferreira, Vireque, Adona, Meirelles, Ferriani and Navarro2009). This seems to be attributed also to the mitochondria role in the maintenance of calcium levels in the mature oocyte and in the regulation of calcium transients at fertilization (Dumollard et al., Reference Dumollard, Marangos, Fitzharris, Swann, Duchen and Carroll2004).
In ascidians, fertilization triggers spectacular reorganizations that result in the formation and localization of distinct cytoplasmic domains that are inherited by early blastomeres that develop autonomously. In particular, in Styela, the myoplasm is the cytoplasmic region that originates by a dramatic accumulation of mitochondria at the vegetal pole (Satoh, Reference Satoh1994), supporting the potential role played by mitochondria in directing the spatial orientation of the blastomeres.
In vitro fertilization experiments (Gallo et al., data in preparation) confirmed the findings reported by Jeffery & Capco (Reference Jeffery and Capco1978) that Styela oocytes are fertilized at the largest GV-C stage. Furthermore, we evidenced a specific role of accessory cells in driving the occurrence of fertilization. Therefore, oocytes at this stage represent the ones competent for fertilization and embryo development.
Data here regarding growing immature oocytes support the hypothesis that not only mitochondria are important for oocyte metabolism, but also their different distribution and potential are predictors of functional competence.
The presence of a subcortical region of highly polarized mitochondria in human and murine oocytes and embryos was proposed to be a microzone of differential activities related to the acquisition of developmental competence which may affect the normal occurrence of the fertilization process (Van Blerkom et al., Reference Van Blerkom, Davis, Mathwig and Alexander2002; Van Blerkom, Reference Van Blerkom2008). Furthermore, a recent report suggested that disorders in mitochondria functionality are often related to human ovarian hyperstimulation for in vitro fertilization, exerting a negative impact on further development (Van Blerkom, Reference Van Blerkom2011).
Mitochondria redistribution during oogenesis has been described in the vertebrates (Wilding et al., Reference Wilding, Dale, Marino, Di Matteo, Alviggi, Pisaturo, Lombardi and De Placido2001b; Zhang et al., Reference Zhang, Ouyang, Hou, Schatten, Chen and Sun2008), whereas in ascidians Prodon et al. (Reference Prodon, Chenevert and Sardet2006) related it to animal–vegetal polarity in growing oocytes. In this paper, we have shown a peripheral distribution of inactive mitochondria at the smallest A-stage going to a clustered cortical aggregation and a maximum potential at the largest GV stage that is also the stage ready for fertilization.
Previous studies have demonstrated that an increase in ATP levels is also a necessary step of oocyte maturation (Nagano et al., Reference Nagano, Katagiri and Takahashi2006; Duran et al., Reference Duran, Simsek-Duran, Oehninger, Jones and Castora2011), and oocytes with higher levels of ATP produced significantly higher fertilization and blastocyst rates while oocytes deficient in ATP production had compromised fertilization and early embryo development (Stojkovic et al., Reference Stojkovic, Machado, Stojkovic, Zakhartchenko, Hutzler, Goncalves and Wolf2001; Nagano et al., Reference Nagano, Katagiri and Takahashi2006).
In mouse oocytes, it was reported that mitochondria ATP production and regulation of metabolic activity involved local changes in free calcium, further supporting an interplay between mitochondria and calcium (Dumollard et al., Reference Dumollard, Hammar, Porterfield, Smith, Cibert, Rouvière and Sardet2003, Reference Dumollard, Duchen and Carroll2007).
In the Styela oocytes, we observed a relationship between calcium current activity and growth stages (Gallo et al., data in preparation). This finding may support the idea that mitochondria that accumulate beneath the plasma membrane (the location of ion channels) at the largest stage of oocyte growth may play a role in the modulation of calcium-dependent developmental competence.
Conclusion
In the cell, mitochondria appear to play the double role of life maintenance or cell death commitment (Dumollard et al., Reference Dumollard, Duchen and Carroll2007). This appears to be a sort of quality control system that will determine whether the embryo proceeds further into development or must undergo apoptosis.
Thus, examination of the changes in mitochondria organization may serve as predictors of oocyte or embryo developmental competence providing information on oocyte and embryo quality.
In all the species studied so far, a different aggregation pattern of mitochondria during oocyte maturation has been reported. Our data on Styela oocytes show for the first time a correlation between mitochondria distribution and activity during the oocyte growth process, demonstrating that a highly subcortical polarization of mitochondria and an increased electrical potential may be considered a specific indicator of oocyte competence. Studies on mitochondria aggregation patterns during cytoplasmic maturation may help to understand the physiology of reproduction and provide new insight to improve in vitro maturation techniques in the field of assisted reproduction and cloning embryo technologies.
Acknowledgements
We thank Mr G. Gargiulo and Mr G. Lanzotti for computer graphics; Mr V. Monfrecola for technical assistance; Mr F. Iamunno and Dr A. Graziano for transmission electron microscopy; and Dr P. Cirino and Mr A. Macina for providing and maintaining Styela plicata.