


Planning for a response to threats is a national priority and involves significant efforts to reduce the adverse health effects of public health emergencies, including those caused by pandemic influenza and chemical, biological, radiological and nuclear (CBRN) agents.Reference Altevogt, Stroud and Wizemann 1 Requirements for medical countermeasures in response to threats to the civilian population after exposure to a CBRN event are leveraged through resources and programs from stakeholders across the federal government.Reference Newmark 2 Stockpiling efforts are focused on building reserves of critical countermeasures in support of preparedness to help mitigate the effects of an event or outbreak and/or to meet the increased demands for medical products during emergencies.Reference Birnkrant and Cox 3 Similar efforts have been taken to ensure the availability of vaccine and antiviral products for preparedness for pandemic influenza.Reference Birnkrant and Cox 3
Ensuring the availability of medical countermeasures for public health emergencies is vital for national security. However, planning for a response to events like pandemics or CBRN threats that may disrupt the US blood supply system and create great demands on supply is challenging because such events may be unprecedented. Although pandemics have occurred in the past, the degree of interdependence in our society has changed to an extent that many of the lessons learned from past pandemics may be difficult to apply to our current infrastructure. The volunteer-based blood supply system is particularly vulnerable to the effect of a pandemic as donors may donate less blood because of illness, the need to care for ill family members, or the fear of exposure to influenza. Although it is not possible to project levels of donations in the absence of data, we estimate the impact of transient donor reduction on the blood supply system, and estimates of the amount of blood on hand, under various scenarios.
Similarly, a mass casualty (MC) event may create an unmet need for day-to-day estimates of the current availability of blood and blood components in the US blood supply system. The blood supply system is vulnerable to threats to the health and security of donors. Data collection is critical to help evaluate the safety and effectiveness of medical countermeasures but it may be very challenging in the midst of an emergency. A computer-based model of the US blood supply system may support public health by assisting in the development of sound regulatory policy and strategic planning for emergency preparedness to help mitigate morbidity and mortality associated with insufficient availability of blood. We propose here an inter-regional US blood supply model as an extension of our Stock-and-Flow computer-based simulation model of the US blood supply system.Reference Simonetti, Forshee, Anderson and Walderhaug 4 One of the major advantages of developing an inter-regional blood transfer system is to enable modeling of events that may disrupt the US blood supply system at a regional level and study this impact on national supply levels. The inter-regional model can capture specific dynamics of demand for blood generated from 1 region supplementing stocks to other regions with a means of addressing potential shortages during both normal operations and emergency situations.
The new model expands the number of “stocks” to reflect the many regional blood banks and hospital end-users of blood units and allow simulation of inter-regional blood transfers in a scalable fashion to better reflect how geographic and temporal effects may impact the blood supply distribution. The inter-regional model simulates the daily availability of blood for national emergencies. The model may be used to support the mission of the Food and Drug Administration’s Medical Countermeasures Initiative (MCMi) 5 in protecting national health and security by ensuring the availability of essential blood products that may be needed to counter a public health emergency, including a pandemic of influenza or a MC event.
We explored scenarios in order to advance critical public health needs in the circumstance of such unpredictable events. We simulated a pandemic and a MC scenario to enable effective strategies for emergency preparedness and management of blood to minimize collection and donation disruptions to the blood supply system. We evaluated the impact of inter-regional transfers of blood on supply in order to explore the ability of the modeled system to meet emergency demands. By examining the impact of these scenarios, decision-makers may help mitigate suffering and death associated with insufficient availability of blood units by making informed decisions in a timely fashion to assess whether the supply is adequate and how resilient the system may be during normal operations or in emergency situations.
METHODS
From a National to an Inter-regional US Blood Supply Model
The Stock-and-Flow simulation model of the US blood supply system developed by Simonetti et alReference Simonetti, Forshee, Anderson and Walderhaug 4 provides national quantitative daily estimates of the amount of red blood cell (RBC) units available in the system by employing 2 hypothetical stocks representative of the US aggregate of blood collectors and blood distributors, respectively. We extended the functionalities of the national blood supply system to simulate an inter-regional blood system by dividing the US into 4 regions, as defined by America’s Blood Centers 6 (ABC): East, Midwest, South, and West (Figure 1). Figure 1 illustrates the percentages of RBC units donated (collected) and the percentages of those transfused to each of the 4 regions.
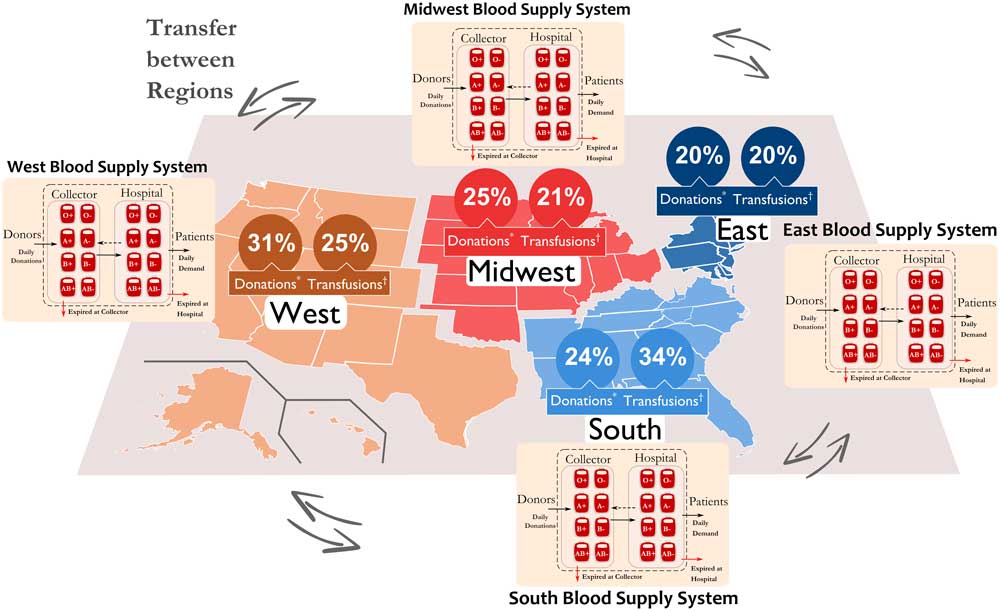
Figure 1 Inter-regional US blood supply system and regional subdivisions2 reporting associated percentages of blood donations and transfusions from the America’s Blood Centers (ABC)6 and from the Centers for Medicare and Medicaid Services (CMS) databases7,8, respectively.
Each region was modeled exactly as the national blood system,Reference Simonetti, Forshee, Anderson and Walderhaug 4 and operated independently to fulfill the internal daily blood demand before blood transfers were allowed to supply any blood deficiency in any of the other regions.Reference Simonetti, Forshee, Anderson and Walderhaug 4 If any region required more units to maintain its inventory levels, transfers of blood from other regions were used to supply that deficiency. Transfers of blood from the collector to the hospital and to the recipient occurred according to phenotype compatibility rulesReference Simonetti, Forshee, Anderson and Walderhaug 4 and were optimized using a Neural Network Heuristic (NNH). The NNH was used to enhance the overall performance of the inter-regional network by minimizing expired blood and the unmet demand (ie, shortages) of blood, and hence increasing the availability of blood units.
Regional Blood Collection and Utilization data
Regional data on blood collections and utilizations were obtained from ABC’s stoplight report 6 and the inpatient billing information from the Centers for Medicare and Medicaid (CMS), 7 respectively. We obtained the daily percent of annual RBC collections from ABC for several US blood centers and for different years (2001-2010).Reference Simonetti, Forshee, Anderson and Walderhaug 4 Similarly, we calculated the regional daily percent of annual RBC units transfused from the CMS database for the calendar years 2007-2012. 8
Regional predictions of the daily supply and demand were derived from information described above and in combination with the most up-to-date estimates reported in the 2011 National Blood Collection and Utilization Survey (NBCUS) report 9 to reflect the latest national estimates. The model then estimated the daily amount of RBC units available in the system for the overall blood and by ABO/Rh type (results by blood type not shown).
Simulating a Scenario for Pandemic Influenza
Pandemic influenza is a particular example of an event that poses a threat to public health and the US blood supply system. During a pandemic, blood collections may decrease significantly because of many regular donors being ill or because of the burden of caring for ill members of the family and/or community. This may reduce US blood supply levels and possibly cause a shortage of blood. We simulated the potential impact of a pandemic influenza-like event on the blood supply levels consequent to inter-regional spatial and temporal variation of pandemic trends in the US.Reference Kamp, Heiden, Henseler and Seitz 10 In our analysis, we used the Pandemic A(H1N1)pdm09 data and 2 measures of the influenza activity from the surveillance data of the Centers for Disease Control and Prevention: (1) the weekly influenza-like illness (ILI), based on reported cases by the US Outpatient Influenza-like Illness Surveillance Network (ILINet) 11 ; and (2) the weekly ILI activity levels reported by the States. 12
Figure 2A,B illustrate the reported cases of ILI from the USA for 2008-2011 and for weeks 34-50 for the 2009 H1N1 pandemic, respectively. The thematic maps for the ILI activity levels aggregated by the 4 regions are shown in Figure 2C. Figure 2D,E illustrate the assumptions used to model the changes (reduction and recovery time) in the baseline donation levels (ie, normal operations) to simulate a pandemic scenario applied to (Figure 2D) a national blood system, and (Figure 2E) an inter-regional blood system. We used a step function to perturb the steady-state level of the national blood system using a 5% and a 7% weekly reduction and recovery time in blood donations, respectively. 13 Similarly, we used a shifted version of the same step function to perturb the inter-regional blood supply levels to reflect spatial and temporal variation of pandemic influenza in the 4 different regions. We confirmed the regional effect for pandemic influenza using a linear mixed model (results not shown). We set the start of our simulated pandemic-like event to weeks 34 (South), 36 (West and Midwest), and 37 (East).
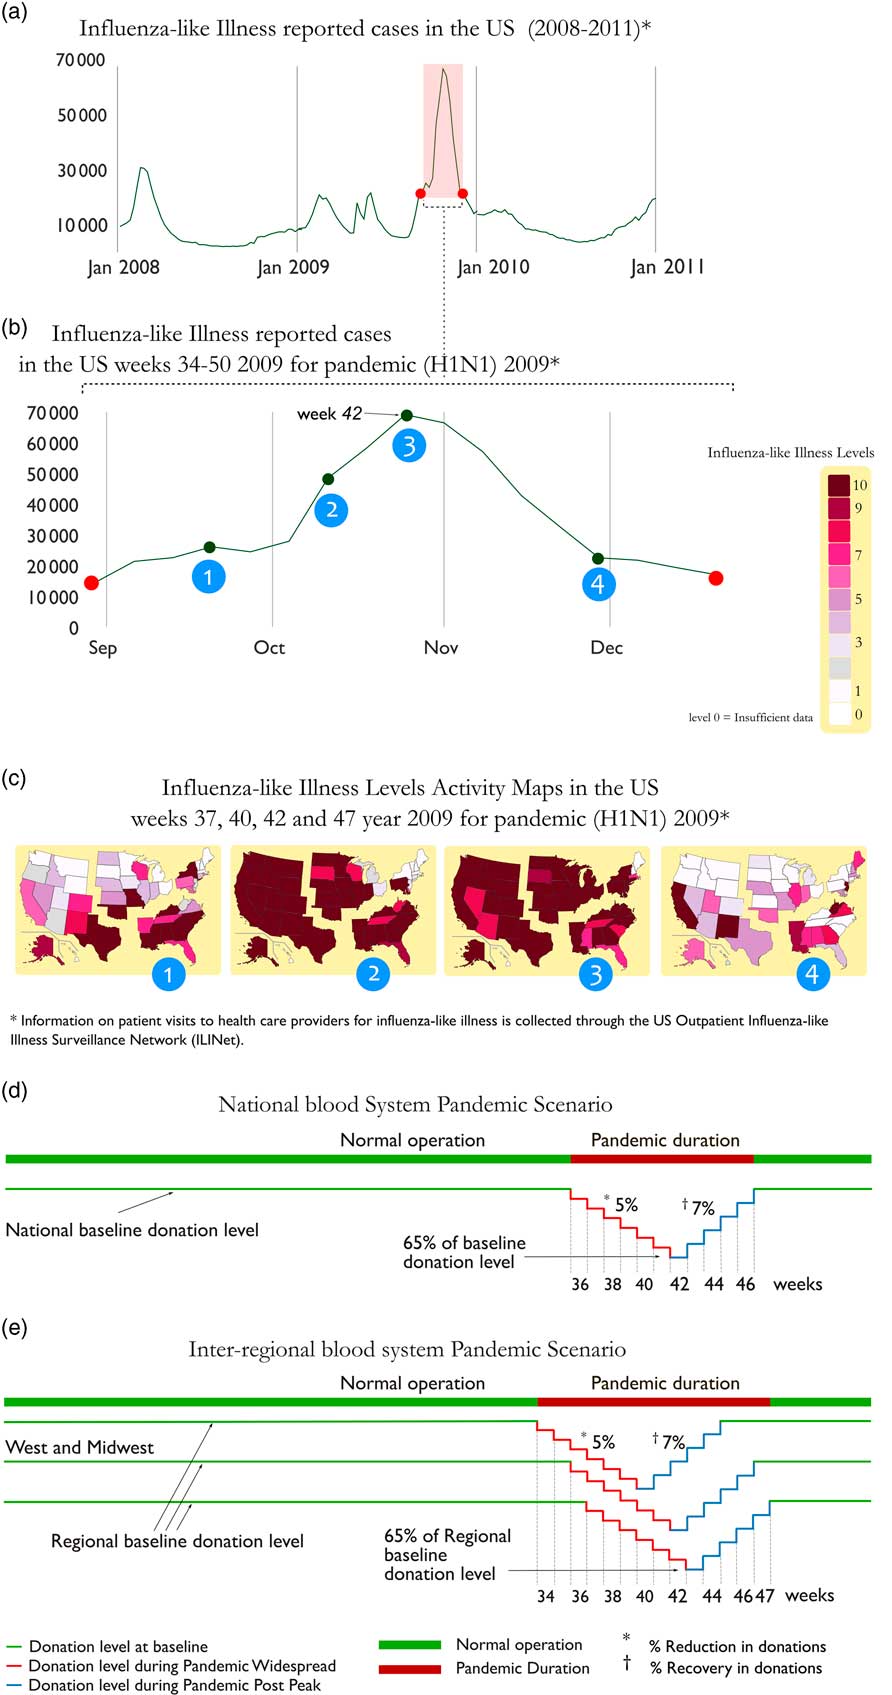
Figure 2 CDC Influenza surveillance data for (a) reported cases of influenza like-illness (ILI)12 for the USA for 2008-2011, (b) reported cases of ILI for weeks 34-50 for 2009, and (c) thematic maps of the ILI activity levels in each US state11 aggregated by region. Illustration of model assumptions for baseline versus pandemic-like donation levels for (d) a national blood system and (e) an inter-regional blood system.
Simulating Scenarios for a MC event
We also explored the impact of a MC event on the US inter-regional blood supply levels. In order to simulate a MC scenario, we refer to a nuclear detonation from an improvised nuclear device (IND). This specific type of MC scenario is listed as one of the possible threats to the United States by the National Planning Scenarios, a federal interagency community that has developed a minimum number of credible scenarios to establish a range of response requirements to facilitate preparedness planning. 14 The volunteer-based US blood supply system is particularly vulnerable to the effect of a MC event on blood availability; however, acquiring important data to help evaluate the resilience of the system can be very challenging as such events are likely unprecedented. We learned from the literatureReference Knebel, Coleman and Cliffer 15 , Reference DiCarlo, Maher and Hick 16 that the estimated number of casualties due to this type of event is highly dependent on location, weather conditions, and height of the explosion (air or ground). Casualties from an IND occurring in an urban area present with 3 main types of injuries: (1) trauma due to a collapsed building or flying objects from the blast, (2) burns due to released thermal energy or fires erupting after the blast, and (3) radiation injuries due to direct exposure to the ionizing radiation from the blast or from exposure to the fallout carrying the fission products.Reference DiCarlo, Maher and Hick 16 Casualties can also present with combined injuries of radiation exposure with either trauma or burns, or both.
Knebel et alReference Knebel, Coleman and Cliffer 15 and DiCarlo et alReference DiCarlo, Maher and Hick 16 provide estimates on the expected casualties from each type of injury listed above. In our simulation, we selected the estimated casualties for an IND event as reported by Knebel et al,Reference Knebel, Coleman and Cliffer 15 for the composite height of explosion for the 50th percentile (mid-range estimate scenario, or MC1) and 95th percentile (high-consequence scenario, or MC2) (Table 1, columns 3 and 5) to derive the daily demand of RBC units that would be needed for transfusing potential casualties from trauma, burns, and radiation injuries if a MC should occur (Table 1, columns 4 and 6). In the next section, we describe how we derived our assumptions and estimated the demand of RBC units for each type of injury considered based on the estimated casualties described in Table 1.
Table 1 Distribution of Casualties from Nuclear Detonation Modeling by Knebel et al 11 (Columns 3 and 5) for the 50th (MC1) and 95th (MC2) Percentiles for Composite Height of Explosion and Corresponding Estimated Demand of Red Blood Cell (RBC) Units for Transfusing Casualties by Injury Type and Category (Columns 4 and 6)

a Number of casualties from Knebel et al. 11
b We excluded the injuries from the mild trauma category because are not an indication of transfusion. 13
c Blood units needed for casualties with moderate trauma=5 (units)×no. of casulties×8%, where 8% is the percentage of patients admitted to a trauma center with transfusion-indicated injuries. 7
d Blood units needed for casualties with severe trauma=10 (units)×no. of casulties×8%.
e We excluded the injuries from burns because burn injuries per se are not an indication for transfusion.Reference Sugarman, Goans, Garrett and Livingston 18
f We excluded the mild and expectant categories because the exposure for the first category does not result in hematopoietic syndrome, whereas transfusion is not an indicated treatment protocol for the latter category. 14 , Reference Knebel, Coleman and Cliffer 15
g Blood units needed for casualties with moderate radiation injury=5 (units)×PD40−PD1×no. of casualties, where PD40 and PD1 are the percentages of the casualties with hemoglobin <8 g/dL on day 40 and day 1, respectively.
h Blood units needed for casualties with severe radiation injury=15 (units)×no. of casualties.
i Blood units needed for casualties with severe radiation injury=5 (units)×no. of casualties×8%.
On the basis of the total estimated RBC units calculated in Table 1, we estimated the daily blood demand that we used in the simulation of the 2 independent MC scenarios (MC1 and MC2) to assess their impact on the inter-regional US blood supply levels compared with the baseline. Because of variations in blood donation and utilization patterns among the different regions, we simulated MC1 and MC2 by considering 2 different impacted regions: (a) East, which is the region with the lowest percentage of blood collection and utilization (MC1E and MC2E); and (b) South, which is the region with the highest percentage of blood utilization (MC1S and MC2S). In Table 2, we reported modeling assumptions on changes in blood supply and demand for both our simulated MC scenarios.
Table 2 Modeling Assumptions on Changes in Donations/Collections and Blood Demand for the Mass Casualty (MC) Scenarios as Applied to the Inter-regional Blood Supply System

Abbreviations: RBC, red blood cell.
a Same assumption for MC1E and MC1S.
b Same assumption for MC2E and MC2S.
c The additional RBC units for day 1 and day 2 are of blood Group O.Reference Napolitano, Kurek and Luchette 21 , Reference Thurer, Katz, Parce, Precopio and Popovsky 22
d Decrease in demand due to cancellation of elective surgeries in impacted regions in the East: MC1E and MC2E.
e Decrease in demand due to cancellation of elective surgeries in impacted regions in the South: MC1S and MC2S.
f Loss of inventory due to damage as a result of the MC event.
Deriving the Demand of RBC Units by Type of Injury Consequent to a IND Event
Trauma
Knebel et alReference Knebel, Coleman and Cliffer 15 classify trauma casualties into 3 categories according to the Injury Severity Score (ISS): mild (ISS 1-9), moderate (ISS 10-14) and severe (ISS>15) (Table 1). Here, only the moderate and severe cases are considered as an indication for potential transfusion. However, not all the moderate and severe trauma patients may require blood transfusion.Reference Como, Dutton, Scalea, Edelman and Hess 17 We refined our assumption on the demand of RBC for this category according to an observational study in a level 1 trauma center by Como et al,Reference Como, Dutton, Scalea, Edelman and Hess 17 in which only 8% of the patients admitted receive RBC transfusions.Reference Como, Dutton, Scalea, Edelman and Hess 17 Also, as suggested by the study, acute trauma patients with an average ISS of 18 receive between 1 and 10 units.Reference Como, Dutton, Scalea, Edelman and Hess 17 Consequently, in our simulation we assumed 5 units of RBC per casualty in the moderate trauma categoryReference Como, Dutton, Scalea, Edelman and Hess 17 and 10 RBC units for those in the severe categoryReference Como, Dutton, Scalea, Edelman and Hess 17 (see Table S1 in the online data supplement).
Radiation Injuries
Casualties with radiation exposure of Gy <1.5 are not considered to be in need of blood.Reference Sugarman, Goans, Garrett and Livingston 18 The level of radiation exposure in the moderate category (Table 1) is sufficient to damage the bone marrowReference Sugarman, Goans, Garrett and Livingston 18 ; however, with appropriate care (ie, hematopoietic growth factors) the patients’ autologous recovery is likely. In order to estimate how many RBC units per casualty would be needed to compensate for the loss of RBC count due to senescence, we estimated the percentage of casualties that would require a transfusion based on 2 different hemoglobin threshold levels: 8 and 10 g/dL.Reference Fliedner, Friesecke and Beyrer 19 We first used NHANES 2011-2012 Lab data 20 to derive the distribution of hemoglobin levels in the US population. We then assumed that the hemoglobin levels among casualties would be normally distributed with a mean of 13.5 g/dL and standard deviation of 1.48, as reflected in the US population levels (see Figure S1 in the online data supplement). Figure S1a shows the corresponding cumulative probability function of hemoglobin at days 1, 25, and 40 after the MC event, which depicts that 0, 2.5%, and 21% would be the estimated percentage of casualties that would require a transfusion, if found with hemoglobin level <8 g/dLReference Fliedner, Friesecke and Beyrer 19 ; whereas 1%, 28%, and 71% were those that would require a transfusion if their hemoglobin threshold for transfusion would be <10 g/dL. Figure S1b illustrates the percentage of casualties that would be considered for transfusion with hemoglobin levels 8 g/dL (red solid curve) and 10 g/dL (blue solid curve) from days 1 to day 40 after the MC event. As there are no specific recommendations for hemoglobin transfusion threshold for radiation injury patients in the clinical practice guidelines,Reference Napolitano, Kurek and Luchette 21 in our simulation we accounted only for casualties that would show hemoglobin levels <8 g/dLReference Fliedner, Friesecke and Beyrer 19 and we assumed that 5 RBC units per casualty would be needed to compensate for the loss of RBC count.Reference Fliedner, Friesecke and Beyrer 19 , Reference Thurer, Katz, Parce, Precopio and Popovsky 22 Casualties in the severe exposure category would likely suffer irreversible damage to hematopoietic stem cells. As suggested from the literature,Reference McCullough 23 we assumed a demand of 15 RBC units per casualty that would be needed for transfusion during each hypothetical hematopoietic stem cell transplantation after an MC event. On the basis of these assumptions, we calculated the overall daily demand of RBC units for radiation injuries as the sum of the demand derived for each of the 3 categories considered.
Burn Injuries
As suggested from the literature, a burn injury per se is not an indication for RBC transfusion,Reference Kamp, Heiden, Henseler and Seitz 10 but for a total burn surface area>20% and hemoglobin <10 g/dL, 2 packs of RBCs are recommended.Reference Rice and Orgill 24 However, the number of casualties with hemoglobin <10 g/dL is nearly 0 at the onset of the MC event (Figure S1b), therefore, we assumed no additional RBC units to be needed for the burn injury casualties.
In Table 2 we report the overall estimated additional demand for RBC units, which was calculated using Table S1 and added to the baseline demand of the impacted region to model the onset of the event for both MC1 and MC2 scenarios. Table S1 shows the additional daily demand of RBC units that would be used for transfusion from day 1 to day 40 after the MC event that was derived on the basis of the estimated casualties by Knebel et al.Reference Knebel, Coleman and Cliffer 15
Adjustment of Demand of RBC Units by Cancellation of Elective Surgeries Consequent to a MC Event
In Table 2 we also report the decrease in blood demand for 1 week because of the cancellation of elective surgeries in the impacted region. According to NBCUS 2011, blood transfused in elective surgeries constitutes 50% of the national blood transfused. We adjusted the regional distribution of blood utilization for elective surgeries by using the 2012 Dartmouth Atlas series of reports, which look at elective surgical rates in 306 hospital referral regions (corresponding to 3436 hospitals) across the US among the Medicare elderly beneficiaries.Reference Brownlee, Barry, Fisher, Bynum and Goodman 25 We used 7 out of the 11 reported surgical rates, and excluded the sex-specific procedures (eg, mastectomy and prostatectomy, because of the lack of data on male-to-female ratio in the database), and those procedures that would not require blood transfusion.Reference Brownlee, Barry, Fisher, Bynum and Goodman 25 Using these surgical rates and the number of Medicare beneficiaries, we calculated the surgical rates by US state (Figure S2a) and then we aggregated the rates by region (Figure S2b). By comparing regional rates with national rates, we estimated the percentage of blood utilized in each region (44% East, 46% Midwest, 52% South, and 55% West). In our simulation, we assumed 44% for East and 52% for South in order to decrease the demand of elective surgeries for 1 week in the 2 impacted regions.
RESULTS
Simulation Results for Pandemic Influenza Scenario
We simulated a national and an inter-regional blood system during normal operations (baseline) and during a pandemic-like scenario mimicking the 2009 H1N1 pandemic influenza. The annual average daily number (AAD) of RBC units for the total supply (collector+hospital) available in the US was calculated to reflect the impact of a pandemic-like scenario on national and inter-regional blood supply levels as opposed to baseline. For the national system the AAD number of RBC units reduced by 12.4% (from 965,375 to 1,101,495) from the baseline (Figure 3A), whereas for the inter-regional system, we observed a reduction of 14.3% (from 928,220 to 795,558) from the baseline (Figure 3B). Figure 3 also shows more RBC units lost by the end of the pandemic-like event, with 541,000 units lost in Figure 3B compared with 535,000 units lost in Figure 3A. The South and the East regions have the highest (15%) and lowest (13.8%) percent reduction in the AAD of total supply compared with baseline, respectively.
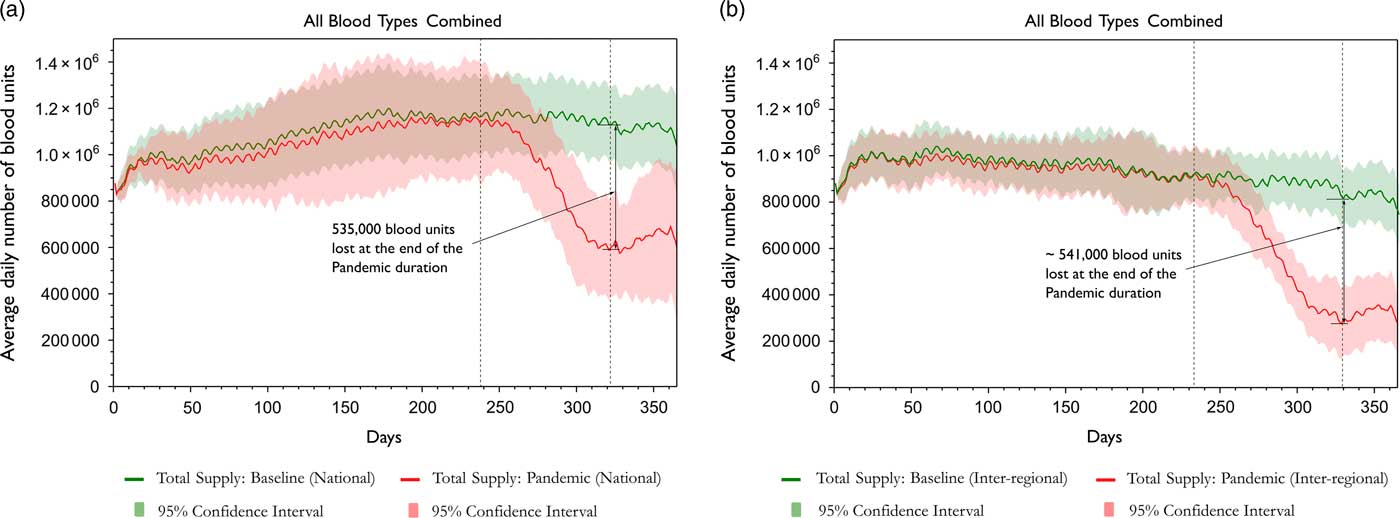
Figure 3 The annual average daily number of blood units for baseline (normal operations) and pandemic-like scenarios applied to (a) national blood system, and (b) an inter-regional blood system.
Simulation Results for a MC Event
The impact of a MC event on the US blood system depends on many factors as mentioned above. We simulated 2 independent MC scenarios: MC1 (50th percentile mid-range estimate scenario) and MC2 (95th percentile high-consequence scenario). Figure 4 shows the AAD number of RBC units available in the total supply when either the East (MC1E and MC2E) or the South (MC1S and MC2S) is the impacted region. Notice that despite the same additional number of units assumed for both scenarios, in the high-consequence scenario (MC2E), we observed a rapid capacity for the East (impacted region, solid red line) to recover to the baseline levels (dashed red line), as opposed to what was observed for the South when impacted (MC2S). This can be explained by the increase in blood transfers contributed from the non-impacted regions to the East in MC2E (last column in Figure S3b, 173 daily average units) compared with the South in MC2S (first column in Figure S3d, 102 daily average units). We also observed that the higher the expiration of RBCs, the higher the reduction of available RBCs in supply (Figure S4). The South is a higher collector region compared with the East; consequently, the estimated blood supply levels in the South are higher than in the East.
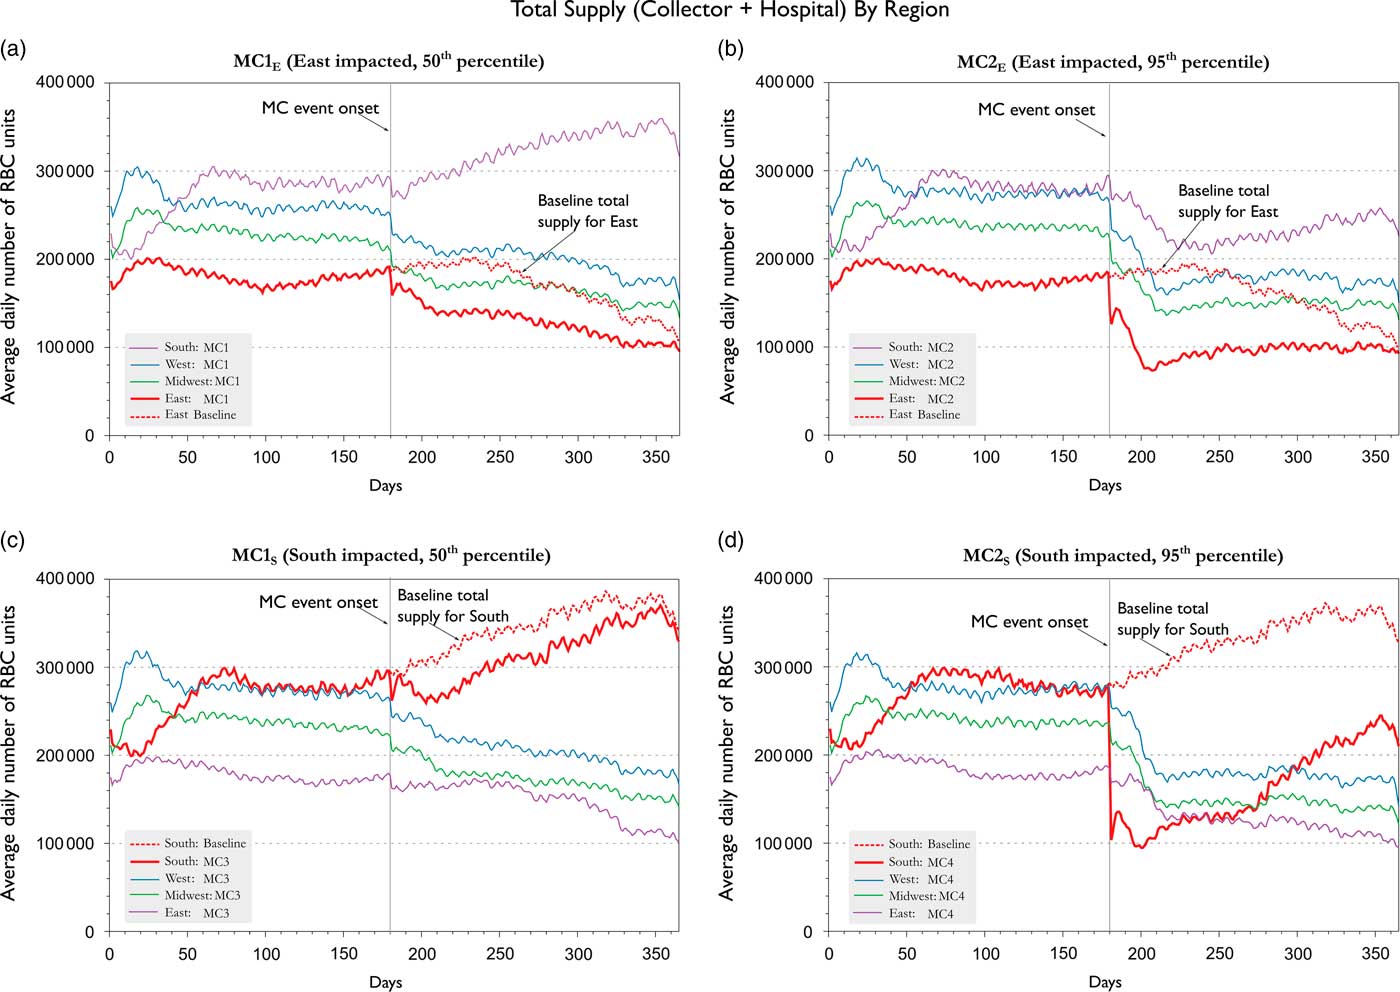
Figure 4 Average daily number of RBC units in total supply (collector + hospital) for scenarios MC1E and MC1S (50% percentile), MC2E and MC2S (95% percentile). The impacted regions (E or S) are represented with a solid red line in all figures, while the baseline for the impacted region, if event would not have occurred, is projected for reference with a dashed red line.
DISCUSSION
In this study, we expanded the utility of the US blood supply modelReference Simonetti, Forshee, Anderson and Walderhaug 4 to explore the impact of unpredictable events—that is, pandemic influenza and MC events. For the pandemic, we observed differences in the results between the national and inter-regional blood systems, which demonstrate the importance of accounting for spatial and temporal variations in blood collection and utilization across all US regions. Consideration of these complex dynamics may be relevant to provide more accurate estimates of blood available in the system by capturing the variability among the different regions that may have been overlooked by simply considering an estimate based on the national blood system. It is worth noting that no shortages were observed in both systems.
For the MC event simulation, we based our assumptions on the 50th (mid-range) and 95th percentile (high-consequence) estimates for casualties by type of injuryReference Knebel, Coleman and Cliffer 15 to provide a sensitivity analysis for our estimates, while accounting for the uncertainty associated with a wide range of factors that may impact the aftermath of an IND (eg, location of impact, population density, infrastructure, weather condition, etc.). More uncertainty arises from the difference in transfusion practices, in which a conservative approach sets the hemoglobin threshold for transfusion at 8 g/dL compared with 10 g/dL for casualties exposed to radiation. In a time of crisis, the conservative approach seems more appropriate; as it requires less blood demand. Nevertheless, setting the transfusion threshold for hemoglobin at 10 g/dL would have resulted in a higher demand of 327,000 additional units over a period of 40 days. Such a high demand might not be fulfilled with the current availability of blood estimated by the inter-regional US blood system. Although the choice of impacted regions in our simulation represent the highest (South) and lowest (East) total utilization of blood for transfusion across the US, the variation in the collection and utilization of blood for elective surgeries among regions affects the ability of each region, as well as the overall blood system, to recover from a MC event, would it ever occur in any US region.
Data from historical disasters or events could provide valuable insights for modeling assumptions—for example, the Nagasaki and Hiroshima nuclear bombs during World War II (WWII) are the closest incident to an IND MC event. However, the state of Japan’s economy during that time prevents us from drawing a constructive analogy between the 2 situations. Further, these events resulted in more qualitative reports, which documented how only few patients received blood transfusions in the first few days in the aftermath.Reference Flynn and Goans 27 Therefore, such reports do not provide specific data that we could use as a proxy in our simulations.
Some data limitations affect the model; the percentages of collection and utilization among the regions is limited to the contribution of ABC and CMS, which, however, still account for more than 50% of the national collection and utilization, respectively.
It is important to mention that no shortage of blood units was observed from the 2 emergency scenarios presented. This demonstrates the resilience of the inter-regional US blood system, up to a certain extent, to fulfill the blood demand in case similar events in level of magnitude should occur. This could be explained by the rapid capacity of the system to contribute units of blood from 1 region to another, as well to the central role played by the optimized blood transfer system.
CONCLUSIONS
In conclusion, we present an inter-regional model of the US blood supply system, which was developed to enable effective planning of strategies to minimize collection and donation disruptions to the blood supply in case of national emergencies—that is, pandemic or MC events. We provide an estimate of the amount of blood available for emergency use and evaluate the impact of challenges to the US blood supply system. To our knowledge, our findings represent the first attempt to estimate the amount of blood that would be available to the US blood system during potential national emergencies. The model has the advantage to be easily customized to explore various “what-if” scenarios. The predictions provided by our model are essential in assisting decision-makers and stakeholders reach informed decisions for emergency planning or crisis management.
Acknowledgments
The authors gratefully acknowledge the contribution of Paul D. Mintz (FDA/CBER/OBRR) for his insightful inputs on transfusion medicine in case of emergencies and of Mikhail Menis (FDA/CBER/OBE) for having provided CMS data. The authors also thank Timothy Lant (US DHHS/ASPR/BARDA), Kenneth D. Cliffer (US DHHS/ASPR/BARDA), and Brian Custer (BSRI) for their useful comments and insightful feedback during the July 24, 2012 FDA Workshop on the “Use of Computer Simulation of the United states Blood Supply in Support of Planning for Emergency Preparedness and Medical Countermeasures.”
This research was supported in the form of grant no. Z01 BS 03005-03 OBE from MCMi funding.
This project was supported in part by the Research Participation Program at the Center for Biologics Evaluation and Research administered by the Oak Ridge Institute for Science and Education through an interagency agreement between the US Department of Energy and the US Food and Drug Administration (HE).
“For access to this software, please contact the FDA Technology Transfer Program at FDAInventionLicensing@fda.hhs.gov.”
Conflicts of Interest
The authors declare that they have no conflicts of interest relevant to the manuscript.
Supplementary material
To view supplementary material for this article, please visit https://doi.org/10.1017/dmp.2017.48


