


INTRODUCTION
Approximately 2.8 PBq of anthropogenic 14C was released from nuclear facilities worldwide from the 1950s (UNSCEAR 2000), produced mainly by neutron activation reactions such as 14N (n, p) 14C, 17O (n, α) 14C, and 13C (n, γ) 14C in nuclear fuel, fuel cladding, water coolant, and graphite moderators. 14C is the main contributor to the collective effective dose commitment from globally dispersed radionuclides from nuclear facilities, due to its long half-life of 5730 years and ready uptake into the global carbon cycle (UNSCEAR 2000). Investigations of 14C discharges from nuclear facilities are essential in assessing the radiological impact of anthropogenic 14C on the population.
The Fukushima Dai-ichi Nuclear Power Plant (FDNPP) contained six boiling water reactors (BWR) and commenced full operation between 1971 and 1979, with a total generation capacity of 460−1100 MWe until March 2011 (IAEA 2018). In a BWR, 14C is produced mainly by neutron activation of 14N and 17O in the fuel and water coolant (Yim and Caron Reference Yim and Caron2006), and it is expected that about 53 TBq of 14C was released from the FDNPP during routine operation (Xu et al. Reference Xu, Cook, Cresswell, Dunbar, Freeman, Hastie, Hou, Jacobsson, Naysmith, Sanderson, Tripney and Yamaguchi2016a). There have been previous studies of the environmental impacts of 14C released from routine operation of the FDNPP (Xu et al. Reference Xu, Cook, Cresswell, Dunbar, Freeman, Hastie, Hou, Jacobsson, Naysmith, Sanderson, Tripney and Yamaguchi2016a, Reference Xu, Cook, Cresswell, Dunbar, Freeman, Hou, Jacobsson, Kinch, Naysmith, Sanderson and Tripney2016b) and Tokai NPP (Matsunaka et al. Reference Matsunaka, Sasa, Takahashi, Hosoya, Matsumura, Satou, Shen and Sueki2019a) in Japan. A resulting collective effective dose of up to 2.0−3.9 µSv yr−1 has been estimated from an excess (above background) tree-ring 14C activity of up to 36−70 Bq kg−1 C (Xu et al. Reference Xu, Cook, Cresswell, Dunbar, Freeman, Hastie, Hou, Jacobsson, Naysmith, Sanderson, Tripney and Yamaguchi2016a; Matsunaka et al. Reference Matsunaka, Sasa, Takahashi, Hosoya, Matsumura, Satou, Shen and Sueki2019a).
The FDNPP accident on 11 March 2011 resulted in a significant release of volatile fission products and activation products, including 131I and 134, 137Cs. Total releases to the atmosphere during the main release periods of 15−16 and 20−25 March were estimated to be 120–160 PBq of 131I and 9–37 PBq 137Cs (Chino et al. Reference Chino, Nakayama, Nagai, Terada, Katata and Yamazawa2011; Katata et al. Reference Katata, Ota, Terada, Chino and Nagai2012; Stohl et al. Reference Stohl, Seibert, Wotawa, Arnold, Burkhart, Eckhardt, Tapia, Vargas and Yasunari2012; Terada et al. Reference Terada, Katata, Chino and Naga2012). The 14C discharge amount during the FDNPP accident is under study (Steinhauser Reference Steinhauser2014; Xu et al. Reference Xu, Cook, Cresswell, Dunbar, Freeman, Hou, Jacobsson, Kinch, Naysmith, Sanderson and Tripney2016b; Povinec et al. Reference Povinec, Liong Wee Kwong, Kaizer, Molnár, Nies, Palcsu, Papp, Pham and Jean-Baptiste2017). The highly contaminated area northwest of the accident site, within ~35 km of the FDNPP, remains a restricted area with an annual dose commitment exceeding 50 mSv (Figure 1; MEXT 2011).
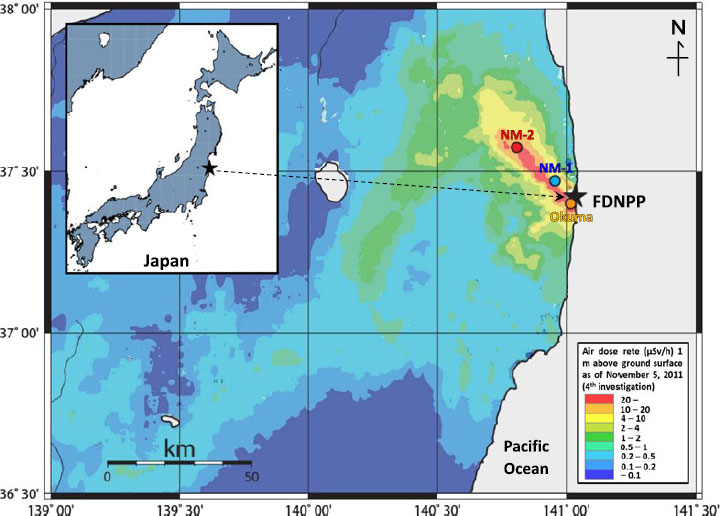
Figure 1 Sample sites near the FDNPP and the distribution of air dose rates (MEXT 2011). Tree-ring cores were collected from a Japanese cypress at site NM-1, 9 km northwest of the FDNPP, and a cedar tree at site NM-2, 24 km northwest of the FDNPP. (Please see electronic version for color figures.)
The 14C released during the accident contributed 42 Bq 14C kg−1 C to 14C tree-ring activity within ~2.5 km northwest of the reactors (Xu et al. Reference Xu, Cook, Cresswell, Dunbar, Freeman, Hou, Jacobsson, Kinch, Naysmith, Sanderson and Tripney2016b). In comparison, the Chernobyl nuclear accident of 1986 released ~44 TBq 14C, and up to 282 Bq kg−1 C of excess 14C was found in tree rings within ~30 km of the reactor (Buzinny et al. Reference Buzinny, Likhtarev, Los, Talerko and Tsigankov1998).
Little information is available regarding the environmental behavior of 14C released from the FDNPP or the affected area. An understanding of the behavior and environmental impact of 14C in the restricted area of Fukushima is important for assessing the radiological hazard via food ingestion and radioactive contamination of the terrestrial biosphere.
Aims of the present study were to estimate the effect of routine 14C discharges from the FDNPP and the accidental 14C release within the Fukushima restricted area through a study of 14C preserved in tree rings growing through the 2008–2014 period. The study thus included routine operations of the FDNPP, the accidental release in March 2011, and the post-shutdown period after the accident. Particular attention was given to estimating the effective dose commitment to the local population via the food ingestion pathway, as inferred from 14C preserved in tree rings.
MATERIALS AND METHODS
Study Area and Tree-Ring Sampling
The sampling sites, NM-1 (140°57'21''E, 37°28'35.4''N, 22 m in elevation) and NM-2 (140°49'37.8''E, 37°33'39.6''N, 324 m in elevation) in Namie, Fukushima Prefecture, are located 9 and 24 km northwest of the FDNPP, respectively (Figure 1). The mean annual precipitation and temperature during 2008–2014 at Namie Meteorological Station (140°57'54''E, 37°29'30''N), ~10 km northwest of the FDNPP, were ~1540 mm and ~12.7°C, respectively (JMA 2018). The wind direction at Namie is mainly dominated by the westerlies, the southeast summer monsoon from the Pacific Ocean, and the northwest winter monsoon from the Asian landmass as shown in the wind rose diagrams within April–September (most frequent wind direction: 10.2% ESE and 9.8% SSE) and October–March (most frequent wind direction: 15.3% WNW and 13.4% W) (Figure 2, JMA 2018).

Figure 2 Wind rose diagrams during 2008–2010 within (A) the tree growth period (April–September) and (B) the other period (October–March) from the Namie Meteorological Station (JMA 2018).
Tree rings were sampled, including the epidermis, using an increment borer (inner diameter 1.2 cm, length 45 cm) from a Japanese cypress (Chamaecyparis obtusa) at site NM-1 and Japanese cedar (Cryptomeria japonica) at site NM-2, in June 2014. In Japan, these trees usually grow during spring–autumn (April–September). The cores were dried in a vacuum freeze drier, and annual rings during 2008−2014 were separated using a cutter knife. In the case of the NM-2 sample, early and late wood in the rings representing the years 2010−2012 were cut separately. Dendrochronology was performed on two cores from each tree to confirm that no rings were missing.
Pretreatment and 14C Analysis
Graphite was prepared from alpha cellulose extracted from the separated rings, epidermis, and leaf as follows. Samples were cleaned ultrasonically with ultrapure water and ethyl alcohol, acid–alkali–acid (HCl-NaOH-HCl) treatments, sodium chlorite (NaCl2O/HCl) treatment, alkali (NaOH) treatment, and a neutralization. Dust particles attached to the surface of the samples are removed by the ultrasonic cleaning. Some minor components can be removed by the acid–alkali–acid treatments, and hemicellulose is removed by the alkali treatment after sodium chlorite treatment. Lignin dissolves in the hot NaCl2O/HCl solution. Extracted alpha cellulose samples corresponding to ~1 mg C were combusted to CO2 and purified in vacuum lines using an automatic sample preparation system coupled with an elemental analyzer at the University of Tsukuba following the method of Matsunaka et al. (Reference Matsunaka, Sasa, Hosoya, Hongtao, Takahashi, Matsumura and Sueki2019b). Purified CO2 was graphitized by hydrogen reduction over an iron catalyst. 14C/12C and 13C/12C ratios of the graphite samples were determined by accelerator mass spectrometry (AMS) at the University of Tokyo following the method of Matsuzaki et al. (Reference Matsuzaki, Nakano, Tsuchiya, Ito, Morita, Kusuno, Miyake, Honda, Bautista, Kawamoto and Tokuyama2015), with a terminal voltage of 4.8 MV and detection of 14C4+ at 24 MeV by a solid-state detector. Six standard samples were analyzed in each batch for quality control and calibration purposes: three of NIST SRM4990C (HOx-II), and one of each of IAEA-C1, IAEA-C6 (ANU source), and IAEA-C8. The measurement error of the system was ±5.0‰ for NIST SRM4990C, and system and procedure background levels were <0.08 pMC (percent Modern Carbon) for IAEA-C1. Concentrations of 14C in tree rings are expressed as F14C (Fraction Modern), which is age-corrected for the period between the growth year and the 14C measurement year and isotopic-fractionation-corrected value with on-line AMS-measured δ13C, calculated according to the method of Reimer et al. (Reference Reimer, Brown and Reimer2004). The 14C activity and excess 14C activity were calculated as follows:
 $$^{{\rm{14}}}{\rm{C\ activity }}\ \left( {{\rm{Bq\ k}}{{\rm{g}}^{ - 1}}\;{\rm{C}}} \right) = 226 \times {{\rm{F}}^{14}}{\rm{C}}$$
 $${\rm{Excess}}\;^{14}{\rm{C\ activity }}\ \left( {{\rm{Bq\ k}}{{\rm{g}}^{- 1}}\;{\rm{C}}} \right)= \;^{14}\!\!{\rm{C\ activity }} - \,^{14}{\rm{C\ background}}$$
Calculation of Effective Dose
The effective dose of 14C to the local population from the FDNPP via the food ingestion pathway was calculated by the method of IAEA (2001), based on the following assumptions (Killough and Rohwer Reference Killough and Rohwer1978): (a) ingestion of carbon originating from the atmosphere is the primary mode (via food products) of exposure, with all other pathways contributing <1% of the total dose; (b) the released 14C is associated with CO2 and subsequently fixed in plant tissues by photosynthesis; (c) organic molecules thus formed are transported together with 12C through food chains into the human body. The model assumes isotopic equilibrium, and the specific activity in foods and total dietary C are related as follows:
 $${\rm{D}} = {\rm{A}} \times {\rm{f}} \times {\rm{g}}$$
where D is the effective dose rate (Sv yr−1), A is the specific activity in food products (Bq g−1 C), f is the fraction of total dietary carbon from local food sources (taken to be 1), and g is the effective dose rate factor (Sv yr−1 per Bq g−1 C). The dose rate factor recommended for health screening is 5.6 × 10⁻⁵ Sv yr−1 per Bq g−1 C, assuming an annual intake of dietary carbon of 1.1 × 10⁵ g (Killough and Rohwer Reference Killough and Rohwer1978).
RESULTS AND DISCUSSION
Effect of FDNPP Operation on 14C in Tree Rings
The FDNPP supplied 82–207 TWh (9.4–23.6 GWa) of total electrical energy during its operational life, with average annual outputs of 2.2−6.5 TWh (0.25−0.74 GWa) (IAEA 2018). Graven and Gruber (Reference Graven and Gruber2011) estimated 14CO2 emission factors of 0.51 TBq per GWa for a BWR, with corresponding annual FDNPP 14C discharges during 2008–2011 being shown in Figure 3A. The total 14C discharged from the FDNPP during the period January 2008 to March 2011 is estimated to be 5.5 TBq, or ~10% of the total discharged during the FDNPP operational life. The total annual 14C discharge was maintained at 1.7−1.9 TBq during 2008–2010, dropping to 0.2 TBq in 2011 after shutdown (Figure 3A).
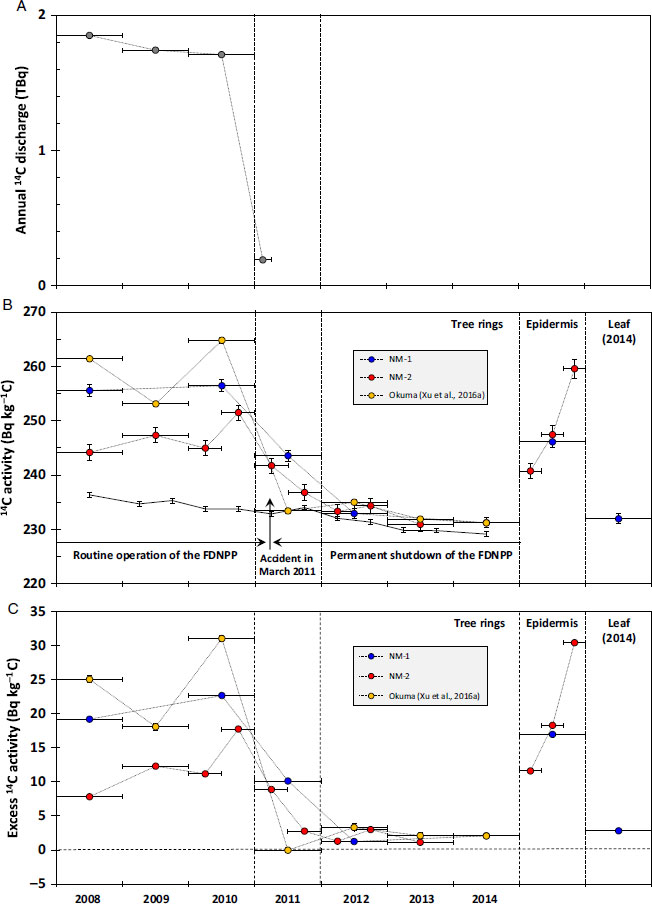
Figure 3 (A) Estimated annual 14C discharge from the FDNPP (gray circles). (B) Background 14C concentrations from Iwaki in Fukushima (Xu et al. Reference Xu, Cook, Cresswell, Dunbar, Freeman, Hastie, Hou, Jacobsson, Naysmith and Sanderson2015) (black line), and variations in 14C activity preserved in the tree rings at sites NM-1 (blue circles), NM-2 (red circles), and Okuma (yellow circles; Xu et al. Reference Xu, Cook, Cresswell, Dunbar, Freeman, Hastie, Hou, Jacobsson, Naysmith, Sanderson, Tripney and Yamaguchi2016a). Operational, accident, and shutdown conditions are indicated. (C) Temporal variations in excess 14C activity preserved in the tree rings sampled at sites NM-1 (blue circles), NM-2 (red circles), and Okuma (yellow circles; Xu et al. Reference Xu, Cook, Cresswell, Dunbar, Freeman, Hastie, Hou, Jacobsson, Naysmith, Sanderson, Tripney and Yamaguchi2016a). (Please see electronic version for color figures.)
Results of 14C analyses and 14C excess calculations for tree rings from the Fukushima restricted area in Namie, and calculated annual effective doses due to excess 14C activity, are given in Table 1 for the period 2008–2014, which included routine FDNPP operation, the accident period in March 2011, and the post-accident shutdown period. These results are compared with the background 14C activities in tree rings from Iwaki which are located ca. 50 km southwest of the FDNPP in Fukushima (Xu et al. Reference Xu, Cook, Cresswell, Dunbar, Freeman, Hastie, Hou, Jacobsson, Naysmith and Sanderson2015) and earlier data for 14C in tree rings sampled ~1 km southwest of the FDNPP (Okuma; Xu et al. Reference Xu, Cook, Cresswell, Dunbar, Freeman, Hastie, Hou, Jacobsson, Naysmith, Sanderson, Tripney and Yamaguchi2016a) in Figure 3B. Trends in excess tree ring 14C activity are indicated in Figure 3C in comparison with earlier data (Xu et al. Reference Xu, Cook, Cresswell, Dunbar, Freeman, Hastie, Hou, Jacobsson, Naysmith, Sanderson, Tripney and Yamaguchi2016a).
Table 1 Fraction modern, sample activity, background activity, and excess 14C activity recorded in the tree rings at sites NM-1 and NM-2.

a The 14C background is from Iwaki in Fukushima during 2009–2013 (Xu et al. Reference Xu, Cook, Cresswell, Dunbar, Freeman, Hastie, Hou, Jacobsson, Naysmith and Sanderson2015). The data points of 2008 and 2014 are extrapolated from the exponential fitting of 14C activity data in period 2009–2013.
b The annual effective dose was calculated from the excess 14C activity following formula (3) in the text.
n.a.: not analyzed
14C activities in the tree rings formed during the period 2008–2014 were in the ranges 231–256 and 231–252 Bq kg−1 C with excess activities of 1.2–23 and 1.1–18 Bq kg−1 C at sites NM-1 and NM-2, respectively. Moreover, 14C activities in the epidermis and leaves were 241–260 and 232 Bq kg−1 C (excess activities: 12–30 and 2.8 Bq kg−1 C), respectively. During 2008–2010, 14C activities were significantly higher than background levels with excess activities of 7.8–23 Bq kg−1 C, while activities recorded in 2012–2014 were close to background levels with excess activities of 1.1–3.0 Bq kg−1 C. The period 2008–2010 corresponds to normal FDNPP operations, so the elevated tree-ring 14C activities clearly indicate the uptake of routinely discharged 14CO2 from the FDNPP. In contrast, the near background level of 14C activity after 2012 indicates a response to the permanent FDNPP shutdown. The relatively small amount of excess activities of 1.1–3.0 Bq kg−1 C during 2012–2014 are due to an additional local fossil-fuel contribution from expressway to the 14C background activities in Iwaki (Xu et al. Reference Xu, Cook, Cresswell, Dunbar, Freeman, Hastie, Hou, Jacobsson, Naysmith and Sanderson2015).
Excess activities during 2008–2011 were in the ranges of 10–23 Bq kg−1 C at site NM-1, 2.8–18 Bq kg−1 C at site NM-2, and 0–31 Bq kg−1 C at the Okuma site (Xu et al. Reference Xu, Cook, Cresswell, Dunbar, Freeman, Hastie, Hou, Jacobsson, Naysmith, Sanderson, Tripney and Yamaguchi2016a). The decreasing trend after shutdown is obvious with decreasing of 14C discharge (Figure 3A and 3C). Xu et al. (Reference Xu, Cook, Cresswell, Dunbar, Freeman, Hastie, Hou, Jacobsson, Naysmith, Sanderson, Tripney and Yamaguchi2016a) found that the excess 14C activity of up to 36 Bq kg−1 C preserved in annual tree rings at the Okuma site was positively correlated with annual energy generation during the FDNPP operational life. Matsunaka et al. (Reference Matsunaka, Sasa, Takahashi, Hosoya, Matsumura, Satou, Shen and Sueki2019a) reported decreasing trends in excess 14C during 1997–1998 and 2010–2011 at a site 1.8 km southwest of the Tokai NPP, corresponding to shutdowns in 1998 and 2011, indicating the responsiveness of tree-ring data to NPP operations. For the FDNPP, the mean excess 14C activities for the period 2008–2010 before the accident were 25 Bq kg−1 C at 1 km southwest site (Okuma; Xu et al. Reference Xu, Cook, Cresswell, Dunbar, Freeman, Hastie, Hou, Jacobsson, Naysmith, Sanderson, Tripney and Yamaguchi2016a), 21 Bq kg−1 C at 9 km northwest site (NM-1), and 12 Bq kg−1 C at 24 km northwest site (NM-2). The linear decreasing trend of the mean excess 14C activities is obvious with increasing distance from the FDNPP with coefficient of determination (R2) of 0.998 and decline ratio of 0.545 Bq kg−1 C per km (Figure 4). During the tree growth period (April–September) of 2008–2010, the prevailing wind directions were ESE (10.2%) and SSE (9.8%), and frequency of NE wind was 6.8% at Namie (Figure 2A, JMA 2018), so the sites NM-1 and NM-2, and Okuma were located downwind of FDNPP at the wind from ESE and SSE, and NE, respectively. Therefore, dilution effect of the atmospheric effluents from the FDNPP is not difference in the northwest and southwest directions during 2008–2010 at these sites, and the range of influence of discharged 14C was extending at least to site NM-2, 24 km northwest of the FDNPP.
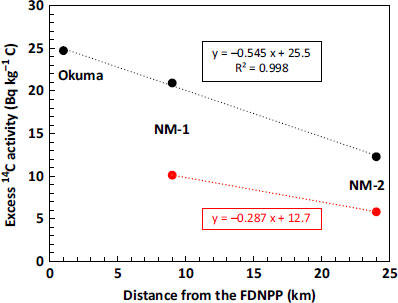
Figure 4 Distributions of the excess 14C activity in the tree rings 2008–2010 (black circles) and 2011 (red circles) at sites NM-1 and NM-2 with Okuma (Xu et al. Reference Xu, Cook, Cresswell, Dunbar, Freeman, Hou, Jacobsson, Kinch, Naysmith, Sanderson and Tripney2016b). The linear regression line and coefficient of determination (R2) are shown.
In the Namie area (NM-1 and NM-2 sites), the excess tree-ring 14C activity of up to 23 Bq kg−1 C during 2008–2010 corresponds to an annual effective dose commitment of <1.3 µSv yr−1 via the food ingestion pathway (Table 1), which is less than the maximum effective dose of 1.7 µSv yr−1 in the Okuma site estimated from an excess 14C activity of 30 Bq kg−1 C found in tree rings there during the same period (Xu et al. Reference Xu, Cook, Cresswell, Dunbar, Freeman, Hastie, Hou, Jacobsson, Naysmith, Sanderson, Tripney and Yamaguchi2016a). Moreover, the relatively high excess 14C activity in the epidermis with 12–30 Bq kg−1 C at sites NM-1 and NM-2 corresponds to 1.2–1.7 µSv yr−1. These values are negligible compared with the average worldwide natural background radiation dose of 2.4 mSv yr−1 (UNSCEAR 2000).
14C Release from the FDNPP Accident
14C activities preserved in the 2011 tree rings at sites NM-1 and NM-2 were in the range 237–244 Bq kg−1 C (Table 1), with mean excess activities of 10 and 5.8 Bq kg−1 C, respectively (Figure 2C); and 8.9 Bq and 2.8 Bq kg−1 C for early and late rings, respectively, at site NM-2. These 14C data are for the alpha cellulose fraction, which excludes mobile organic compounds within the tree rings. No excess 14C activity was found in the 2011 ring from the Okuma site (Xu et al. Reference Xu, Cook, Cresswell, Dunbar, Freeman, Hastie, Hou, Jacobsson, Naysmith, Sanderson, Tripney and Yamaguchi2016a). Elevated 14C activities in the 2011 rings at sites NM-1 and NM-2 were thus not due to translocation of mobile organic compounds from 2010 rings with relatively high 14C activities. Possible sources for the elevated 14C activities in the 2011 rings were therefore either routine FDNPP 14C discharges from 1 January to 11 March, or 14C released during the FDNPP accident in March.
Meteorological data indicate that the most frequent wind direction and mean temperature during the period January–March 2011 (at Namie), were from the WNW (16.7%) and ~1.8°C, respectively (JMA 2018). The NM-1 and NM-2 sites were thus located windward of the FDNPP during this period. Furthermore, photosynthetic activity in the trees was then lower due to the relatively low temperature. Therefore, the capture of 14C by photosynthesis prior to 11 March 2011 was likely to be limited at sites NM-1 and NM-2.
Radioactive plumes were released from the FDNPP mainly in the northwest and southwest directions during 15−16 and 20−25 March, respectively (JAEA 2011), resulting in significant radioactive contamination northwest of the site within ~35 km (Figure 1). Sites NM-1 and NM-2 sites were located downwind of FDNPP during the emission of both plumes. The mean temperature in late March (Namie) was ~6.4°C (JMA 2018), so photosynthetic activity would have been higher than during January–March. The annual excess 14C activity in the 2011 ring at site NM-2 was 5.8 Bq kg−1 C, or about one-half of that at site NM-1 (10 Bq kg−1 C). A previous study found that the accidental 14C release was detected as an annual excess 14C activity of 3.0−24 Bq kg−1 C in the 2011 rings collected within 2.5−14 km northwest of the FDNPP (Xu et al. Reference Xu, Cook, Cresswell, Dunbar, Freeman, Hou, Jacobsson, Kinch, Naysmith, Sanderson and Tripney2016b). Therefore, the decreasing 14C activities in the 2011 tree rings at sites NM-1 and NM-2 with increasing distance (decline ratio of 0.287 Bq kg−1 C per km, Figure 4) indicate that the rings did indeed record 14C released by the FDNPP accident, with the excess 14C activities (5.8−10 Bq kg−1 C). These values were lower than those found in 1986 tree rings within 30 km of the Chernobyl NPP (5.2−282 Bq kg−1 C; Buzinny et al. Reference Buzinny, Likhtarev, Los, Talerko and Tsigankov1998).
CONCLUSIONS
Assessment of environmental impact of 14C discharged from the FDNPP during routine operation (2008–2011), during the accident of March 2011, and during post-accident (2012–2014) within the Fukushima restricted area were carried out. A total of 5.5 TBq of 14C was released during the pre-accident period of 2008–2011. 14C activity preserved in tree rings during 2008–2010 near the FDNPP was 7.8–23 Bq kg−1 C, higher than background values. The area of influence of 14C discharged during normal operations extended at least 24 km northwest of the FDNPP. An effective dose commitment via food ingestion of up to 1.3 µSv was estimated from the excess activity of <23 Bq kg−1 C. The mean excess 14C activity in the 2011 ring at 24 km northwest of the FDNPP was 5.8 Bq kg−1 C, or about one-half of that at 9 km northwest (10 Bq kg−1 C). The decrease in 14C activities in 2011 rings with increasing distance from the FDNPP confirms that the possible impact of the FDNPP accident on 14C levels in trees.
ACKNOWLEDGMENTS
We appreciate the technical assistance with the 14C measurements provided by staff of the University of Tokyo. We are grateful to Katsuhiko Kimura of Fukushima University and Masataka Hakozaki of the National Museum of Japan History for the advice regarding dendrochronology. This work was supported by Grants-in-Aid for Scientific Research of Japan Society for the Promotion of Science (Grant numbers JP15H02340 and JP16K16347) and Environmental Radioactivity Research Network Center (No. F-19-12).


