


Introduction
The McMurdo Dry Valleys are the largest ice-free region in Antarctica, and are characterized by an unusually cold and dry climate (Keys Reference Keys1980, Bromley Reference Bromley1985, Clow et al. Reference Clow, McKay, Simmons and Wharton1988, Doran et al. Reference Doran, McKay, Clow, Dana, Fountain, Nylen and Lyons2002). The summer period, defined as December, January and February (Doran et al. Reference Doran, McKay, Clow, Dana, Fountain, Nylen and Lyons2002), is the most interesting time in terms of the biological and physical processes in the valleys. The summer air temperatures are still low but occasionally rise above freezing, thereby enhancing the potential for hydrological and biological activity. The ice-covered lakes on the valley floors are maintained by the production of meltwater when air temperatures are above freezing. The flow of meltwater has been shown to be primarily the result of degree-days above freezing (Wharton et al. Reference Wharton, McKay, Clow, Andersen, Simmons and Love1992, Doran et al. Reference Doran, McKay, Fountain, Nylen, McKnight, Jaros and Barrett2008). At higher elevations during the summer, growth of cryptoendolithic organisms occurs in the sandstone, which is warmed by sunlight to temperatures up to 15ºC above the air temperature (Friedmann Reference Friedmann1982, Friedmann et al. Reference Friedmann, Kappen, Meyer and Nienow1993). Snowmelt provides a source of moisture on the warming surfaces (Friedmann et al. Reference Friedmann, Kappen, Meyer and Nienow1993, Sun Reference Sun2013). In addition to important effects on hydrological and biological activity, distributed air temperature estimates are useful for resolving distributed surface energy balances and modelling sub-surface soil habitat temperatures. For these reasons, it is of considerable interest to be able to accurately predict the summer air temperatures at sites in the Dry Valleys.
Doran and colleagues (Doran et al. Reference Doran, McKay, Clow, Dana, Fountain, Nylen and Lyons2002, Reference Doran, McKay, Fountain, Nylen, McKnight, Jaros and Barrett2008) have defined three quantitative relationships that can be used to predict summer air temperatures in the Dry Valleys of Antarctica. These rules are: i) the air temperature drops off with altitude at a dry lapse rate of 9.8ºC km-1, ii) at a given elevation, the air temperature increases with distance from the coast at a rate of 0.09°C km-1, and iii) the logarithm of the degree-days above freezing during the summer months is proportional to the maximum summer air temperature. These rules are useful for predicting summer climate conditions at locations that do not have meteorological stations. Because the summer is the most active period of hydrological, biological and erosional activity the ability to estimate the summer climate at arbitrary locations in the Dry Valleys is of considerable utility.
The first of these rules, the lapse rate, follows directly from physical principles and the fact that during the summer the atmosphere in the valleys is well-mixed and the air has a low relative humidity with essentially no release of latent heat. For well-mixed dry air the temperature will follow an adiabatic lapse rate of 9.8°C km-1 (Peixoto & Oort Reference Peixoto and Oort1992). Clearly, this rule is not new to the analysis of Doran et al. (Reference Doran, McKay, Clow, Dana, Fountain, Nylen and Lyons2002).
The second and third Doran rules are empirical and may be specific to the Dry Valleys. They have been anticipated by previous work in the Dry Valleys, but not clearly and quantitatively stated as has been done by Doran et al. (Reference Doran, McKay, Clow, Dana, Fountain, Nylen and Lyons2002, Reference Doran, McKay, Fountain, Nylen, McKnight, Jaros and Barrett2008). This paper will focus on testing the first and second rules at high elevation sites (sites for which the third rule does not apply because air temperatures do not rise above freezing).
The second Doran rule is an empirically derived rule based on correlating temperatures at different sites at the same time. Doran et al. (Reference Doran, McKay, Clow, Dana, Fountain, Nylen and Lyons2002) reported that the temperature difference between sites correlated with the difference in the shortest direct distance from the coast to each site. The dependence was linear with a slope of 0.09°C km-1. The fit was best when the distance was considered as the shortest distance from the coast rather than the distance along the valley, although the trend was still the same with the latter. Doran et al. (Reference Doran, McKay, Clow, Dana, Fountain, Nylen and Lyons2002) attributed the inland warming effect to the coastal winds, which warm as they move over the dark surface.
The east–west gradient in summer temperatures in the Dry Valleys was first noted by Bull (Reference Bull1966) and discussed by Keys (Reference Keys1980) who suggested that both the effect of coastal winds and solar heating were involved. Doran et al. (Reference Doran, McKay, Clow, Dana, Fountain, Nylen and Lyons2002) were the first to attempt to quantify the relationship and proposed an expression for the predicted mean summer temperature (Tp) as a function of altitude (Z) and distance from the coast (D), with the lapse rate rounded to 10ºC km-1, as:
 $${\rm Tp}=(0.0{\rm 9D}{\hbox-}{\rm Tc})-{\rm 1}0\,{\rm Z},$$
where Tc is the air temperature at sea level at the coast. Or if the summer temperature is predicted from an observation of air temperature at another location (m) then:
 $${\rm Tp}={\rm Tm}{\plus}0.0{\rm 9}\,{\rm (Dp}{\hbox-}{\rm Dm})-{\rm 1}0\,({\rm Zp}{\hbox-}{\rm Zm}).$$
The Doran et al. climate relationships are based on data from the Long Term Ecological Research (LTER) stations (Clow et al. Reference Clow, McKay, Simmons and Wharton1988, Doran et al. Reference Doran, McKay, Clow, Dana, Fountain, Nylen and Lyons2002, Reference Doran, McKay, Fountain, Nylen, McKnight, Jaros and Barrett2008). These stations are located primarily in Taylor Valley. There are only two stations in Wright Valley, at Lake Vanda and Lake Brownworth, both at low elevation. There is one station at Lake Vida in Victoria Valley. Thus, the Doran rules have not been adequately tested beyond Taylor Valley. Doran et al. (Reference Doran, McKay, Clow, Dana, Fountain, Nylen and Lyons2002) showed that the air temperature at stations on the valley floors was not dependent on solar heating or the frequency of occurrence of the easterly wind, but did depend on the warming effect of the easterly wind.
It would be interesting to determine if the Doran climate rules, in particular the empirically derived rules in Eq. (2), have more general applicability than Taylor Valley. In this paper, we test Eq. (2) in Upper Wright Valley using the archive of temperature data collected by Imre Friedmann and colleagues in their studies of the cryptoendolithic microbial ecosystem that is found in the sandstone at high elevations (Friedmann Reference Friedmann1982, McKay & Friedmann Reference McKay and Friedmann1985, Friedmann et al. Reference Friedmann, Kappen, Meyer and Nienow1993, Reference Friedmann, Druk and McKay1994, McKay et al. Reference McKay, Nienow, Meyer and Friedmann1993). While the Friedmann et al. dataset was primarily focused on the temperature of the sandstone outcrops, air temperature, humidity and sunlight were also recorded. The year-round environmental data collected by Friedmann and colleagues was centred on Linnaeus Terrace from 1980–86. Two addition years of data were collected in 1993 and 1994 at Linnaeus Terrace and three other high elevation sites across Upper Wright Valley. This latter dataset was used by Friedmann et al. (Reference Friedmann, Druk and McKay1994) to study the habitability of the sandstone and by McKay et al. (Reference McKay, Mellon and Friedmann1998) in a study of ground ice stability.
There is little overlap of the Friedmann et al. datasets with the LTER datasets because the first of the stations that comprises the current LTER network was at Lake Hoare and was started in 1986. The larger LTER lakes network (Fig. 1) was not formed until 1994. Fortunately, the Lake Hoare LTER station recorded data in 1993 and 1994. The Lake Vanda LTER station in central Wright Valley recorded data in 1994. Thus, it is possible to test how well the Lake Hoare climate data can be used to predict values at the Upper Wright Valley stations in 1993 and 1994 thereby providing a direct test of the Doran rules related to summer temperatures and distance from the coast.
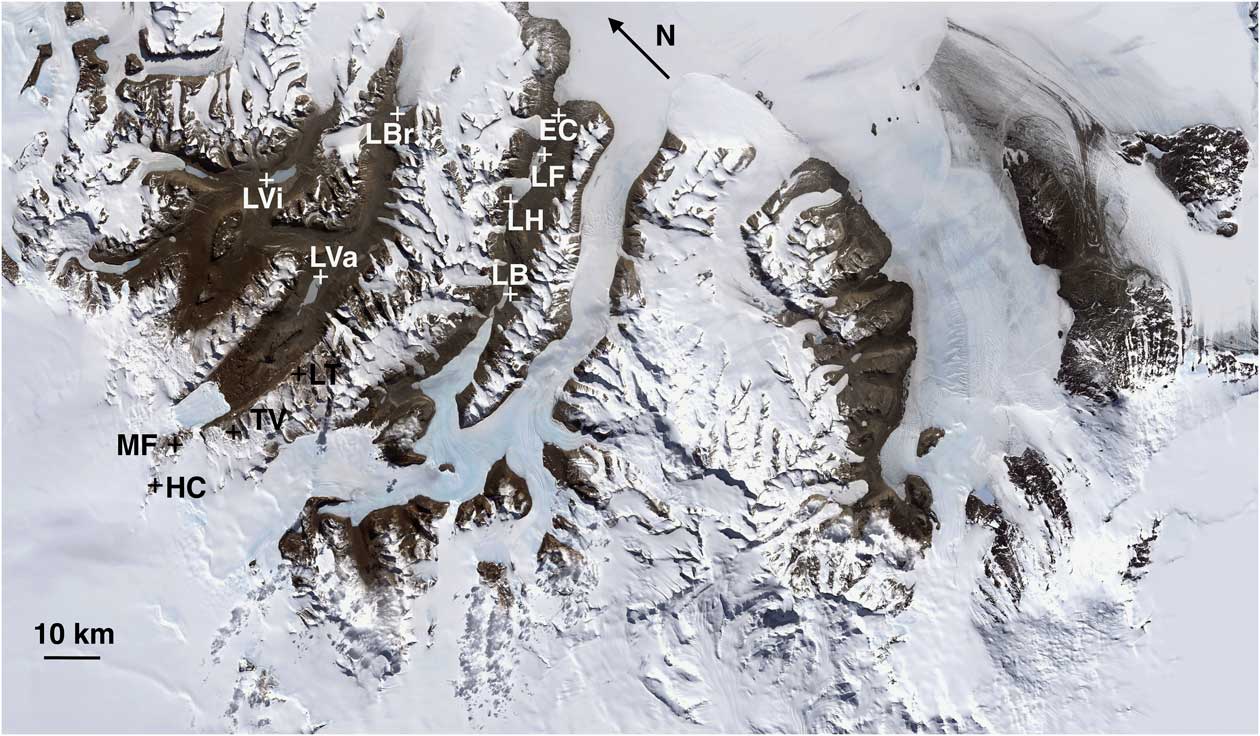
Fig. 1 Map showing the location of the sites in Upper Wright Valley from this study (in black) and the sites of the LTER network used in Doran et al. (Reference Doran, McKay, Clow, Dana, Fountain, Nylen and Lyons2002) (in white). EC=Explorers Cove, HC=Horseshoe Crater, LB=Lake Bonney, LF=Lake Fryxell, LH=Lake Hoare, LT=Linnaeus Terrace, LVa=Lake Vanda, LVi=Lake Vida, MF=Mount Fleming, TV=Tyrol Valley.
Results and discussion
Direct measurements of temperature with elevation confirm that the summer lapse rate in Upper Wright Valley follows the dry lapse rate as shown in Fig. 2 for bright sun (January 1984) and cloudy conditions (January 1985). The data are air measurements at 2 m above ground level, ranging in elevation from the base of Upper Wright Valley (near Don Juan pond) up to Linnaeus Terrace and from there up to the peak of Mount Oliver at just over 2000 m. This is essentially a vertical transect with no significant variations in distance from the coast. The data were acquired during a short interval (15 min) using a helicopter. A temperature lapse rate of 9.8ºC km-1 is shown by the solid line.
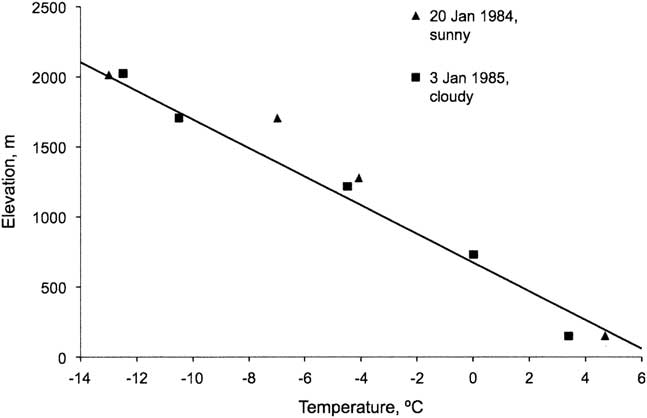
Fig. 2 Decrease in summer air temperature as a function of elevation in Upper Wright Valley for bright sun (January 1984) and cloudy conditions (January 1985). The slope of the solid line is a temperature decrease of 9.8ºC km-1, the dry lapse rate.
Table I compares the summer time monthly mean temperatures for the stations at Linnaeus Terrace, Tyrol Valley, Mount Fleming and Horseshoe Crater, with the values computed from the Doran rules (Eq. (2)) using the corresponding data recorded at Lake Hoare. Table I includes the GPS location, elevation and distance from the coast for each station. The data for Lake Hoare and Lake Vanda were obtained from the McMurdo LTER website (http://www.mcmlter.org) and the original data were used to compute the monthly averages. These agreed with the monthly averaging tool on the LTER website, except for that of January 1994. The website tool generates an incorrect average for January 1994 due to a change in sampling interval.
Table I Summer monthly temperatures.
The complete data are archived at the National Snow and Ice Data Center (http://nsidc.org).
A comparison of the actual monthly average temperature at the Upper Wright Valley stations and the values determined from Eq. (2) shows that the Doran rules provide a good fit to the summer data for the three furthest inland stations, which are at Tyrol Valley, Mount Fleming and Horseshoe Crater. The average difference between the measurements and the predicted values for these sites are -2.1±1.4°C, -0.5±1.0°C and -0.4±0.9°C, respectively. For all three stations, the data are slightly colder than predicted. In contrast, Linnaeus Terrace does not fit the Doran rules well. Each month at Linnaeus Terrace is warmer by several degrees than predicted by Eq. (2) and the average is +4.3±1.3°C. A comparison between Linnaeus Terrace and Lake Vanda is possible for December 1994 and Linnaeus Terrace is +3.7°C warmer than predicted from Eq. (2) given the values of elevation and distance from the coast listed in Table I. This result is consistent with the values predicted using Lake Hoare as the reference station.
Doran et al. (Reference Doran, McKay, Clow, Dana, Fountain, Nylen and Lyons2002) attribute the warming with distance from the coast to onshore winds, which are prevalent in the summer and warm as they progress through the valleys which creates a strong linear relationship between increasing temperature and distance from the coast. Doran et al. (Reference Doran, McKay, Clow, Dana, Fountain, Nylen and Lyons2002) reported that the total summer sunlight levels did not correlate with east–west position at their study sites. By contrast, for the sites considered here, which are quite far from the coast and at high elevation, variations in sunlight may play an important role. The average solar flux at Linnaeus Terrace was reported by Friedmann et al. (Reference Friedmann, McKay and Nienow1987) as 111 W m-2 for 1983–86. For 1993 and 1994 reported here, the average was 114 W m-2. This compares to 86.4 and 83.6 W m-2 for Lake Vanda and Lake Hoare, respectively (Doran et al. Reference Doran, McKay, Clow, Dana, Fountain, Nylen and Lyons2002). The average solar flux at Mount Fleming in 1993 was 128 W m-2 and at Horseshoe Crater was 131 W m-2. Increased solar flux warms the surface (e.g. Friedmann et al. Reference Friedmann, McKay and Nienow1987), and sensible and latent turbulent heat exchanges then result in warming the air above the surface by transferring heat from the ground surface.
This clear trend of increasing solar flux with distance inland may reflect less topographical shading at high elevation and the role of clouds carried inland by the onshore winds. Personal observation by the author during many summers at Linnaeus Terrace confirm that clouds often covered Vanda Station while the Terrace was in bright sun. Another possible effect, not addressed by the present data, is that warming by katabatic winds in the summer is more effective at these high elevation sites (e.g. Nylen et al. Reference Nylen, Fountain and Doran2004).
The sites studied here in Upper Wright Valley appear to conform to the Doran rules but the physical reason may be different from that suggested in Doran et al. (Reference Doran, McKay, Clow, Dana, Fountain, Nylen and Lyons2002). In the lower valleys, for example along Taylor Valley, the warming trend may be due to warming of incoming coastal winds as suggested by Doran et al. (Reference Doran, McKay, Clow, Dana, Fountain, Nylen and Lyons2002). At high elevations and close to the end of the valleys the warming with increased distance from the coast may be due to increased sunlight due to less topographical shading and reduced cloudiness as suggested by Keys (Reference Keys1980). It may be a coincidence that these two effects both seem consistent with a gradient of 0.09°C km-1.
The case of Linnaeus Terrace warrants further consideration. This site has an unusually rich and diverse colonization by cryptoendolithic communities and it was for this reason that it was the focus of study by Friedmann and colleagues. The fact that the summer air temperatures at this site appear to be several degrees warmer than predicted by the Doran rules may provide a basis for understanding this rich colonization. However, it should be noted that the lapse rate data in Fig. 2 show that the air temperature at Linnaeus Terrace was consistent with the vertical lapse rate at the time. This would imply that it is not just the Terrace but a vertical zone in Upper Wright Valley that had summer temperatures higher than predicted by the Doran rules related to distance from the coast. This may represent a distance such that the effect of increases in sunlight toward the polar plateau has begun and the warming effect of the incoming coastal winds is still present.
Conclusion
A comparison of the summer temperatures at four rocky sites at high elevations in Upper Wright Valley suggests that the climate rules suggested by Doran and colleagues provide a reasonably good prediction of the mean monthly temperatures in the summer for sites as far as 80 km from the coast. The data suggests the possibility that the physical cause for the increased temperature with increasing distance from the coast may change from wind dominated to solar flux dominated, and that there are intermediate distances that may be warmed by both effect and result in summer temperatures several degrees warmer than predicted by the rules. Given the utility of the Doran et al. rules for assessing climate in locations lacking year-round data stations, further and more detailed tests of these rules in the Dry Valleys and other ice-free locations in Antarctica is warranted, particularly at high elevations.
Acknowledgements
This paper is dedicated to the late E.I. Friedmann who recruited me to the study of the Antarctic Dry Valleys. The data in Upper Wright Valley were collected as part of a project supported by the US National Science Foundation grant OPP 91-18730 to E.I. Friedmann. E.I. Friedmann, A.Y. Druk and H. Sun assisted in the deployment and retrieval of the stations in the field. I thank Kaj Williams for useful discussions on this topic and the reviewers for rapid and useful reviews.


