


1. INTRODUCTION
Over the past two decades, experiments with various inertial confinement fusion (ICF) capsule targets have shown that fluid instabilities play an important role in determining the efficiency of target implosion and the resulting neutron yield. There are three kinds of fluid instabilities of interest, Rayleigh-Taylor (RT), Richtmyer-Meshkov (RM), and Kelvin-Helmoholtz (KH) instabilities. The Rayleigh-Taylor instability is driven by buoyancy at a perturbed interface between two fluids when the overall pressure and density gradients are opposite, such as when a light fluid decelerates a heavy fluid. The Richtmyer-Meshkov instability occurs when a shock interacts with a perturbed fluid interface. An impulsive drive is provided where the pressure and density gradients are misaligned, whether the shock passes from the light to heavy fluids or vice versa. The Kelvin-Helmholtz (KH) instability is driven by a velocity shear and can occur in a single fluid with homogeneous material properties.
Among these three kinds of instabilities, RT is especially important during the stagnation phase of an ICF implosion. Experimental data and three-dimensional (3D) numerical simulations (Marinak et al., 1996) indicate that the neutron yield of an ICF target capsule varies as the surface roughness of the inner shell of the capsule varies, because the level of RT turbulence that is induced during the implosion varies. Both data and simulation show a substantial decrease in the neutron yield with increasing level of RT turbulence. It is essential to model this effect in realistic computer simulations for ICF targets. Since it is impractical to numerically model the turbulence directly using a 3D simulation in all but a few cases, there exists a need for a comprehensive turbulence model that can be added to the contemporary one-dimensional (1D) Lagrangian, radiation-hydrodynamics codes that are widely used to design ICF target capsules (Haan et al., 1995; Dittrich et al., 1999; Peterson et al., 2002) to capture the relevant physics of the non-linear stage of fluid instabilities.
Several empirical turbulence models have been proposed for simulating ICF implosions (Scannapieco & Cheng, 2002; Tipton, 1999; Youngs, 1989). Among these the k-L turbulence model (Tipton, 1999) has been used to study the performance of a double-shelled target capsule for NIF in 1D (Amendt et al., 2002); however uncertainty exists as to how the empirical constants in this model should be chosen and what their respective values should be. The goal of this paper is to present a methodology for determining the three empirical parameters in the k-L model, so that agreement is achieved with results from recent RT and RM experiments in addition to classical KH experiments involving the growth of shear mixing layers. Before describing the k-L model, my effort to calibrate it, and its ability to model relevant experiments, it is instructive to review a few of the many previous works involving RT, RM, and KH instabilities.
Among the earliest experimental work involving RT instability in fully non-linear regime was that of Read (1984). This series of experiments involved accelerating a container holding two incompressible, immiscible fluids, using a rocket attached to the container. It was shown that the light fluid (ρ2) penetrates the heavy fluid (ρ1) according to a square-law in time,
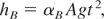
where A is the Atwood number ((ρ2 − ρ1)/(ρ2 + ρ1)), g is the constant acceleration of the fluid interface, and αB is an empirical constant of roughly 0.05. In subsequent work, Dimonte and Schneider (2000) used a linear electric motor (LEM) in place of a rocket, to impart acceleration to a fluid interface, and they report that αB = 0.05 ± 0.005 for bubbles over a range of Atwood numbers from 0.15 to 0.96. While the value of αB is relatively constant, for the spike penetration where the heavy fluid penetrates the lighter fluid, it is shown that αS is a function of density ratio, R = ρ2 /ρ1 such that αS = 0.05RDα, where Dα = 0.33 ± 0.05 (Dimonte & Schneider, 2000).
In addition to studying RT instabilities with the LEM, Dimonte and Schneider (2000) also explore non-linear RM instabilities in the incompressible limit. In this case the bubble penetration length is found to obey a power-law relationship in time,
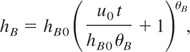
where θB = 0.25 ± 0.05 and, like the RT case, the spike penetration length varies with density ratio such that θS = 0.25RDθ, where Dθ = 0.21 ± 0.05. Other researchers have studied RM instabilities in the non-linear regime experimentally by considering the interaction of a shock wave with a fluid interface. Brouillette (2002) provides a comprehensive review of this field.
The above discussion has focused on RT and RM instabilities, with regards to shear instabilities, such as KH, there have been many extensive studies of this phenomenon experimentally and theoretically, and for this reason only, a brief review is given here. In general terms, a shear flow arises when there is a sharp velocity gradient separating two regions of flow, which may or may not have the same density. As time develops, if one moves in the frame with the average velocity of the flow, Brown and Roshko (1974) show that for a uniform density flow, the mixing layer grows linearly in time such that

where Δv is the initial velocity difference. Slessor et al. (2000) compiled all the available experimental data for the growth rate of compressible shear layers, and Speziale (1991) gives an excellent review of the k − ε, two-equation turbulence model which has found widespread application in the field of turbulence modeling using the Reynolds averaged navier-stokes (RANS) equations. This paper explores the use of the k-L turbulence model, in the context of a RANS-like approach, to model buoyancy and shear driven instabilities.
Several analytical models have been put forward, in addition to purely numerical simulations (Youngs, 1994; Marinak et al., 1996; Holmes et al., 1999; Weber et al., 2003), to describe the non-linear turbulence induced by RT and RM instabilities. Among these models the buoyancy-drag (BD) model (Dimonte, 2000) has been the subject of much research, with various versions appearing in the literature. In its basic form, the model consists of two differential equations that describe the time evolution of the bubble and spike penetration lengths,

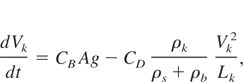
where Lk, Vk, and ρk represent the penetration length, velocity and density, respectively, of bubbles or spikes. CB and CD are empirical factors. There are two contributions to the penetration growth rate in this model, buoyancy being the first contribution, and drag the second. This model has been shown to give excellent agreement with the LEM experimental data (Dimonte & Schneider, 2000) for both the constant (RT) and impulsive (RM) acceleration cases.
This paper is organized as follows. In Section 2, I give a detailed description of the k-L turbulence model, which shares many features with the BD model discussed above. I also discuss my numerical implementation of the k-L model together with the equations of 1D Lagrangian hydrodynamics. The k-L model has three free parameters and next, in Sections 3, 4, and 5, I calibrate these parameters with existing experimental data from the LEM and shear flow experiments. In Section 6, I use the calibrated model to explore the variation of αB and θB with Atwood number, and I compare the model results with data from the LEM. Following this I simulate two separate RM shock-tube experiments (Vetter and Sturtevant, 1995; Poggi et al., 1998) in Section 7, where I compare the predicted total mix width as a function of time with the experimentally determined values in both cases. Finally, I end with a summary and conclusions.
2. MODEL DESCRIPTION
The k-L turbulence model attempts to capture the physics of the BD model where there is a turbulent eddy scale length equation and a turbulent velocity scale or growth rate equation. Whereas the BD model is purely zero-dimensional, the k-L model is a part of a larger 1D Lagrangian formulation. In such situations, each zone on the physical grid has its own value of eddy length scale and turbulent kinetic energy, unlike the BD model where there is one value of these quantities for the entire grid. The challenge in implementing a BD type model into a hydrodynamics code is how to use the values of length scale and turbulent kinetic energy to find the physical fluxes of species mass fraction, internal energy and momentum, which represent the turbulence that one attempts to model. The approach used by Tipton (1999) in the k-L model is to use the turbulent length and kinetic energy scales to construct an eddy viscosity, μt. This viscosity is then used to compute the turbulent fluxes of species mass fraction, X and internal energy, e. In addition, like the standard k-epsilon model (Speziale, 1991); widely used in shear flow problems, there is turbulent diffusion of length scale and turbulent kinetic energy in the k-L model as well.
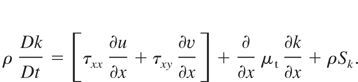
Having outlined the basic features of the k-L model, I now present the full formulation as applied to an unsteady 1D problem where there are only variations in the spatial dimension x. I have included two velocity components, the velocity in the x direction, denoted as u, and the velocity in the transverse direction, denoted as v, so that I can model shear flow problems. The basic conservation equations for mass, momentum, internal energy, and species mass fraction, written in Lagrangian form, are as follows:
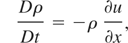
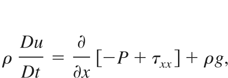
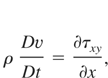
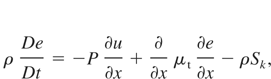
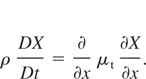
In the above equations the total derivative, D/Dt = ∂/∂t + u(∂/∂x), is used corresponding to a reference frame moving with the fluid. In the equation for the u velocity, a body force term, ρg is included which will prove useful later when modeling RT problems, and P is the total fluid pressure. The components of the Reynolds stress tensor, τxx and τxy, take the following form in the k-L model:
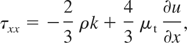

The eddy viscosity is determined by the turbulent length scale, L, and kinetic energy, k, according to the relation:
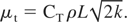
The equations that describe the time evolution of the L and k variables are given below:
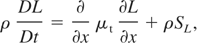
The source term for the production of the turbulent eddy scale length is as follows:
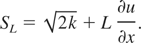
Turbulent eddy scale length is produced by two mechanisms, growth due to the turbulent kinetic energy represented by the

term, and growth due to the compression of the flow, represented by the L(∂u/∂x) term.
The source term for the production of the turbulent kinetic energy is as follows:
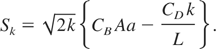
In the above equation, A is the Atwood number and a is the local acceleration of the flow, a = −(1/ρ)(∂P/∂x). There are two contributions to the production of turbulent kinetic energy that due to buoyancy effects, represented by the CB Aa term, and that is due to drag effects, represented by the CD k/L term.
Here I present a short summary of the numerical approach I used to implement the k-L model for 1D Lagrangian hydrodynamics; complete details are given elsewhere (Chiravalle, 2004). The general Lagrangian technique I used to solve the hydrodynamic equations above follows that presented by Bowers and Wilson (1991) and incorporates both a spatially and temporally staggered grid. In this Lagrangian formulation, the hydrodynamic equations are advanced explicitly in time by first solving the flow velocity equations, Eq. (7) and Eq. (8), and then the x position of each zone boundary is updated. The new flow velocities are then used to find the velocity gradients and to update the turbulent length and kinetic energy scales. I update the length scale and turbulent kinetic energy equations, Eq. (14) and Eq. (15) by using the method of operator splitting. The effects due to the buoyancy-driven source term, Sk, the turbulent diffusion, and the shear-driven source term, [τxx(∂u/∂x) + τxy(∂v/∂x)], are considered as three separate partial steps, performed in sequence. For the first partial step involving the buoyancy-driven source term, I used the two-stage predictor-corrector method (Tannehill et al., 1997) to do the partial update. When I performed the partial update for the turbulent diffusion effects, I also performed the partial update on the mass fraction and internal energy equations as well. After fully updating Eq. (14) and Eq. (15), I then computed a new density for each cell, using the new zone widths and the constant mass of each zone. Following this, I solved for the internal energy, Eq. (9). At this point, I computed the new values of pressure and the Reynolds stress tensor as well as the new values of the time step to be used in the next cycle. I used a von Neumann formulation of artificial viscosity (Bowers & Wilson, 1991) to ensure numerical stability.
A central issue in implementing the k-L model numerically is the definition and computation of the Atwood number. I adopt the procedure developed by Tipton (1999). As part of this procedure at each zone boundary two densities, ρH and ρL, are defined such that
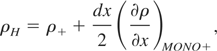
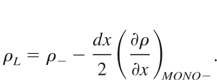
In these equations, the subscript + denotes the value at the zone center immediately to the right of the boundary, and the subscript − denotes the corresponding value immediately to the left. For all the zones in the domain the monotonic density gradient, (∂ρ/∂x)MONO, is calculated at zone center using the method of Van Leer (1977). The Atwood number at each zone boundary is computed then as
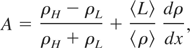
where 〈L〉 and 〈ρ〉 are the average values of the length scale and density at the zone boundary, and dρ/dx is the density derivative at the boundary, computed in the normal way. By computing A in this manner, both continuous and discontinuous effects at the zone boundaries are taken into account, as the first and second terms on the right-hand side of Eq. (20), respectively. In order to calculate the source terms, Sk and SL, the Atwood number at the zone centers is needed, which is obtained by simply taking the maximum value from both of the boundaries.
In total, there are three free parameters in the k-L model, CB, CD, and CT. I used three test problems to calibrate these parameters independently: a shear layer growth test case, described in Section 3, a constant g (RT) test case, described in Section 4, and impulsive buoyancy (RM) test case, described in Section 5. The procedure for calibrating the model involves two steps; Step 1 entails calculating the shear layer growth and the impulsive buoyancy test problems using a wide range of values for CD and CT to determine which values match certain experimental data. The value of CB is then determined in Step 2 by performing a series of calculations involving the constant g test case and comparing with data from the LEM.
3. SHEAR FLOW TEST PROBLEM
The shear layer growth problem involves an initial discontinuity in the v velocity at the origin as shown in Figure 1. The v velocity at the left hand boundary, denoted as vL, is equal to 0.078 cm/μs and the initial velocity difference at the origin is Δv = 0.031 cm/μs. The pressure and density were held fixed everywhere else in the domain at 0.0172 Mbar and 1 g/cm3, respectively. The u velocity was initially set to zero everywhere as well. As with all the problems considered in this paper, ideal gas equation of state is used and γ = 1.4, expect for the shock tube problems, discussed in Section 7. In this shear flow test problem, there is no distinction between the microscopic fluid properties on either side of the origin as there is in the two test problems to follow. This type of 1D shear flow problem has been used previously by Youngs (1994) to calibrate his multi-phase turbulence model.

Setup for the shear flow test problem, showing the v velocity profile at late time and how δ is calculated, for CD = 2.55 and CT = 0.30.
For this kind of shear layer problem, the total width of the shear layer, δ, should grow linearly in time with a slope equal to δ′ = 0.18Δv as discussed in Section 1. A complete analysis of the shear flow problem is given in this section, illustrating the important features of the problem including how δ is calculated, for the case where CD = 2.55 and CT = 0.30. Following this, a parameter study is performed where δ′ is determined as a function of CD and CT.
The v velocity profile after 150 μs is shown in Figure 1, for the case where CD = 2.55 and CT = 0.30. For the shear flow test problem, the mix width, δ, is calculated as the distance between the two points corresponding to 99% and 1% of the velocity difference, Δv, as indicated in Figure 1. δ grows linearly in time, as shown in Figure 2, where it is evident that the peak value of the turbulent eddy length scale does also. The peak value of the turbulent kinetic energy approaches a constant value after a transient period of about 5 μs, also shown in Figure 2. The peak values are determined by finding the maximum values of the respective quantities over the entire domain at any given instant in time. The profiles of L and k, normalized by their peak values, are presented in Figure 3 at 70 and 150 μs, as functions of x/δ. Included also in Figure 3 is the v velocity profile, normalized by (v − vL)/Δv. The normalized profiles of all three of these quantities are nearly identical at the two times shown, illustrating the self-similar nature of the problem.

Time plot of δ and the peak values of k and L for CD = 2.55 and CT = 0.30.

Normalized profiles of v, L and k at 70 μs (a) and 150 μs (b) for CD = 2.55 and CT = 0.30.
As part of the calibration procedure, I show in Figure 4 the contours of normalized shear growth rate, δ′/0.18Δv, as a function of CD and CT, for the shear flow test problem. The growth rate, δ′, was determined numerically for each pair of CD and CT values by fitting a line, c1 + δ′t, to the calculated function of δ versus t, using a linear least-squares algorithm (Press et al., 1992). A total of 400 pairs of CD and CT values where used to generate the contours in Figure 4. The contours are approximately straight lines, with CT increasing as CD increases for a given value of normalized growth rate. The contour of unity represents the experimental data of Brown and Roshko (1974), who report an experimental error of 10%.

Contours of normalized shear growth rate, δ′/0.18Δv, for different values of CD and CT.
4. IMPULSIVE TEST PROBLEM
The impulsive buoyancy test problem involves simulating a situation where the buoyancy term in Sk is suddenly brought to zero. Such a situation commonly occurs when a shock wave passes through a fluid interface, or when a large impulsive acceleration is applied to the interface, as realized in some of the LEM experiments. One way to approximate an impulsive buoyancy situation is to start a calculation with finite values of both k and L, generated for instance by running a constant g RT unstable problem for some length of time, and to turn off the buoyancy term in the model by setting CB = 0. Without buoyancy, the penetration lengths should grow as a power-law in time according to Eq. (2), and the turbulent kinetic energy should decay monotonically in time. In this section, I describe in detail the results from an impulsive buoyancy test problem with CD = 2.55 and CT = 0.30, where I show how the bubble and spike penetration lengths, hB and hS, vary in time as well as the peak values of k and L. After this, I show how θB varies with CD and CT, completing Step 1 of the calibration procedure.
The initial conditions for the impulsive buoyancy test problem are shown in Figure 5. For this problem the Atwood number is 0.4. The finite pressure gradient which is evident in Figure 5 is maintained by applying a constant g of −9.8 cm/μs2 throughout the duration of the calculation. Because CB = 0 at all times, the pressure gradient does not produce any buoyancy in the problem. The mass fraction profile after 250 μs is shown in Figure 6. The bubble penetration length, hB, is defined in this paper as the distance between the origin and the point where the mass fraction is 99%, as illustrated in Figure 6. Similarly the spike penetration length, hS, is defined as the distance between the origin and 1% mass fraction point, also shown in Figure 6. Both hS and hB grow in time according to Eq. (2), with θS = θB = 0.25, as indicated in Figure 7. θS and θB are determined by fitting a function, c1(1 + c2 t)θ, to the calculated penetration lengths. The fits for bubbles and spikes that were used to determine θB and θS are shown in Figure 7. A non-linear Levenberg-Marquardt fitting algorithm (Press et al., 1992) was used to find the parameters, c1, c2 and θ, for each fit. Figure 7 also reveals that the peak value of k decays monotonically in time and the corresponding value of L grows according to a power law, in the same fashion as hS and hB. The spatial profiles of mass fraction, k, and L, normalized by their peak values, are given at 125 and 250 μs in Figure 8. Once again when appropriately normalized these profiles are essentially the same at early and late times.

Setup for the impulsive buoyancy test problem. The normalized values of pressure, density, and the mass fraction profile are shown in (a) at t = 0, and the corresponding values of k, L and u are shown in (b).

Mass fraction profile at 250 μs for the impulsive buoyancy test problem with CD = 2.55 and CT = 0.30.

Time evolution of hS and hB and the peak values of L and k with CD = 2.55 and CT = 0.30.

Normalized profiles of L, k and mass fraction at 125 μs (a) and 250 μs (b).
Figure 9 shows the contours of θB as a function CD and CT, and as in Figure 4, 400 pairs of CD and CT values were used to generate the contours in Figure 9. In most of the domain, there is virtually no dependence on CT. It seems that θB depends almost entirely on the value of CD, decreasing inversely with CD. The impulsive LEM experiments obtain θB = 0.25 ± 0.05 and to match this result requires that CD = 2.55. With this value of CD the contours of Figure 4 indicate that CT must be equal to 0.30 to match the Brown and Roshko (1974) experimental result for the shear growth rate. This completes Step 1 of the calibration procedure.

θB versus CD and CT.
5. CONSTANT g TEST PROBLEM
With CD and CT determined from Step 1, the value of CB is now fixed in Step 2 by considering a constant g RT unstable test problem. For this test problem at t = 0, there is a discontinuity in density of 0.67 g/cm3, corresponding to an Atwood number of 0.5, at the origin, and the density and pressure gradients have opposite signs, as shown in Figure 10. Initially the flow is in hydrostatic equilibrium with a constant g field, equal to −9.8 × 10⁻⁴ cm/μs2, which remains fixed throughout the calculation. The initial velocity is zero everywhere, as is the initial turbulent kinetic energy. The initial value of turbulent eddy scale length is set to 10−7 cm everywhere, except in the cells before and after the boundary between heavy and light fluids. In these two cells, the turbulent eddy scale length is taken to be 10−3 cm. Under such conditions the bubble and spike penetration lengths should grow in a self-similar way, according Eq. (1), once the instability has outgrown the initial linear phase. In this section, I present first the complete analysis of this RT unstable problem with CB = 1.20 and then later I show how αB varies with CB.

The initial pressure and density profiles in the constant g test problem.
The bubble and spike penetration lengths as a function of time are given in Figure 11, for the constant g test problem with CB = 1.20. The same definition of bubble and spike penetration lengths that was used in the impulsive buoyancy problem and illustrated in Figure 6 is also used here. To determine the values of αB and αS, I fit the function, c1 + αA|g|t2, to the calculated penetration lengths, using a least-squares fitting routine (Press et al., 1992) to find the two parameters c1 and α. I include the fitted functions for both bubble and spike penetration lengths in Figure 11, where it is evident that in both cases t2 behavior is predicted by the model, with αB = 0.05 and αS = 0.07. Also from Figure 11 it is clear that the peak values of both k and L exhibit t2 behavior as well. In Figure 12, the spatial profiles of the mass fraction and, k and L, normalized by their peak values, are given at 70 and 140 μs, as a function of x/hS, and the self-similar nature of this test problem is evidenced. The Atwood number profile at 140 μs, computed using Eq. (20), is given in Figure 13 and it is interesting to note that the peak value at 140 μs is about 20% larger than the initial, prescribed value of 0.5. In determining αB and αS through the fitting routine, the initial prescribed value of the Atwood number, 0.5, is used.

Time evolution of hS and hB, and the peak values of L and k for the constant g test problem with CB = 1.20.

Normalized profiles of L, k and mass fraction at 70 μs (a) and 140 μs (b) for CB = 1.20.

The Atwood number profile at 140 μs, computed using Eq. 20.
In Figure 14, I show αB as a function of CB, as determined using the constant g test problem, and the same analysis described above. Twenty points were used to generate the profile in Figure 14. To achieve agreement with the LEM result of αB = 0.05 ± 0.005, it is necessary to have CB = 1.20. Now that I have calibrated all three of the free parameters in the k-L model, I can explore how the model performs at various Atwood numbers, and its ability to simulate the interaction of a shock wave with a fluid interface.

αB versus CB for the constant g test problem.
6. EFFECT OF ATWOOD NUMBER ON θB AND αB
In this section, a study is made using the test problems from the previous two sections, to evaluate the effect of Atwood number on θB and αB as predicted by the k-L model. There exists a comprehensive set of data from the LEM, involving constant g and impulsive buoyancy situations, over a wide range of Atwood numbers. I will compare the results of the k-L model to this data. In doing so, I must point out that the LEM experiments were conducted primarily using liquids, not gases, as is the case with the test problems I use in this paper. I have already used some of the LEM data in the calibration procedure, and in doing so I have assumed that the behavior of θB and αB, as observed during the LEM experiments, is the same for any two materials undergoing turbulent mixing regardless of the form of their equations of state. This point remains to be established experimentally however. In this section, I first present the results of the impulsive buoyancy test problem for a variety of Atwood numbers, and I compare θB and θS from the k-L model with the LEM data in each case. This is then followed by the corresponding results for the constant g RT unstable test problem.
In Figure 15, the predicted values of θB and θS from the k-L model are shown together with the corresponding LEM data over a range of Atwood numbers from 0.05 to 0.95. The model predictions in Figure 15 were generated by running the impulsive buoyancy test problem for a series of different Atwood numbers. I initialize the computation for each of the different cases using profiles similar to those depicted in Figure 5, taking into account the appropriate density difference needed to achieve the prescribed global value of the Atwood number. The prescribed global Atwood number, used in Figure 15, is specified in terms of the densities at the left and right most points on the grid and is not related to the Atwood number for each zone, as computed by Eq. (20) during the calculation. As seen in Figure 15, the model predicts little variation in θB with Atwood number, as observed in the LEM experiments. In addition, the model suggests that there is little difference between θB and θS, with both being about 0.25. The LEM experiments show that θB and θS are the same at low Atwood number, but when the Atwood number exceeds about 0.7, the data suggests a separation between the two, although there is a noticeable spread in the data. The k-L model does not predict a clear difference between θB and θS in this regime. A time history of the bubble and spike penetration lengths for the impulsive buoyancy test problem at the highest Atwood number considered, 0.95, is given in Figure 16. The spike penetration length is about three times greater than the corresponding bubble length, but yet the model predicts that θB and θS are about the same.

θB and θS versus Atwood number. The corresponding LEM data (Dimonte & Schneider, 2000) are shown as open symbols.

Time evolution of hS and hB, and the peak values of L and k for the impulsive buoyancy test problem at an Atwood number of 0.95.
In Figure 17, αB and αS are shown, as calculated by the k-L model for the constant g test problem, over a range of Atwood numbers from 0.05 to 0.95. The corresponding LEM data is also shown for comparison. The model predicts that αB is relatively constant everywhere at 0.05. Unlike the impulsive buoyancy test problem, at high Atwood number, the model does show a definite separation between αB and αS for the constant g test problem, for instance at an Atwood number of 0.95 αS is about 3.1 times larger than αB which is in good agreement with the LEM data. A complete time history for the calculation at 0.95 is given in Figure 18. The bubble and spike penetration lengths are shown to increase smoothly in time, proportional to t2, as expected.

αB and αS versus Atwood number. The corresponding LEM data (Dimonte & Schneider, 2000) are shown as the open symbols.

Time evolution of hS and hB, and the peak values of L and k for the constant g test problem at an Atwood number of 0.95, with CB = 1.20.
7. SHOCK-TUBE PROBLEMS
I now use the k-L model to simulate two shock-tube experiments (Vetter & Sturtevant, 1995; Poggi et al., 1998), both of which involve situations where in addition to the initial interaction there is a second shock interaction with the interface involving the reflected shock from the wall of the shock-tube. In both cases, experimental data for the total width of the turbulent mixing layer was obtained as a function of time, using a schlieren technique to image the flow. It is important to note that RM type instabilities occur regardless of the sign of ∇ρ·∇P at the interface, and the two experiments that I chose to simulate represent both of these scenarios. Each of the two shock tube experiments involves a fluid interface consisting of air and SF6. For both cases, an initial shock wave of roughly M = 1.45 is generated in the tube and travels through the fluid interface, then reflects off the end wall of the test section, and interacts with the fluid interface again. In the case of Vetter and Sturtevant (1995), the reflected shock travels through SF6 and ∇ρ·∇P > 0 at the interface, whereas for that of Poggi et al. (1998), the reflected shock travels through air and ∇ρ·∇P < 0.
When simulating these experiments numerically, I take γ = 1.095 for SF6 and γ = 1.4 for air. I initialize the turbulence parameters in the same way as for the constant g test problem, except that I consider values of initial eddy scale length, L0, other than 10−3 cm in the two cells adjacent to the fluid interface. It is necessary to do this in order to match the experimental data for the total mix width, and a direct measurement of the initial eddy length scale is not viable.
First I simulate the experiment of Poggi et al. (1998), involving multiple reflected shocks. To give an indication of when the reflected shocks interact with the fluid interface, I performed a calculation with no mix, and the location of the interface and the shock position are shown in Figure 19 as functions of time for this experiment. Including the effects of turbulent mix, I find that a value of 2 mm for L0 leads to good agreement with the data in this case, as shown in Figure 20. The data exhibits two small dips in the mix width, which are also predicted by the model and apparently correspond to those times when a reflected shock interacts with the interface at 1.17 and 1.82 ms as shown in Figure 19. These times also correspond closely to those temporal locations were the peak value of turbulent kinetic energy is large as shown in Figure 21. The model predicts that when the reflected shock interacts with the fluid interface turbulent kinetic energy is produced, and this energy is then slowly dissipated after the reflected shock passes through the interface. This is most clearly visible at about 1.17 ms in Figure 21. The peak turbulent eddy length scale increases at all times, also evident in Figure 21.

Calculated position of the shock and the interface, without mix, as a function of time for the experiment of Poggi et al. (1998). The times when the reflected shock interacts with the interface are indicated in milliseconds.

Calculated mix width as a function of time for the experiment of Poggi et al. (1998). Their data are shown as the open symbols.

Time evolution of the peak values of L and k, predicted by the k-L model with L0 = 2 mm, for the experiment of Poggi et al. (1998).
Figure 22 shows the time history of the total mix width predicted by the k-L model for the Vetter and Sturtevant (1995) experiment, together with their data. As the initial eddy scale length is reduced from 0.5 mm to 0.01 mm, satisfactory agreement is achieved with the data at initial times, between 2 and 3 ms, and at later times, between 4 and 5 ms, after the interaction with the reflected shock which takes place at 3.38 ms. However, adjusting L0 alone can not reconcile the model with the data after 5 ms. The data shows a plateau in this region but the model gives a mix width that continues to grow. As with the experiment of Poggi et al. (1998), the model shows a sharp increase in turbulent kinetic energy when the reflected shock interacts with the interface at about 3.38 ms, and after this interaction the turbulent kinetic energy decays as illustrated in Figure 23.

Calculated mix width as a function of time for the Vetter & Sturtevant (1995) experiment. Their data are shown as the open symbols. The time when the reflected shock hits the interface (dashed line) is given in milliseconds.

Time evolution of the peak values of L and k, predicted by the k-L model with L0 = 0.01 mm, for the experiment of Vetter & Sturtevant (1995).
5. SUMMARY AND CONCLUSIONS
In this paper, I explored three simple test problems, a constant g test problem, an impulsive buoyancy test problem, and a shear layer test problem, using the k-L turbulence model. By using data from the LEM experiments of Dimonte and Schneider (2000), and the shear layer mixing data obtained by Brown and Roshko (1974), I calibrated the three free parameters in the k-L model and found that CT = 0.30, CD = 2.55, and CB = 1.20. Having calibrated the model several conclusions can be drawn regarding its ability to predict various characteristics of RT and RM instabilities
For the constant g RT test problem, the k-L model captures the t2 dependence for the bubble and spike penetration lengths, and is successful in reproducing the behavior of αB and αS over the entire range of Atwood numbers as observed in the LEM experiments. For the impulsive buoyancy test problem, the k-L model predicts that both bubbles and spikes grow according to Eq. (2) with θB ≈ θS ≈ 0.25 over the complete range of Atwood numbers, and does not predict separation between θB and θS at high Atwood numbers, as implied by the results from the LEM experiments. Future work must address this issue and perhaps some modification of the drag term in the standard k-L model may improve this situation. For both the RT and RM test problems, the k-L model shows the expected self-similar behavior at late times. When applied to the shear flow problem, the k-L model indicates that the turbulent kinetic energy should approach a constant value at late times, and both the turbulent eddy length and the width of the shear layer should grow linearly in time, in accordance with experiments.
With the proper adjustment of the initial turbulent eddy scale length, the k-L model is successful in capturing the essential features of the temporal development of the total mix width for the shock tube experiments of Vetter and Sturtevant (1995) and Poggi et al. (1998). In both cases, the model predicts that as the reflected shock hits the fluid interface, the turbulent kinetic energy increases sharply and then subsequently decays after the passage of the shock. However, the model is not successful in capturing the late-time behavior observed by Vetter and Sturtevant (1995). This point should be explored in future works. In this paper, only one data set from the Vetter and Sturtevant (1995) was used, it would be worthwhile to perform simulations for the other data sets they present as well.
Although more work remains to be done to improve the k-L model, this paper has shown that it is a robust turbulence model, that in addition to adequately dealing with shear-driven instabilities also embodies the physics of RM and RT instabilities in the fully non-linear regime. In the future, I hope to apply the k-L model to situations of relevance to ICF physics, and address its ability to predict the dynamics of hydrodynamic implosions.
ACKNOWLEDGMENTS
I want to thank Guy Dimonte for his helpful comments on parts of this manuscript. I also want to thank Bob Tipton for sharing his insights about how the Atwood number should be calculated, via Eq. (20). This work was performed under the auspices of the U.S. Department of Energy by Los Alamos National Laboratory under Contract No. W-7405-ENG-36.


