INTRODUCTION
Continuous, high-resolution late Quaternary environmental records for the southern Great Plains of North America are sparse because of the scarcity of lacustrine and peat bog deposits (Bryant and Holloway, Reference Bryant, Holloway, Bryant and Holloway1985; Hall, Reference Hall1995; Bousman, Reference Bousman1998). Although numerous other sedimentary deposits (alluvial and cave deposits) and packrat middens in Texas and surrounding states have provided pollen records, they lack continuous and well-dated sequences (Bryant and Holloway, Reference Bryant, Holloway, Bryant and Holloway1985). In this context, the geographic patterns of vegetation change during the last glacial maximum (LGM), deglaciation, and Holocene are sparse. Hall's Cave, near the southern perimeter of the Edwards Plateau in Texas (Fig. 1), houses an uninterrupted sedimentary sequence spanning the latter part of the LGM to the present and, as a consequence, has been the subject of several paleoclimatic reconstructions based on multiple proxies including micromammal remains (Toomey, Reference Toomey1993; Toomey et al., Reference Toomey, Blum and Valastro1993; Smith et al. Reference Smith, Tomé, Elliott Smith, Lyons, Newsome and Stafford2016), stable isotopes (Cooke et al., Reference Cooke, Stern, Banner, Mack, Stafford and Toomey2003), magnetic susceptibility (MS; Ellwood and Gose, Reference Ellwood and Gose2006), and opal phytoliths (Joines, Reference Joines2011).
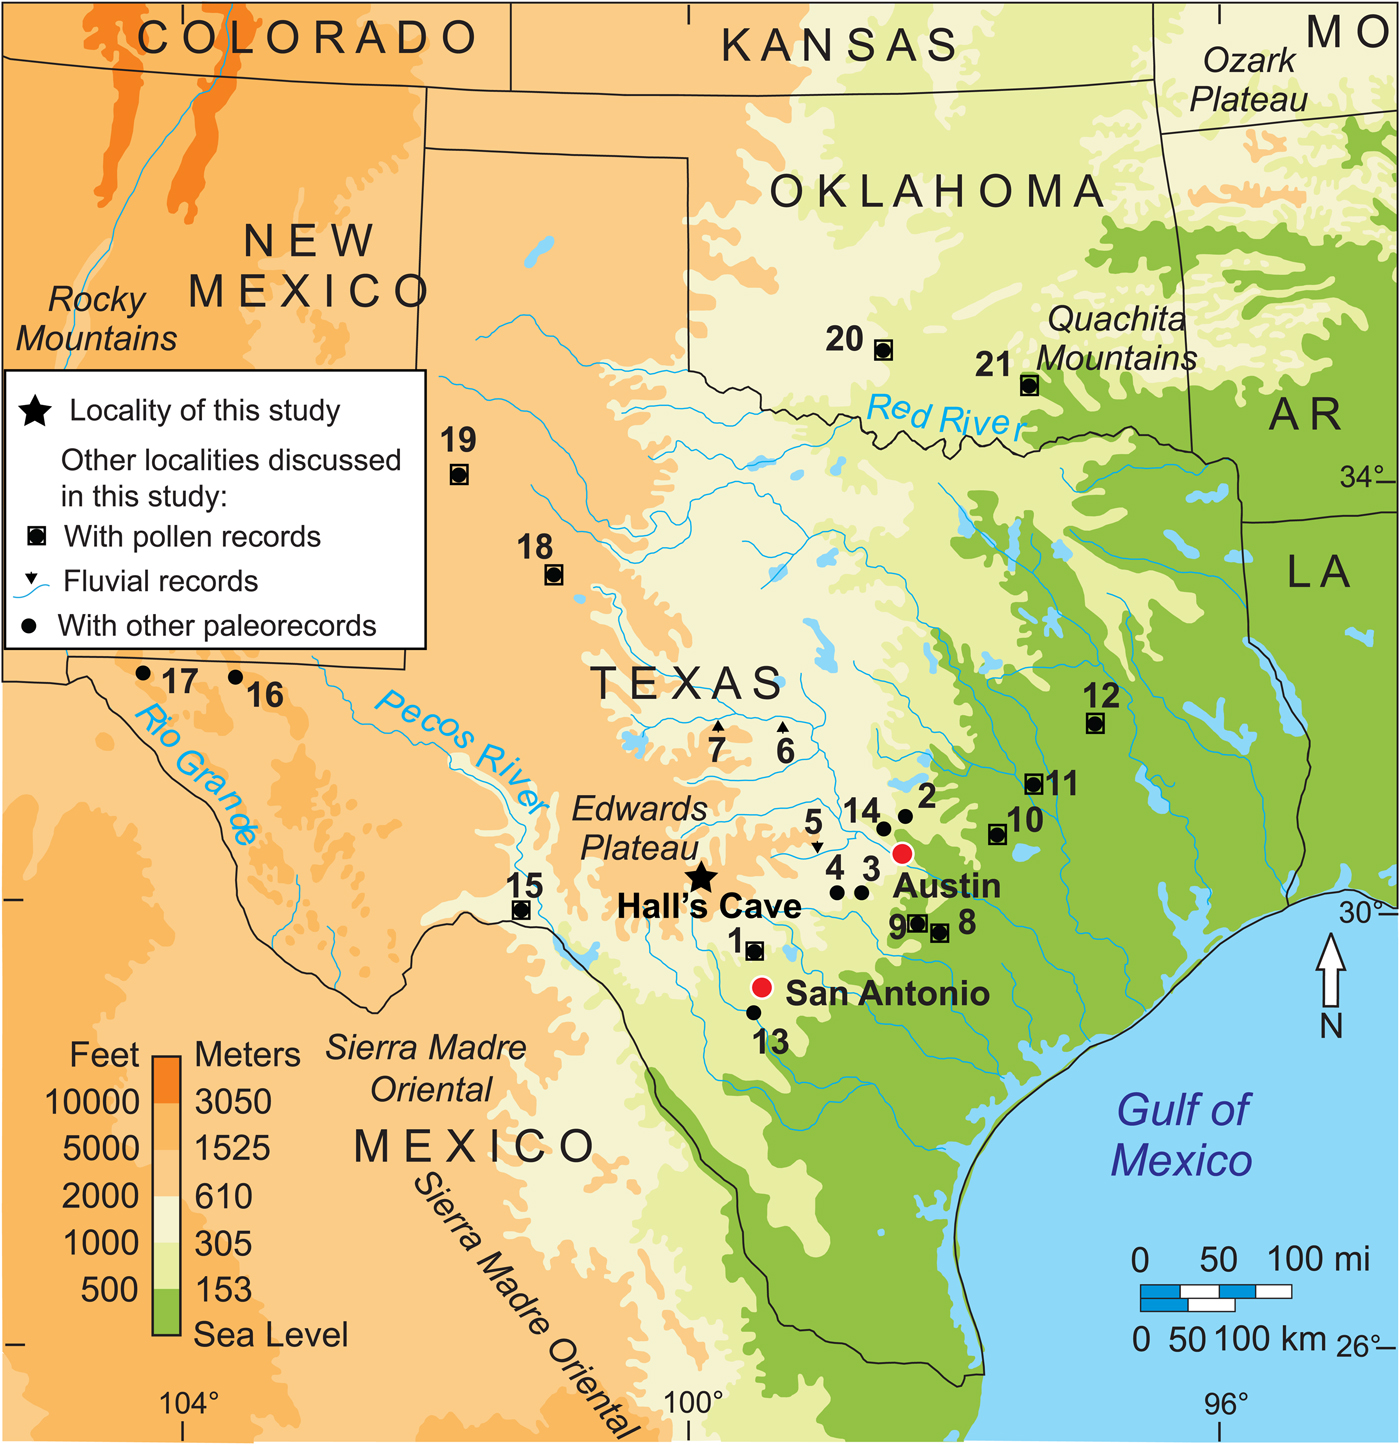
Figure 1. (color online) Location of study area and other pollen records discussed in text: 1, Friesenhahn Cave pollen (Hall and Valastro, Reference Hall and Valastro1995); 2, 3, and 4, central Texas caves speleothems (Musgrove et al., Reference Musgrove, Banner, Mack, Combs, James, Cheng and Edwards2001); 4, Cave Without a Name speleothems (Feng et al., Reference Feng, Hardt, Banner, Meyer, James, Musgrove, Edwards, Cheng and Min2014); 5, Pedernales, 6, Colorado, and 7, Concho rivers fluvial geomorphology (Blum et al., Reference Blum, Toomey and Valastro1994); 8, South Soefje Bog (Bryant, Reference Bryant1977); 9, Hershop Bog (Larson et al.,Reference Larson, Bryant and Patty1972); 10, Boriack Bog pollen (Bryant, Reference Bryant1977; Holloway and Bryant, Reference Holloway and Bryant1984, Boulter et al., Reference Boulter, Bateman and Frederick2010); 11, Gause Bog pollen (Bryant, Reference Bryant1977); 12, Weakly Bog pollen (Holloway et al., Reference Holloway, Raab and Suckenrauth1987); 13, Applewhite Terrace Medina River soil sequence stable carbon isotopes (Nordt et al., Reference Nordt, Boutton, Jacob and Mandel2002); 14, Wilson-Leonard site phytoliths (Fredlund, Reference Fredlund, Collins, Bousman and Bailey1998); 15, Bonfire Shelter pollen (Bryant, Reference Bryant, Wauer and Riskind1978); 16, Guadalupe Mountains botanical remains packrat middens (Van Devender et al., Reference Van Devender, Martin, Phillips, Spaulding, Wauer and Riskind1978); 17, Hueco Mountains botanical remains from packrat middens (Van Devender and Riskind, Reference Van Devender and Riskind1979); 18, Llano Estacado Lakes pollen (Hafsten, Reference Hafsten and Wendorf1961; Oldfield and Schoenwetter, Reference Oldfield, Schoenwetter, F. Wendorf and Hester1975); 19, White Lake pollen (Hall and Valastro, Reference Hall and Valastro1995); 20, Domebo Site pollen (Wilson, Reference Wilson and Leonhardy1966); 21, Ferndale Bog pollen (Albert, Reference Albert1981).
The objective of this study is to integrate pollen, spore, and phytolith data to reconstruct paleovegetation change around Hall's Cave. The reconstruction of paleovegetation resulting from this study is correlated with other paleoclimatic proxies previously obtained from the same sedimentary sequence in the cave, as well as a number of other proxies from the region (Fig. 1) and from sediment records from the Gulf of Mexico. This study contributes first to strengthen the practice of combining pollen, spore, and opal phytolith data for vegetation reconstruction; second, to correlate paleovegetation data with other local paleorecords (e.g., paleofaunal, charcoal, and sedimentation); and third, to define the environmental record of the Pleistocene-Holocene transition in the southern Great Plains vegetation history in the context of broader regional and global climatic developments.
STUDY SITE AND ENVIRONS
Geography, geology, and stratigraphy
Hall's Cave is located near the southern edge of the Edwards Plateau in Kerr County, Texas, at an elevation of 677 m and approximately 7 km north of the North Fork of the Guadalupe River (Fig. 1). The Edwards Plateau consists of calcareous Cretaceous rocks dissected by valleys and exhibiting karstic features such as sinkholes, uvalas, and galleries. Hall's Cave formed in the Late Cretaceous limestone of the Segovia Formation of the Edwards Group (Barnes and Rose, Reference Barnes and Rose1981), below the surface of an upland gently sloping to the east, and the entrance is slightly above (<0.5 m) the trunk channel of a small basin (Fig. 2). Such close vertical and horizontal proximity to the channel to the cave entrance has permitted high-water flow to spill over into the cave (Fig. 2), which explains the importance of the cave sediments as a record of soil erosion in the catchment, the basis of previous studies focusing on soil erosion (Cooke et al., Reference Cooke, Stern, Banner, Mack, Stafford and Toomey2003; Ellwood and Gose, Reference Ellwood and Gose2006).
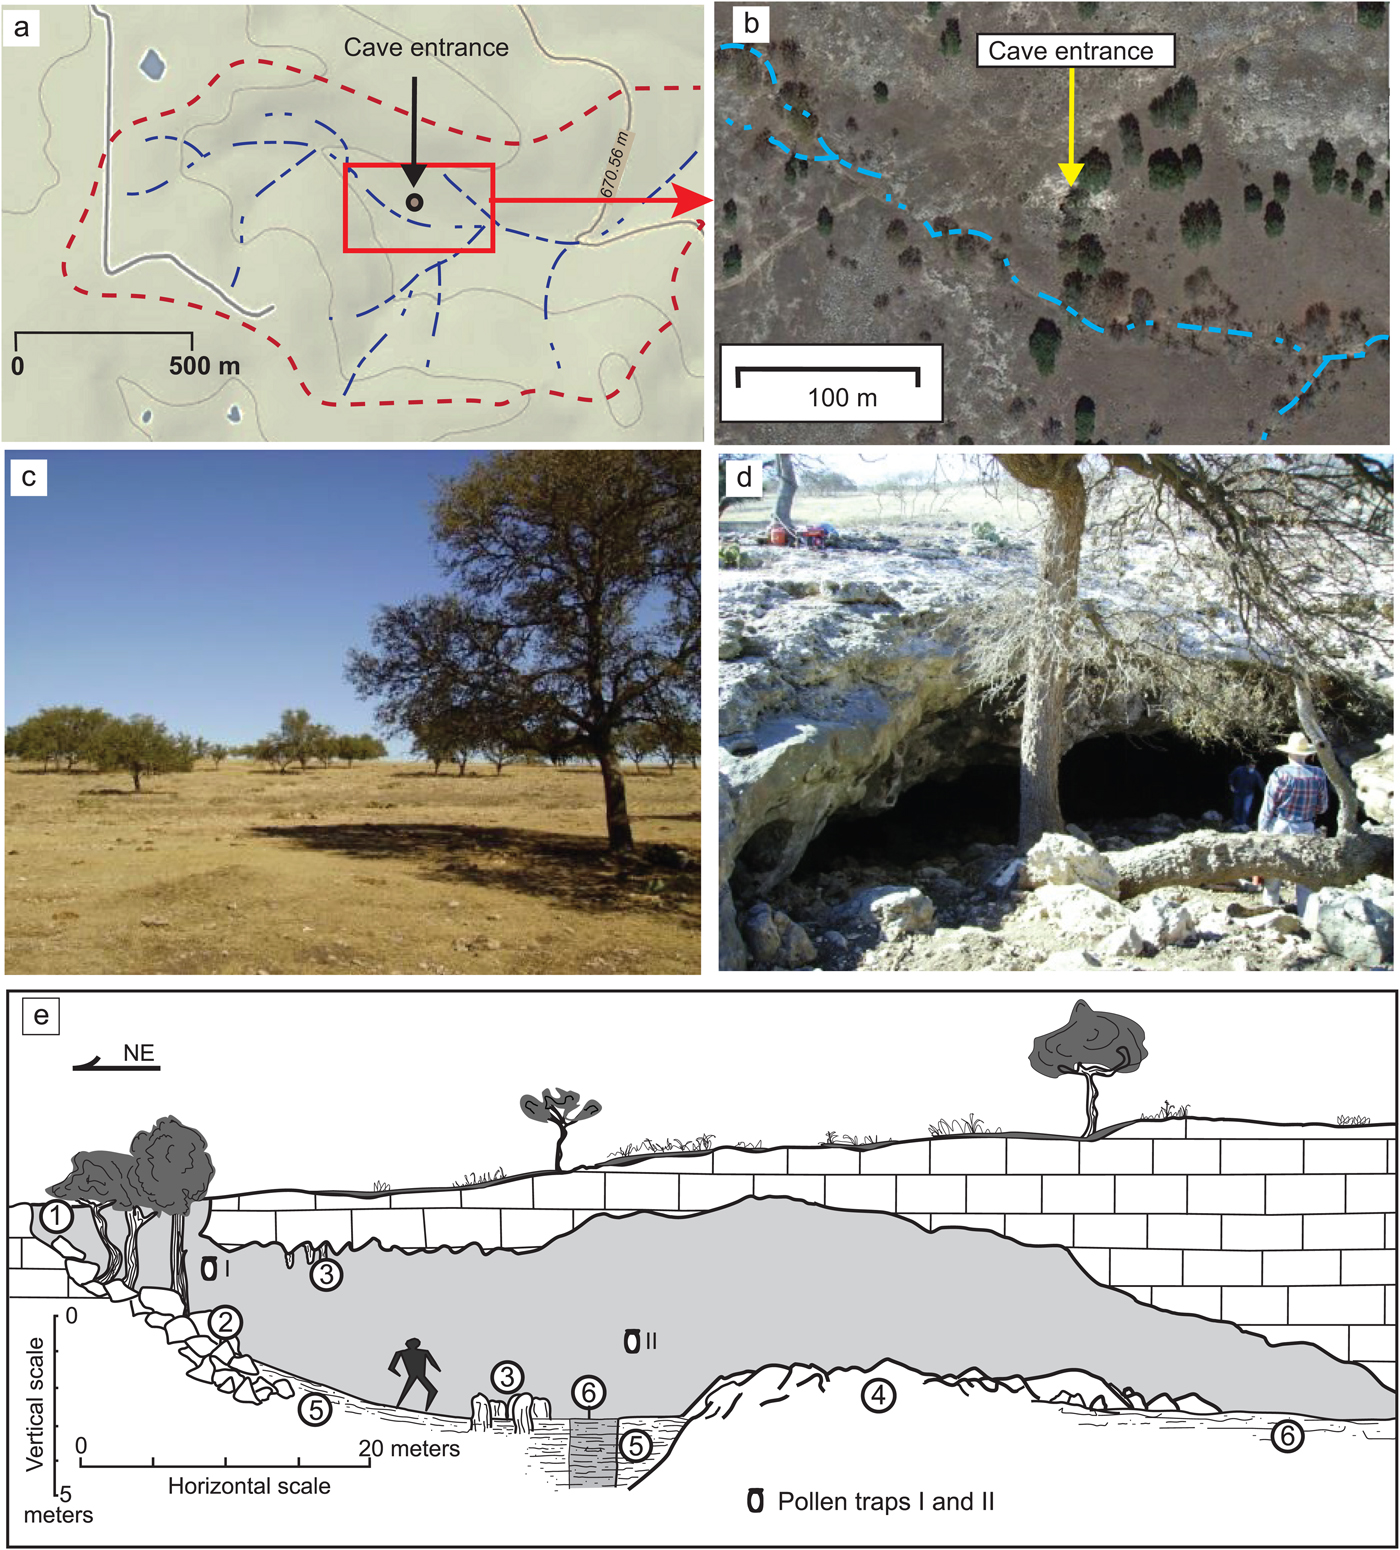
Figure 2. (color online) Hall's Cave location and landscape. (a) Drainage network and topography. (b) Aerial view with adjacent channel (terrain map from Google Maps). (c) View of the landscape to the north of the sinkhole entrance. (d) Sinkhole entrance to the cave. (e) Schematic diagram of the sedimentary section studied in relation to the morphology and dimensions of the cave. The diagram shows the length of the cave from northeast (cave entrance) to southwest. 1, sinkhole entrance; 2, debris cone and collapse blocks; 3, dissolution accumulation; 4, rock fall from roof; 5, sediments; 6, studied sequence.
The entrance of the cave is a single shaft that has apparently widened by collapse (Fig. 2e), but although the time of the widening is unknown, the lack of complete large mammal skeleta (Toomey Reference Toomey1993) suggests that it may have been too narrow until relatively recently. Evidence of human presence near or in the cave exists from about 9 ka in the form of lithic material and burnt surfaces. Nevertheless, it was not until about 2 ka that human occupation in the cave is clearly expressed in the stratigraphy. Therefore, it is postulated that the initial opening of the cave entrance occurred around 9 ka, with the present opening likely dating to about 2 ka or shortly earlier. The pollen record also seems to confirm this scenario, as anomalous pollen occurrences begin sometime after 8 ka, and pollen and phytolith influxes increase significantly after around 2 ka.
Toomey (Reference Toomey1993) described the sediments of the cave in detail and divided the section into four major units and two subunits (Fig. 3), which have been adopted, with minor modifications, for this study. Differences in unit colors are attributed to erosion of different elements of the soilscape outside the cave (Toomey et al., Reference Toomey, Blum and Valastro1993), which is supported in part by other studies on the cave and its environs (e.g., Cooke et al., Reference Cooke, Stern, Banner, Mack, Stafford and Toomey2003; Ellwood and Gose, Reference Ellwood and Gose2006).

Figure 3. Stratigraphy of the study section, showing sample locations. Radiocarbon date information in Supplementary Table 3. Side circle amplifies the sediment structure of unit 3.
Unit 1 (the black unit) consists of a top layer of guano and sheep pellets and a dark-brown deposit of stratified silt loam and pebbles with burned surfaces and hearths, suggesting intensive occupation and disturbance. Unit 2 (dark-brown unit) consists of a series of stratified silt-loam deposits with limestone angular and subangular gravel. In reality, units 1 and 2 may be considered the same unit, with the former simply having a much higher concentration of guano and charcoal (Toomey, Reference Toomey1993). Gravel occurring in both units likely originated from sheetwash deposition and colluvium spreading inward from the entrance.
Unit 3 (brown unit) consists also of a series of alternating silt-loam layers and gravel. A closer examination indicates that most layers grade up from gravel into silt loam (Fig. 3, amplified circle). This unit produced a higher concentration of bone, particularly near its lower part (Toomey, Reference Toomey1993). Chert artifacts are scattered but concentrated toward the top of the unit, where a hearth feature was identified (Toomey, Reference Toomey1993).
Unit 4 (red clay unit) is subdivided into two subunits, 4a and 4b, differentiated primarily by size and shape of the clasts. Toomey (Reference Toomey1993) identified the lower limit of this unit in the composite profile at 205 cm, but we identified it in our sequence between 195 and 200 cm. Toomey (Reference Toomey1993) reported the lowest concentration of chert flakes at the top of unit 4a, whereas unit 4b has a matrix similar in color to that of 4a, but with a slightly larger proportion of sand and abundant larger clasts. Unit 4b accumulated primarily as fragments spalled from the roof of the cave, with only a small proportion of material from the entrance. The bottom of unit 4b lies below our lowermost sample (250 cm), and danger of wall collapse prevented us from sampling the section to the base of the original section (340 cm) sampled by Toomey (Reference Toomey1993).
Modern climate and vegetation
Based on data from the nearest meteorologic station, Kerrville, Texas (1931–2010; U.S. Climate Data, 2011), the mean annual temperature is 18°C with a January high of 16°C and low of 1°C, and an August high and low of 34°C and 21°C, respectively. Mean annual precipitation is 800 mm, with rain all months of the year but with two peaks in May–June and September–October.
Hall's Cave is situated in the Edwards Plateau woodland subregion (3a) of the Edwards Plateau ecoregion, which has been occupied historically by open oak savanna dominated by Quercus fusiformis and Juniperus ashei (Griffith et al., Reference Griffith, Bryce, Omnerik and Rogers2007), with important proportions of Quercus buckleyi and Q. virginiana, and, in heavy soils with overgrazing, mesquite (Prosopis glandulosa) (Armstrong et al., Reference Armstrong, Harmel, Anderegg and Traweek1991). Intermingled among the arboreal species are a number of herbaceous vegetation grass communities consisting of a mix of tall grasses (Panicum virgatum, Sorghastrum nutans, Andropogon gerardii, and Schizachyrium scoparium) and short grasses (mainly Bouteloua curtipendula and B. hirsuta) (Fowler and Dunlap, Reference Fowler and Dunlap1986; Armstrong et al., Reference Armstrong, Harmel, Anderegg and Traweek1991). Although warm-season grasses predominate in area and time of the year, cool-season grasses are not uncommon, principally Nassella leucotricha, Elymus canadensis, and Vulpia octoflora, and various invasive species of Bromus (Riskind and Diamond, Reference Riskind, Diamond, Amos and Gehlbach1988; Armstrong et al., Reference Armstrong, Harmel, Anderegg and Traweek1991; Shaw, Reference Shaw2012). Forbs are abundant and varied, with a predominance of Asteraceae, Fabaceae, Umbelliferae, and Labiatae. In the valleys, woody plants are more common and varied, including riparian elements such as Carya, Fraxinus, Juglans, Platanus, Populus, Salix, and Ulmus (Armstrong et al., Reference Armstrong, Harmel, Anderegg and Traweek1991; Griffith et al., Reference Griffith, Bryce, Omnerik and Rogers2007).
The area immediately around Hall's Cave is an open woodland as described previously, with the arboreal vegetation dominated by Quercus fusiformis and Q. buckleyi (Fig. 2c), though other woody species in the area include Morus rubra, Juniperus ashei, Crataegus sp., and Ilex decidua. In the vicinity of the cave, most grasses observed are Aristida oligantha and A. wrightii, which are primarily a response to overgrazing. Soils around the cave are in general thin, stony, and calcareous, reaching maximum depths of 30 cm in low areas.
METHODS
Sample collection and processing
Samples were collected from a profile exposed, measured, and sampled by Toomey (Reference Toomey1993), using his same datum. The 0 cm datum does not necessarily correspond to the modern, a reason for considering sample −5 cm as the true modern surface sample (Fig. 3). After cleaning the surface of the exposure, samples for pollen and phytoliths were collected at 5 cm intervals, except for those depths that coincided with gravel layers (e.g., 200, 210, 220, and 225 cm) (Fig. 3). All samples produced pollen, except samples at 10, 15, and 125 cm, and all samples produced phytoliths.
Pollen and phytolith samples were processed at the Applied Geoarchaeology and Paleoecology Laboratory (Geography Department) at Oklahoma State University. Samples for pollen were first sieved using a 125 μm mesh, weighed, and washed in 30% HCl for the removal of carbonates and, subsequently, processed using the acetolysis procedure, with Lycopodium spores (Lund University, batch 483216) added as markers and concentration standards. Samples were then stained using Safranin-O and mounted on microscope slides using Entellan as the medium. A minimum of 300 pollen grains was counted for each sample, and spores were also counted but computed separately.
The area of individual microscopic charred particles was measured on the pollen slides. Then, the total area was calculated in relation to Lycopoidium spores counted in the process and the total spores in the tablet in relation to the total weight of the sample. Results are presented as total area of charred particles per gram of sediment.
Opal phytoliths were extracted using a method that combines procedures by Lentfer and Boyd (Reference Lentfer and Boyd1998) and Zhao and Pearsall (Reference Zhao and Pearsall1998) and is described by Joines (Reference Joines2011). This method consisted of sieving sediment samples through 125 μm mesh to produce about 1 g of sample. Carbonates were then removed using 30% HCl, and after neutralization, samples were briefly washed (10 s) in a 10% KOH solution and quickly neutralized by adding deionized water and centrifuging. Clays were deflocculated using a 0.5% solution of NaPO3 and decanted until the supernatant water was clear. Finally, phytoliths were isolated by flotation in a heavy-liquid solution of sodium polytungstate (Na6[H2W12O40]) at density 2.3 and recovered by pipetting the supernatant material in the tube. Samples were oven-dried and mounted on microscope slides using Canada balsam.
To evaluate the modern windblown pollen spectra and phytoliths, two pollen traps were installed in early January 2010 and collected in early January 2011. One pollen trap was positioned at the entrance of the cave, and the other one in the interior of the cave next to the study section (Fig. 2e). To avoid disturbance by sheep, traps were attached to the walls at a height of about 1.75 m above the cave floor. Modern trap samples were processed using 5% KOH for 15 s to remove macroscopic unwanted organics. Isolates were stained with Safranin-O. No Lycopodium markers were used because all pollen and phytoliths in the sample were counted. Results of the modern pollen and phytolith analysis (Supplementary Figs. 1 and 3) are presented and discussed in the Supplementary Materials.
Chronology, data presentation, analysis, and interpretation
The age model used for the sample was obtained with the R-based Bacon 2.2 software (Blaauw and Christen, Reference Blaauw and Christen2011), using the standard IntCal13 calibration curve for the Northern Hemisphere (Supplementary Fig. 3). This age model was developed using 23 accelerator mass spectrometry 14C ages obtained from purified gelatin from bone collagen, humic acids, and charcoal previously published by Cooke et al. (Reference Cooke, Stern, Banner, Mack, Stafford and Toomey2003) (Supplementary Materials). Although only 16 ages fall within the studied layers of the section (Fig. 3), all 23 were used for the model (Supplementary Fig. 3, Supplementary Table 3).
Pollen data from the stratigraphic section are presented as percentages of the total sum of pollen. Because of the large number of taxonomic groups, pollen data were presented in two graphs, one each for arboreal and nonarboreal taxa. Rare taxa were not included, but reported in the total counts (Supplementary Materials).
Pollen data were further organized and plotted using Tiliagraph 2.0.41 software, and pollen zones were determined using the groupings defined by CONISS (constrained incremental sum of squares) in Tiliagraph (Grimm, Reference Grimm1987). Given the large number of pollen taxa, diagrams were categorized into summaries, arboreal, and nonarboreal. Spores, including Sporormiella and other ascospores are also presented in frequencies as a percentage of the total sum of palynomorphs (i.e., pollen, spores, mycorrhizae hyphae, and algal cysts). This approach permitted better assessment of the relationship of spore concentration to that of charred particles, pollen, and phytoliths. Charred particles were also estimated based on the area occupied in the slide, using Lycopodium counts as reference, a method used in previous research (Cordova et al., Reference Cordova, Johnson, Mandel and Palmer2011, Reference Cordova, Scott, Chase and Chevalier2017).
To better assess the distribution of taxonomic groups in relation to possible environmental or climatic trends in the pollen assemblages throughout the section, principal component analysis (PCA) was used through PAleontological STatistics (PAST) 2.17 software (Hammer and Parker, Reference Hammer and Parker2006). Given the disturbance caused by livestock, the modern sample was not included in the analysis. For this analysis, the following taxa were included: Pinus, Picea, Juniperus, Salix, Quercus, Juglans, Carya, Ulmus, Celtis, Moraceae, Rhamnaceae, Alnus, Fraxinus, Ephedra, Poaceae, Amaranthaceae, Eriogonum, Opuntia, Umbelliferae, Onagraceae, Salvia-type, Ambrosia, Artemisia, Asteraceae Tubuliflorae, and Asteraceae Liguliflorae. Aquatic taxa and other taxa with low representation in the profile were excluded. The resulting PCA biplots are presented per sample along with a graph of PC1 and PC2 component scores (all produced PC scores and loadings: Supplementary Materials). Additionally, biplots of selected taxa are presented with an interpretation of the most likely environmental trends.
Modern pollen data from traps are presented as percentage of the total pollen sum recovered from each trap. Spores from the traps are presented as percent of the sum of pollen and spores (Supplementary Fig. 1). Because no Lycopodium spores were introduced to the samples from the modern pollen traps, charcoal was quantified as total area of charcoal in millimeters per sample.
Phytoliths are presented as groups of morphotypes for Poaceae (grasses) and nongraminoids (i.e., dicots) as a percentage of the total sum of phytoliths. Grass silica short cells (GSSCs), which are more diagnostic for determining grass groups (e.g., C3 and C4), are provided in a separate graph as a percent of the total sum of diagnostic GSSCs. To assess the incidence of C3 grasses in a normally C4-dominated ecosystem, the C3/C4 ratio is implemented by dividing the total number of C3 GSSCs by their C4 counterpart. Likewise, to assess the incidence of the two C4 groups, the more mesic Panicoideae and the drought-resistant Chloridoideae, the Panicoideae/Aristiodiodeae ratio was implemented. The C3-C4 ratio is calculated by dividing the diagnostic Pooideae GSSCs by the sum of Panicoideae, Chloridoideae, and Aristidoideae GSSCs and multiplying the result by 100. The Panicoideae/Chloridoideae ratio is calculated by dividing the panicoid GSSCs by the Chloridoideae GSSCs and multiplying the result by 100 (see section 5 in Supplementary Materials). Modern phytoliths extracted from traps were quantified using the same criteria as phytoliths from the sediment sequence. All the phytolith graphs were plotted using the C2 1.7.7 software (Juggins, Reference Juggins2014).
RESULTS
Overview of pollen, spores, and other palynomorphs
Six zones resulted from the clustering produced by CONISS, from bottom to top, zones 1a, 1b, 1c, 2a, 2b, and 3 (Fig. 4). Pollen concentration per gram of sediment varies considerably between 16.5–14 and 8–6 ka. A considerably higher concentration of pollen grains is apparent in zone 2b, mostly after 2 ka. At least three major pollen zones with six subdivisions emerged based on the CONISS tree (Fig. 4). Arboreal pollen (AP) varies considerably with minima below 20% at 18,000, 12,400, and 6400 cal yr BP (Fig. 4). The nonarboreal pollen (NAP) curve does not always follow the grass (Poaceae) vegetation, although periods with declining AP often coincide with high amounts of Poaceae. Aquatics (sum of Cyperaceae, Typha, and Juncaceae) are rare but are more frequent and continuous before 13 ka.

Figure 4. Arboreal, pollen zones, CONISS tree/dendrogram, pollen concentration, selected nonpollen palynomorphs, microscopic charcoal concentration, and organic carbon percent from the study section.
Frequencies of spores and other nonpollen palynomorphs show important variation along the profile (Fig. 4). Monolete spores and Pseudoschizaea cysts tend to be abundant in zones 1a and1b, whereas Cladosporium is more common in the upper zones 2a and 2b. Micorrhizae hyphae appeared only in peaks across the profile and in higher numbers in zones 2a and 2b (Fig. 4). Concentrations of charcoal and the organics increase considerably in the past 2000 yr, coinciding with the increase in Cladosporium and mycorrhizae hyphae.
The AP taxa comprise a variety of trees and shrubs including conifers and broadleaf taxa, as well as species adapted to a variety of climatic conditions and environments (e.g., deep soils, shallow and stony substrate, and heavy soils) (Fig. 5). NAP taxa include a variety of herbs and some aquatic and subaquatic plant taxa (Fig. 6). See details on variation of each group by zone in the next section.

Figure 5. Arboreal (tree and shrub) pollen frequencies from the study section.

Figure 6. Nonarboreal (trees, aquatics, and subaquatics) pollen frequencies from the study section.
Pollen assemblages by zone
Pollen zone 1a (18,100–16,740 cal yr BP)
This zone represents a steady increase in arboreal taxa, the most important of which is Pinus and, to a lesser degree, Salix and Acer. Quercus shows a rapid increase and subsequent steady decline. Juniperus, Juglans, and Ostrya-Carpinus peak in one sample in the middle of this zone but are absent in others. Picea, although minimal (less than 1% near the bottom), also exhibits a decrease (Fig. 5).
The sum of herbaceous pollen, although in decline toward the top of this zone, varies considerably. Dominant taxa in this zone are Asteraceae Tubuliflorae, Artemisia, Poaceae, Amaranthaceae, Ambrosia, and Asteraceae Liguliflorae, but each has high variability within the zone. Artemisia, Asteraceae Liguliflorae, and Poaceae, along with Onagraceae and Trifolium type, peak in the middle of the zone and decline by the top of the zone. Cyperaceae also peaks near the bottom, followed by a sharp decline. Monolete spores and Pseudoschizaea show a considerable upward increase, whereas bryophyte spores, Sporormiella, and mycorrhizae hyphae show little variability in this zone (Fig. 5).
Pollen zone 1b (16,740–14,000 cal yr BP)
As in the underlying zone, AP increases, but considerable changes occur in the trends of individual taxa. The yet dominant Pinus peaks toward the top of this zone, whereas Quercus increases steadily only to drop at the top of the zone. Other tree taxa such as Salix, Juglans, Alnus, and Acer show a slight upward decline, whereas the remainder of the arboreal species have low frequencies and do not reveal any trends.
The sum of nonarboreal taxa, although lower than in the zone below, shows an increase in Ambrosia, Poaceae, Liliaceae, and Cyperaceae. In contrast, Amaranthaceae, Artemisia, and Asteraceae Tubuliflorae frequencies decline but maintain relatively large frequencies. Caryophillaceae and Asteraceae Liguliflorae increase toward the middle of the zone and then decline. Among the spores, the monolete types and the algal cyst Pseudoschizaea show a considerable increase. Bryophytes have no considerable change compared with the layer below, and mycorrhizae hyphae and Sporormiella display peaks within this zone (Fig. 4).
Pollen zone 1c (14,000–12,150 cal yr BP)
In this zone, there is a rapid decline of the sum of AP, reaching its lowest around 12.4 ka, with Pinus as the taxon displaying the most dramatic decline. Another declining taxon is Picea, which disappears completely from the record by 13 ka. In contrast, the frequencies of Quercus and Fraxinus show considerable changes, but their frequencies recover at the top of the zone. Juglans experiences a rapid increase, reaching a peak around 13.2 ka and rapidly declining afterward, disappearing at around 12.2 ka, a trend that Ulmus parallels but in a less abrupt fashion.
The sum of NAP shows an increase in frequencies, with the increase of several taxa, most notably Asteraceae Liguliflorae and Tubuliflorae, and Amaranthaceae. Opuntia (appearing for the first time), Ambrosia, Aster-type, and Cyperaceae present peaks in this zone. All the nonpollen microfossils tend to decline through this time with sediments displaying low organic concentrations (Fig. 4). Cladosporium appears for the first time in the record. Despite being the shortest zone in the sequence, changes are generally abrupt, with prominent peaks and some species disappearing and others appearing in the record.
Pollen zone 2a (12,150–8450 cal yr BP)
The sum of AP increases again, but after two peaks, it falls back to almost the same levels as in the previous zone. In this zone, Quercus overtakes Pinus as the dominant arboreal taxon. Celtis and Fraxinus become more abundant and constant than in any previous zones. Juniperus and Salix remain low but constant. Ulmus is almost absent with the exception of a prominent occurrence at around 9.7 ka. Acer, Rhamnaceae, and Carya are absent in this zone.
The NAP sum increases and declines twice in this zone, and the most conspicuous trend occurs in Umbelliferae and Opuntia, which reach considerable high frequencies toward the end of this zone. Poaceae become important again, but with multiple changes across the zone. Artemisia reaches two high peaks at the beginning of the zone but declines toward the end. By the top of the zone, Amaranthaceae, Umbelliferae, and Asteraceae Tubuliflorae and Liguliflorae constitute the majority of the nonarboreal taxa (Fig. 6). Bryophytes remain without much change, whereas monolete spores decline. Pseudoschizaea, Sporormiella, and mycorrhizae hyphae display a peak at 11.3 ka but remain low or absent at other times within the zone (Fig. 4).
Pollen zone 2b (8450–2300 cal yr BP)
The sum of AP remains relatively low throughout half of this zone, but it slowly increases toward the top. Quercus continues to be the dominant taxon, increasing toward the top of the zone, with Pinus continuing to be the second most abundant taxon, also displaying an upward increase. Juniperus, Celtis, Moraceae, Pyrus, and Fraxinus remain low or absent within the zone but recover at the end (Fig. 7). Other arboreal taxa remain low, with only occasional, but unimportant appearances.
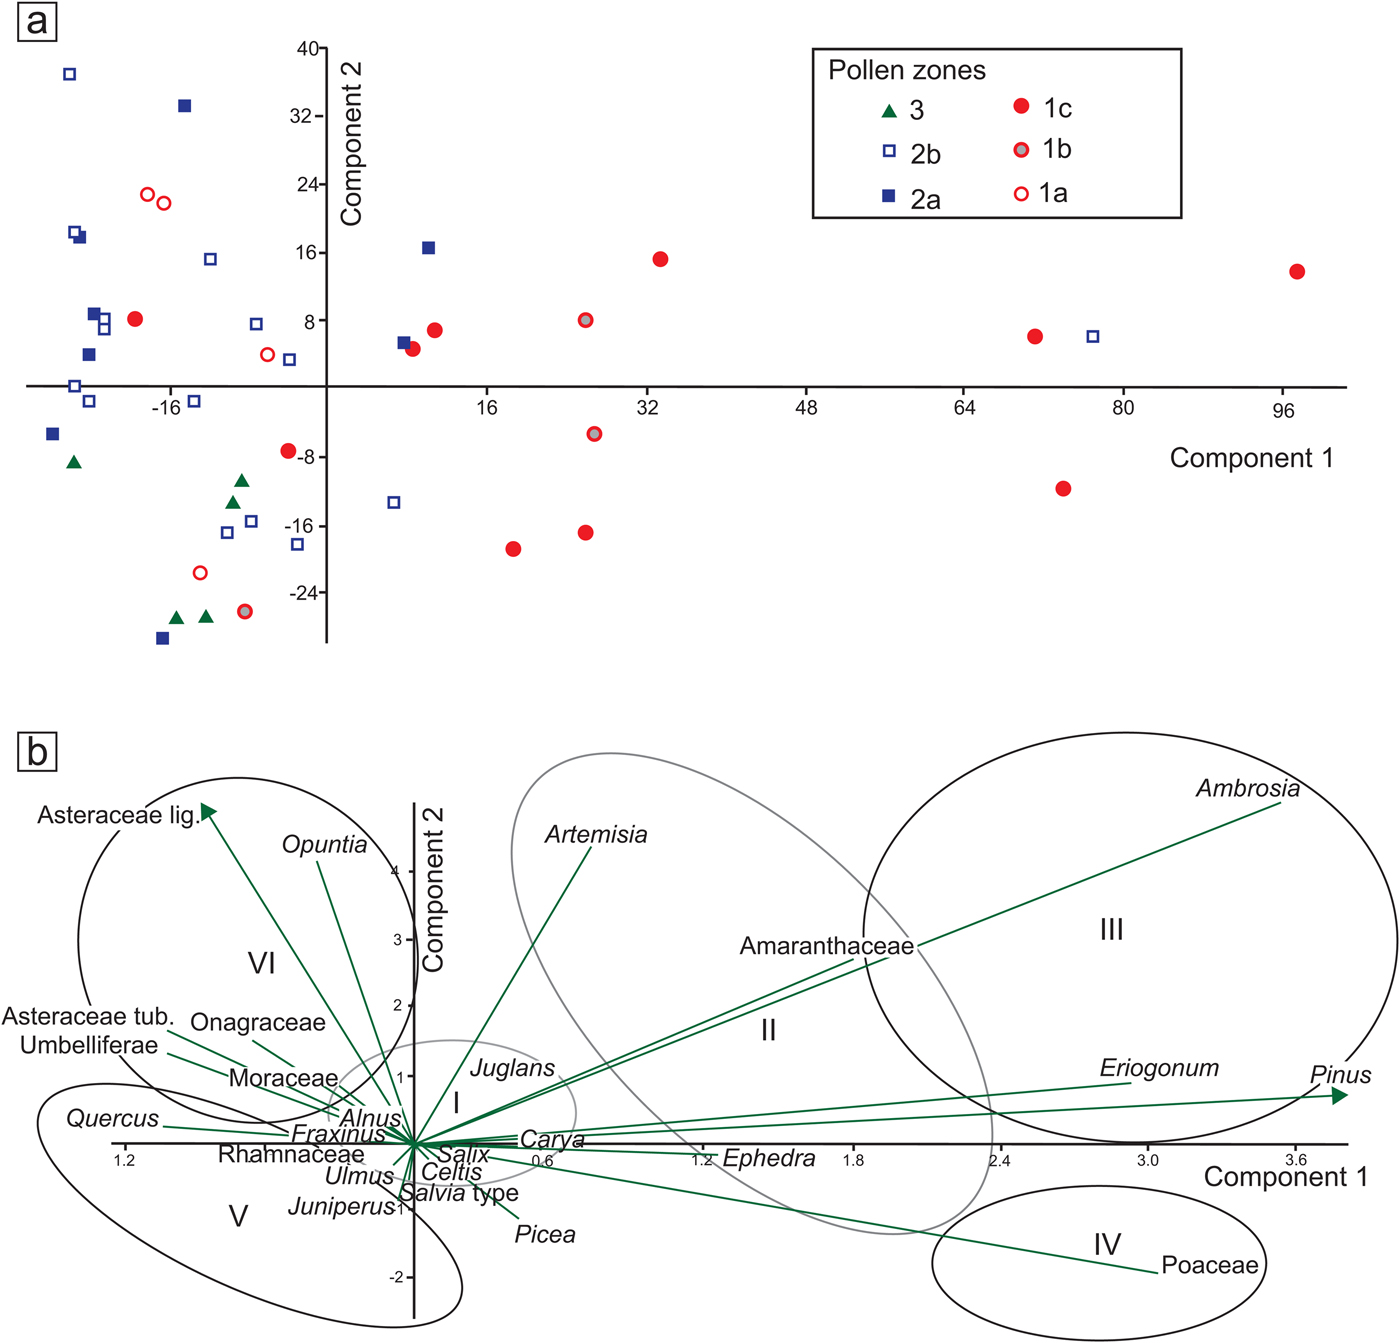
Figure 7. (color online) (a) Principal component analysis (PCA) distribution of samples by pollen zones (see Fig. 4). (b) PCA biplots with selected taxa, grouped according to their relation to PC1 and PC2 axes. I, mesic broadleaf trees; II, dryland shrubs with trend toward colder conditions; III, pioneering, high-stress, or ruderal taxa; IV, open vegetation dominated by grasses, cold or mild-to-dry conditions; V, typical modern woody taxa of the Edwards Plateau, warm and extreme dry and wet cycles; VI, often ruderals, open habitats, some related to human disturbance.
The NAP sum remains high throughout this zone with Asteraceae Liguliflorae, Ambrosia, Poaceae, and Onagraceae as the most abundant taxa. Umbelliferae and Opuntia, abundant at the bottom of this zone, steadily decline toward the top. Amaranthaceae, Eriogonum, Opuntia, Trifolium-type, Ephedra, Solanaceae, and Artemisia show no particular trend but display considerable peaks at different times (Fig. 6). The number of spores in general increases in this zone with Cladosporium becoming apparently abundant and Pseudoschizaea becoming conspicuous again. Mycorrhizae hyphae and charcoal also increase considerably in the record (Fig. 4).
Pollen zone 3 (2300 cal yr BP to present)
This zone displays an unprecedented increase in AP created by an extremely large increase in Quercus pollen, which becomes the dominant arboreal taxon. Other important arboreal taxa include Juniperus, Celtis, and Fraxinus (Fig. 5), though other arboreal taxa display no major changes.
NAP exhibits a decline in many taxa that were abundant in the previous zone. The only taxa with noticeable increases are Amaranthaceae, Ambrosia, and Poaceae, with Opuntia and Salvia-type posting modest increases (Fig. 10). The trend in spores remains similar to that of the previous zone, whereas Sporormiella and charcoal concentration increase considerably (Fig. 8).

Figure 8. Phytolith summaries. EHNO, early Holocene with no apparent human occupation; H1-BA, Heinrich event 1 to Bølling-Allerød; HIO, Holocene with increasing evidence of human occupation; HO, Holocene with strong human occupation; YD, Younger Dryas.
PCA
The first component (PC1, 55.75% variance) of the selected group of taxa reveals changes across the different zones, the most prominent of which occurs in the transition from pollen zone 1b to zone 1c, roughly between 14.4 and 12.7 ka (Supplementary Fig. 4). This change is positive and characterized by high values and high variability along the axis. Another positive value occurs around 4 ka, which is practically perceptible in one sample, perhaps suggesting an outlier value. The remainder of the PC1 curve shows values closer to negative, with significant negative values between 18 and 17.4 ka and again between 12.7 and 11.5 ka. Relatively low and persistent values are apparent between 10 and 5 ka.
The second component (PC2, 16.13% variance) does not show prominent changes, and its values remain mostly negative and close to zero, except for the periods 9–6.5 ka with prominent positive values and 2.5–0 ka with prominent negative values (Supplementary Fig. 4). A noticeable high variability in zone 14.4–12.7 ka (pollen zone 1c) parallels a period of high variability in the PC1 curve (Supplementary Fig. 4).
The distribution of samples by pollen zone displays various trends along the PCA axes (Fig. 7a). Most values concentrate around or below zero along the PC1 axis, except for those of zone 1c, which display long values (Fig. 7a). Along the PC2 axis, variation is much more evenly distributed around 0, except for zone 2a, which tends to appear more on the positive side (Fig. 7a).
The distribution of selected taxa along the PCA axes seems to follow certain patterns with Ambrosia, Eriogonum, Pinus, and Poaceae, with the highest positive values along the PC1 axis (Fig. 7b). Amaranthaceae, Ephedra, and Artemisia also show moderate, though considerably large values. The only relatively low value along the PC1 axis is that of Quercus, Asteraceae Tubuliflorae and Liguliflorae, Umbelliferae, and Opuntia. Many of the taxa with high values seem to be driven more by moisture and temperature and perhaps by certain soil conditions. The negative values may vary between soil conditions and other types of disturbance, with the exception of Quercus, which may also be influenced by climatic conditions opposite to those that drive Pinus, Poaceae, Artemisia, and Ambrosia.
Unlike the PC1 axis, the PC2 axis does not show prominent negative or positive values, but it is noticeable that Asteraceae Liguliflorae and Opuntia seem to have the most prominent negative values followed by Asteraceae Tubuliflorae, Umbelliferae, and Onagraceae, suggesting that all these taxa are indicative of disturbed environments.
Opal phytoliths
Concentrations of phytoliths per gram of sediment sample vary considerably, with the highest concentrations occurring during 9–7 ka and 4–0 ka, and the lowest occurring during 17–15 ka and 12.8–11 ka (Fig. 8). Distributions of general grass and nongrass phytolith morphotypes show little variation across the profile with the exception of the past 2.4 ka, during which grass phytoliths dominate the counts with percentages as high as 80% and 90% (Fig. 8). In all other levels, nongrass morphotypes tend to dominate over grass morphotypes. Among the nongrass morphotypes, those associated with ligneous (woody) plants dominate.
Proportions of grass morphotypes (e.g., short cells, long cells, pointy, and bulliforms) generally show low variation, except between 6 ka and 2 ka, during which short cells (or GSSCs) are low in relation to other grass morphotypes. GSSC percentages appear with the lowest percentages at around 12.5 and 11.4 ka, coinciding with the Younger Dryas (YD) chronozone (Fig. 8).
Individual GSSCs show substantial variation along the profile (Fig. 9). Whereas morphotypes common in the Pooideae grasses vary considerably, they tend overall to be relatively more abundant and diverse before 13 ka. Morphotypes typical of the Chloridoideae grasses are the most abundant of all the taxonomic groups, particularly after 11.5 ka. Morphotypes common in the Panicoideae grasses exhibit much less variation and are low relative to the Chloridoideae and Pooideae, with only a conspicuous peak between 14.5 and 13.3 ka. Long-shank bilobates of the Aristidoideae grasses (see Piperno, Reference Piperno2006, pp. 31–32) are rare throughout the record and practically appear only in the samples about 13.1 ka and subsequently about 4.5 ka.
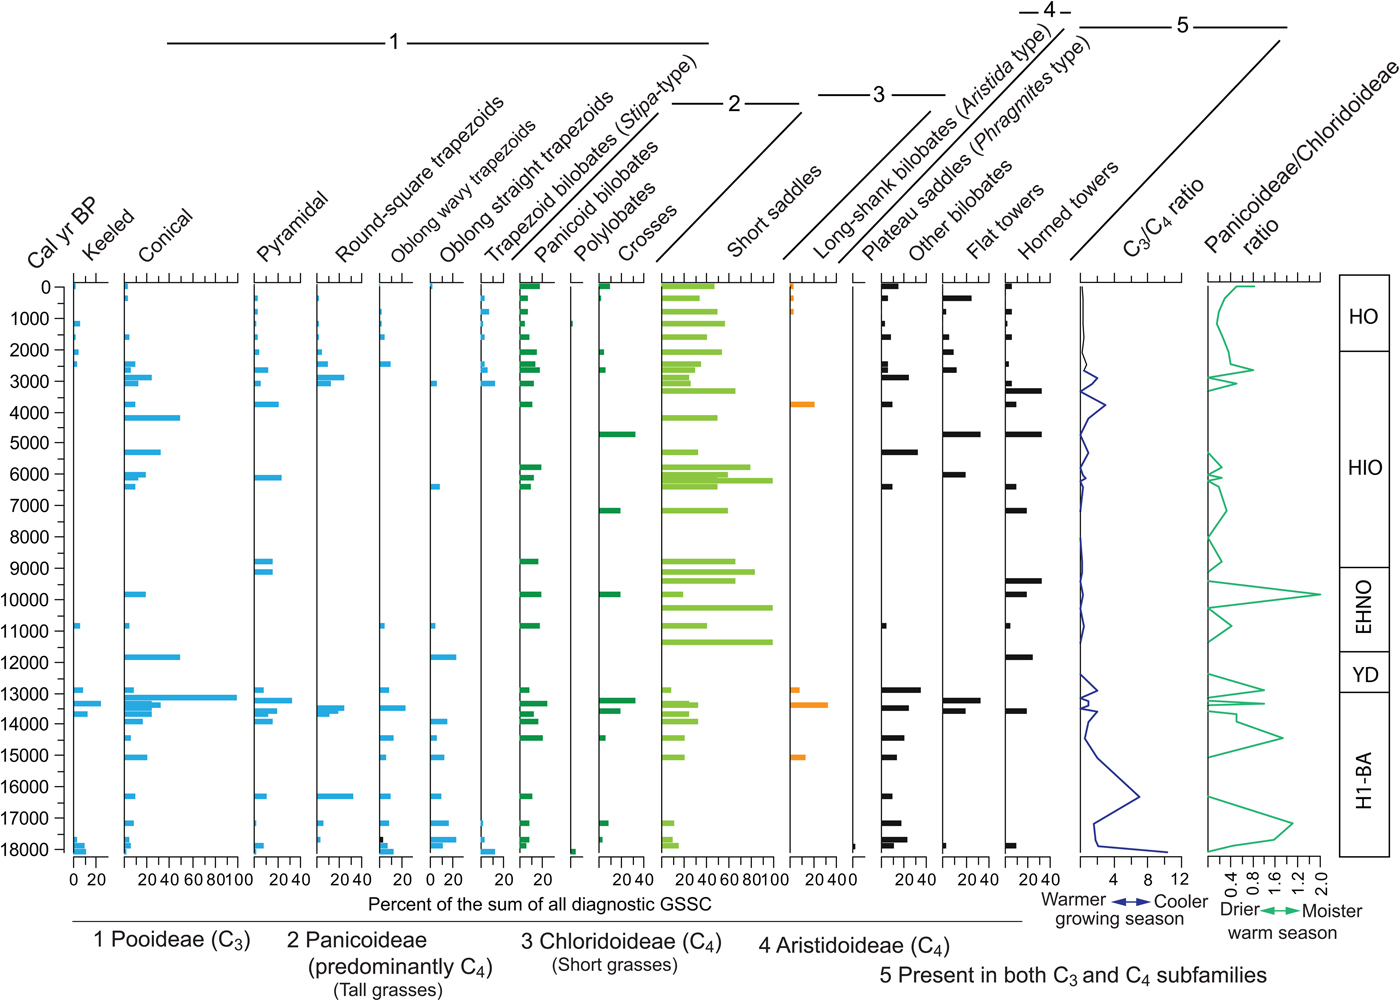
Figure 9. (color online) Phytolith grass silica short cells (GSSC), C3/C4 ratio, and Panicoideae/Chloridoideae ratio. EHNO, early Holocene with no apparent human occupation; H1-BA, Heinrich event 1 to Bølling-Allerød; HIO, Holocene with increasing evidence of human occupation; HO, Holocene with strong human occupation; YD, Younger Dryas.
Other GSSCs that are not typical of a particular taxonomic group have been included in the diagram. Tall saddle types (commonly known as Phragmites-type saddle) appear only in one of the bottom samples. The nondiagnostic bilobate, which could be a malformation of either Panicoideae bilobates or trapezoid bilobates (Stipa-type), has a distribution pattern that parallels closely the Panicoideae and the Pooideae. Remaining individual GSSCs show no particular pattern or trend, suggesting they may be present in more than one grass subfamily.
In order to assess the importance of the most important bioclimatic indicators of the grass subfamilies, two ratios were implemented. The C3/C4 ratio, indicating the predominance of morphotypes of the Pooideae, is relatively high (i.e., cooler temperatures during the growing season), though variable from the bottom of the section to about 12 ka, after which the ratio remains small or zero, displaying small peaks between 5 ka and 3 ka.
The Panicoideae/Chloridoideae ratio shows the relation between the two dominant subfamilies, both growing during the warm season, or under warm conditions. The ratio, which favors the Panicoideae (i.e., higher warm-season rainfall), seems to be highly variable with peaks at around 17 ka, 14.5–12.5 ka, and 10 ka. However, it is important to recognize that Chloridoideae produces the diagnostic short saddle in large amounts (Fredlund and Tieszen, Reference Fredlund and Tieszen1997; Cordova et al., Reference Cordova, Johnson, Mandel and Palmer2011). Therefore, a high value in Panicoideae/Chloridoideae ratio means that Panicoideae grasses have a considerable dominance over Chloridoideae grasses.
DISCUSSION
Taphonomic aspects
Changes in pollen and phytolith assemblages presumably represent vegetation changes in the surroundings led by climate changes and to a lesser extent by herbivores and humans. Some problems with unusual frequencies of certain taxa (e.g., Opuntia and Umbelliferae) and certain phytolith morphotypes (e.g., woody types) in the Holocene layers of the Hall's Cave sequence indicate disturbance by humans. It is therefore important to recognize these problems to discern that part of the record in the cave that is useful for paleoclimatic reconstruction. To that end, in the Supplementary Materials (section 5, “Taphonomic aspects of the plant microfossil record in Hall's Cave”) we discuss some of the taphonomic aspects and also provide a reinterpretation of the Sporormiella and charcoal concentration databases.
Comparison with other records in Hall's Cave
Pollen and phytolith records extracted from Hall's Cave reflect changes in regional and local vegetation, which bear some correlation with other paleoclimatic records recovered in previous studies from Hall's Cave. These include the microfaunal analysis by Toomey (Reference Toomey1993) and Toomey et al. (Reference Toomey, Blum and Valastro1993), MS from the sediments of the cave by Ellwood and Gose (Reference Ellwood and Gose2006), and sedimentation rates (this study, Supplementary Materials). To provide the means to correlate these processes, Figure 10 presents a stack of all these records with the pollen and phytoliths. The description follows top to bottom, but with frequent references to the pollen and phytolith summaries at the bottom of the figure.
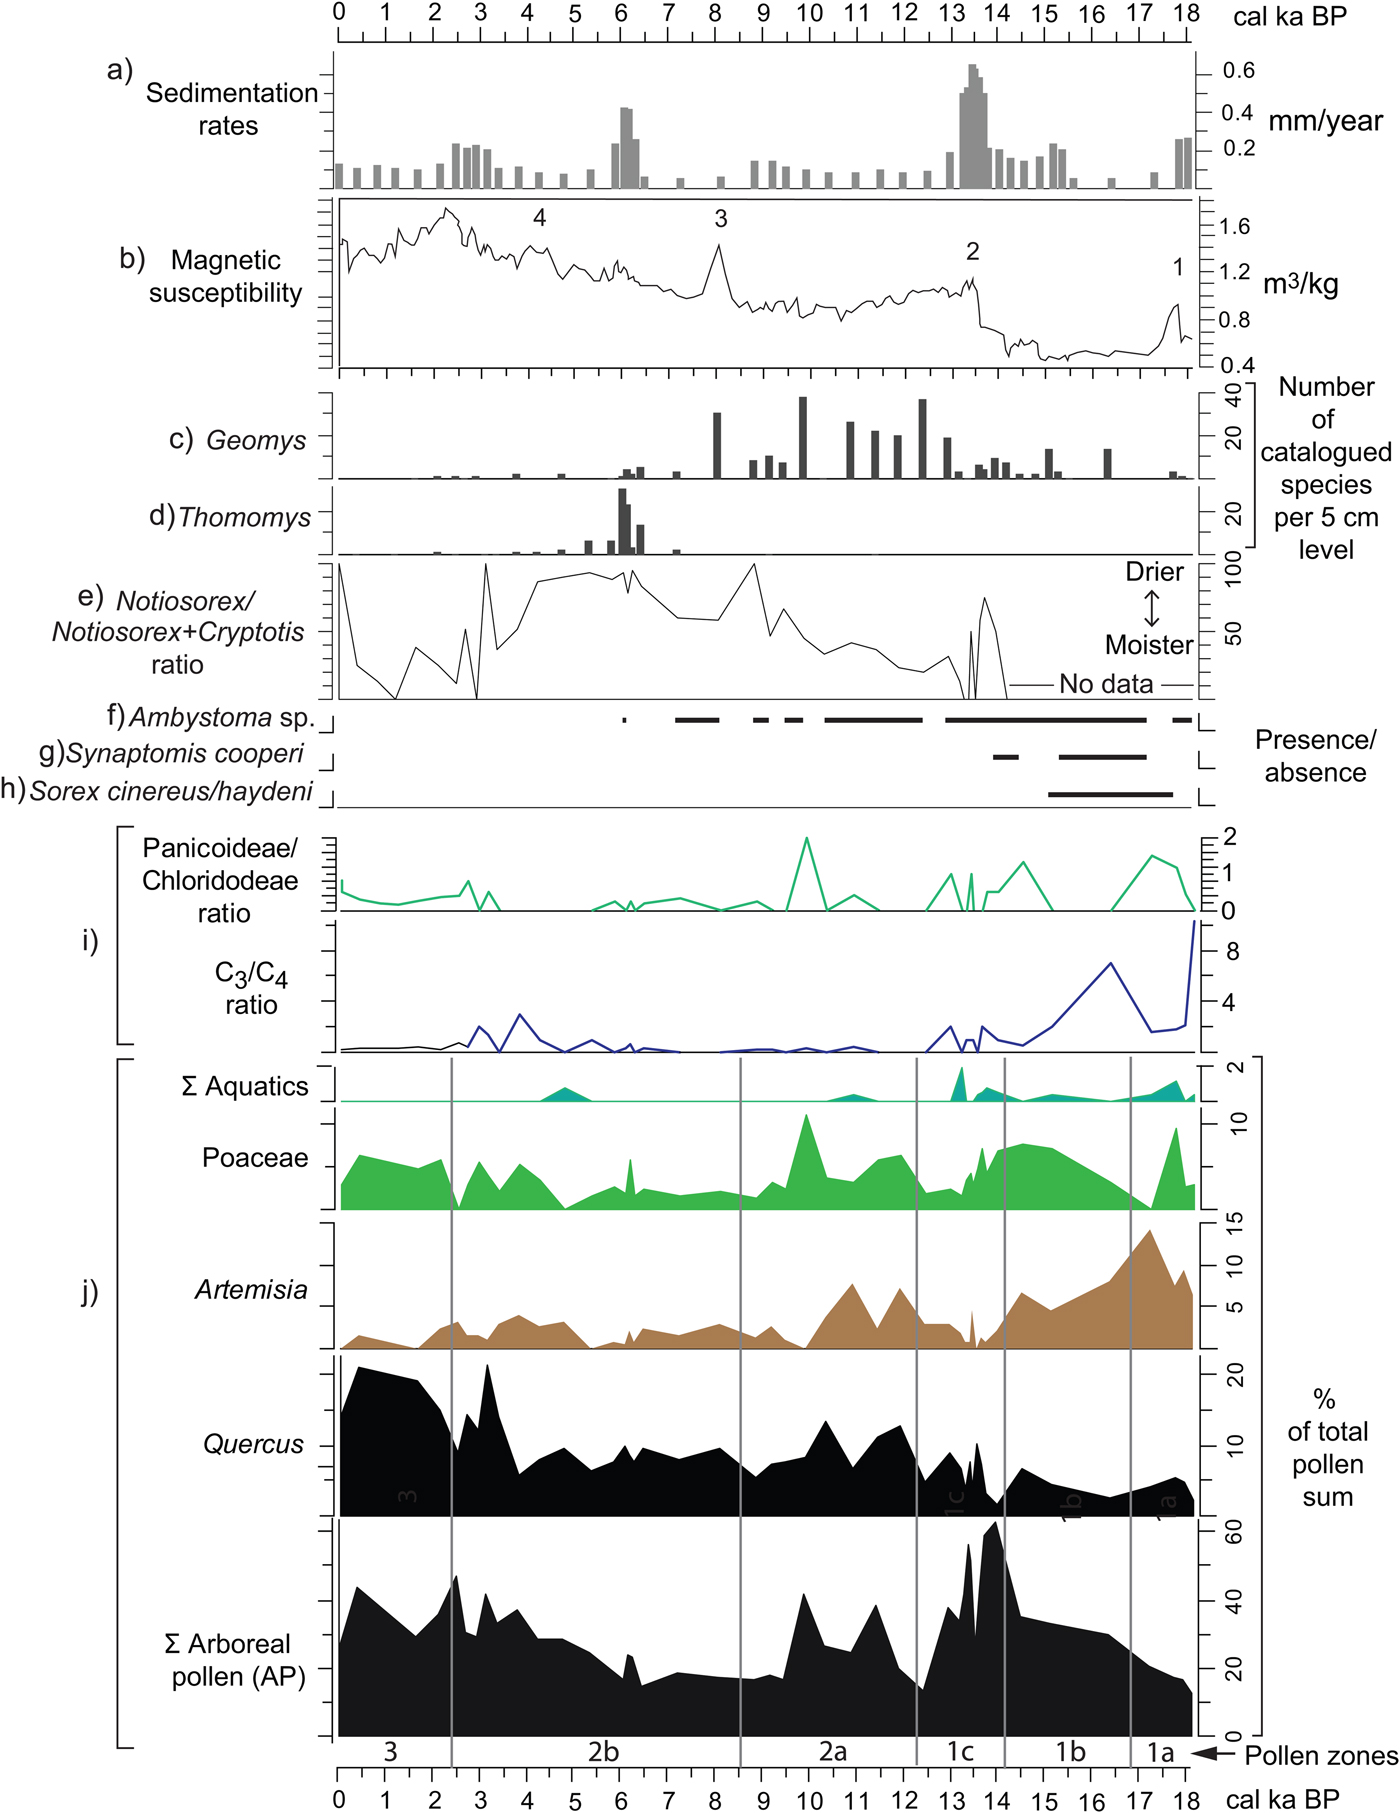
Figure 10. (color online) Correlation of various paleoenvironmental proxies from Hall's Cave. (a) Sedimentation rates (this study). (b) Magnetic susceptibility data (Ellwood and Gose, Reference Ellwood and Gose2006) plotted using the age model of this study. (c–h) Absolute abundances, ratios, and presence/absence of micromammal species from Hall's Cave (Toomey, Reference Toomey1993; Toomey et al., Reference Toomey, Blum and Valastro1993). (i) Grass silica short cells phytolith ratios (Fig. 9). (j) Pollen percentages from selected pollen taxa and pollen groups (this study).
Sedimentation rates of the studied sequence can be interpreted as a proxy for soil erosion intensity outside the cave (Fig. 10a). Toomey et al. (Reference Toomey, Blum and Valastro1993) hypothesized that drying conditions and increased seasonality have accelerated soil erosion, thus increasing sedimentation in the cave, and suggested an increase in soil erosion between 14 and 11 ka. Cooke et al. (Reference Cooke, Stern, Banner, Mack, Stafford and Toomey2003), in a study of soil profiles in proximity to the cave, deduced that soil erosion rates were relatively high through the late Pleistocene but were minimal prior to 5 ka, though no quantitative estimate of variation in rates was presented. Using the age model herein (Supplementary Fig. 1), a time series of sedimentation rates portrays episodes when rapid sedimentation occurred, presumably from erosion of soils in the catchment area adjacent to the cave (Fig. 10a). Notably, Toomey et al. (Reference Toomey, Blum and Valastro1993) proposed intense erosion, particularly with a rapid increase after 14 ka, but their proposed high sedimentation rate in the early Holocene is not borne out by the sedimentation rate curve, as rates remain relatively low until 6 ka (Fig. 10).
The MS record from the cave's sediments provides indications of environmental change purportedly related to climate. Ellwood and Gose (Reference Ellwood and Gose2006) relate peaks or conspicuous changes in MS to abrupt changes linked to climatic events such as Heinrich event 1 (H1) and the 8.2 ka event (peaks 1 and 3, respectively; Fig. 10b). Specifically, they suggest that in limestone-rich areas magnetized particles increase with the decrease of pedogenesis, in this case related to cold and dry events (Ellwood and Gose, Reference Ellwood and Gose2006). Nonetheless, MS peak 2, occurring between 14 and 13 ka (Fig. 10b), coincides with a relatively warmer and moister climate signaled by relative increase of the more mesic C4 Panicoideae grasses (Fig. 10i) and the increase in the percent of tree pollen at the expense of grasses and Artemisia (see pollen summary in Fig. 10j). Although such conditions should lead to pedogenesis, they apparently occur toward the end of the humid phase, suggesting destabilization by a variable or deteriorating climate. Furthermore, although peak 4 seems to be related to the relative cooling and drying of the 4.2 ka event (Ellwood and Gose, Reference Ellwood and Gose2006), its occurrence coincides with the increasing presence of humans in the cave. Thus, the origin of magnetized minerals can have multiple causes, not all necessarily climatically precipitated (Wong et al., Reference Wong, Banner and Musgrove2015).
MS parallels some trends in sedimentation rates, particularly 14–13, 6–5, and 3–2 ka (Fig. 10a and b) suggesting influx of magnetized minerals probably from eroded soils. Furthermore, addition of highly magnetized mineral grains through human activity could account for the notable peaks in the Holocene. For example, the peak at around 2 ka coincides with high incidence of charcoal, organics, and a sediment altered by human occupation of the cave.
The faunal record, however, has some clues about soil development and soil erosion, particularly with the presence of fossorial species, two of which, the smoothed-toothed gophers (Thomomys sp.) and the pocket gophers (Geomys sp.), provide an indication of soil depth in proximity of the cave (Fig. 10c and d). Geomys sp., a species requiring deeper soil, thrives at time of low sedimentation rates, whereas Thomomys sp. thrives during and after peaks of high sedimentation (i.e., high soil erosion rates) (Fig. 10a).
The faunal record presents climatic indicators based on tolerances to moisture and temperature in their modern ranges of distribution (Toomey, Reference Toomey1993). The Notiosorex/Cryptotis ratio reflects the proportions of the desert shrew (Notiosorex crawfordi) relative to the drought-sensitive least shrew (Cryptotis parva), both of which currently have their tolerance limits in central Texas (Toomey et al., Reference Toomey, Blum and Valastro1993). The pollen and phytolith records do not support the aridity signaled by increase in the Notiosorex/Cryptotis ratio between 14 and 13 ka (Fig. 10e). However, the ratio does reflect the increasing persistence of dry conditions in the Holocene, coinciding with the decrease in Panicoideae grasses in favor of the drought resistant Chloridoideae, and with the slight decrease in Quercus pollen frequencies (see phytolith and pollen records in Fig. 10i). Mid-Holocene dry conditions also coincide with the paucity of the mole salamander (Ambystoma sp.) (Fig. 10f), which eventually disappears from the record around 6 ka.
Faunal species absent in Texas today but present in the terminal Pleistocene record of Hall's Cave are good indicators of cooler and moister climates. The masked shrew (Sorex cinereus/haydeni), a species intolerant to high summer temperatures, disappears by 15 ka, coinciding with the sharp drop in C3 grasses and increase in arboreal species (Fig. 10g). The southern bog lemming (Synaptomys cooperi), a species intolerant of high temperatures and dryness, disappears from the Hall's Cave record around 13.8 ka.
At the level of community, the faunal record of Hall's Cave shows a relatively invariable alpha species diversity during the past 22,000 yr except for the period 16 and 11 ka, a time with periods of rapid extinction and climatic changes (Smith et al., Reference Smith, Tomé, Elliott Smith, Lyons, Newsome and Stafford2016). Rapid climate changes are reflected in the relatively abrupt vegetation change evidenced in pollen zone 1b (Figs. 4, 5, and 6) as rapid changes in AP signal the change from a denser cover to a more open vegetation. The variability at which this occurs is reflected in the PC1 axis values at the end of zone 1b and throughout zone 1c (Fig. 7; Supplementary Fig. 4).
Correlation with other regional paleoclimatic and paleoecological records
Vegetation reconstruction and comparison with other regional paleovegetation records
Very few pollen records in the region encompass the deglaciation period (18–10 ka), and they all lack high-resolution dating. It is, however, still possible to compare Hall's Cave pollen record with other regional records. In particular, records that encompass a similar time frame are found in peat bogs in east Texas and southern Oklahoma, and to some degree in other records in west and southwest Texas (Fig. 1).
The AP sum curve in the Hall's Cave record roughly parallels that of the combined AP of Boriack Bog, Weakly Bog, and Hershop Bog in east-central Texas (Fig. 1, localities 10, 8, and 12, respectively), which shows a maximum peak before 13 ka and a modest recovery after 11 ka (cf. Bousman, Reference Bousman1998), as well as in data from a subsequent core (Boulter et al., Reference Boulter, Bateman and Frederick2010). This trend is similar to that of other east Texas peat bogs records but is less similar to that of the two Oklahoma localities (Fig. 1, localities 21 and 22) (cf. Wilson, Reference Wilson and Leonhardy1966; Albert, Reference Albert1981). The Poaceae pollen curve in Hall's Cave has its highest frequencies 18–10 ka and lowest 9–5 ka, which contrasts with the Poaceae curve in pollen records in east Texas (cf. Bryant, Reference Bryant1977; Bousman, Reference Bousman1998; Boulter et al., Reference Boulter, Bateman and Frederick2010). It appears that the dry hypsithermal climate favored the increase of grasses over trees in Boriack Bog (Bousman, Reference Bousman1998), but not around Hall's Cave, where Asteraceae Tubuliflorae, Ambrosia, and other NAP taxa were more prominent than Poaceae (Fig. 6).
In records west and southwest of Hall's Cave, the arboreal component (conifers and oak) appears more prominent during the LGM and early part of the deglaciation and is gradually replaced with grasses or desert vegetation by the beginning of the Holocene (cf. Bryant and Holloway, Reference Bryant, Holloway, Bryant and Holloway1985). Thus, the comparison between AP and Poaceae in the regional context (i.e., Texas) suggests that post-LGM arboreal vegetation development at Hall's Cave was midway between that of east and west Texas.
During deglaciation, Hall's Cave record portrays a dominance of an open woodland between 18 and 14.5 ka, with herbaceous species such as Poaceae, Artemisia, Ambrosia, high-spine Asteraceae (i.e., Tubuliflorae), and arboreal species such as Quercus and possibly Pinus. Picea on the Edwards Plateau and, in general, Texas is questionable on the grounds of long-distance transportation and differential preservation (see Bryant and Holloway, Reference Bryant, Holloway, Bryant and Holloway1985; Hall and Valastro, Reference Hall and Valastro1995).
The incidence of Picea in the pollen record of Hall's Cave (Fig. 5) is small, but relatively significant: average frequency is 2.4% with a conspicuous peak of 6% around 13.5 ka, immediately prior to disappearing from the record. Reports of Picea pollen in late Pleistocene records occur across Texas, including the peat bogs in east Texas (Fig. 1, localities 8 through 11) with variable percentages of Picea, which is common in other records of the southeastern United States (Watts, Reference Watts1980; Holloway and Bryant, Reference Holloway and Bryant1984; Bryant and Holloway, Reference Bryant, Holloway, Bryant and Holloway1985). Pollen records in southwest and west Texas also exhibit relatively significant concentrations of Picea (Hafsten, Reference Hafsten and Wendorf1961; Oldfield and Schoenwetter, Reference Oldfield, Schoenwetter, F. Wendorf and Hester1975; Bryant, Reference Bryant, Wauer and Riskind1978; Bryant and Holloway, Reference Bryant, Holloway, Bryant and Holloway1985). Yet, it is not clear whether Picea was on or near the sampled localities (Holliday, Reference Holliday1987; Hall, Reference Hall2001). Of the numerous records of botanical remains recovered from packrat middens in west and southwest Texas, Picea (cf. P. engelmannii) is reported only at Williams Cave at an elevation of 1500 m above mean sea level (amsl) in the Guadalupe Mountains (Fig. 1, locality 16), where Picea occurs before 11,000 14C yr BP (about 13,000 cal yr BP) along with Abies and Pseudotsuga (Van Devender et al., Reference Van Devender, Martin, Phillips, Spaulding, Wauer and Riskind1978; Van Devender, Reference Van Devender, Betancourt, Van Devender and Martin1990). Given the maximum elevation of the Guadalupe Mountains (2667 m amsl), it is possible that conditions were sufficiently cold and moist to sustain both Abies and Picea; Pseudotsuga still grows in the area.
Most relevant to the record at Hall's Cave is the occurrence of Picea (1%) at Friesenhahn Cave, also located on the southeastern edge of the Edwards Plateau (Fig. 1, locality 1). Although numerical dating is not sequential at that site, Picea appears in deposits between about 14,010 ± 3010 and 19,600 ± 710 14C yr BP (Tx-2395, bone apatite and bone collagen ages, respectively) (Hall and Valastro, Reference Hall and Valastro1995), which calibrate (IntCal13.4c; 1-sigma) to between 24,043 and 12,963 cal yr BP, a very long interval indeed. Another locality with traces of Picea in the terminal Pleistocene is Bonfire Shelter, on the Rio Grande (Fig. 1, locality 14), where chronological resolution does not permit determination of the exact time for this occurrence, which can only be top-bracketed by an age of 10,230 ± 160 14C yr BP (Bryant and Holloway, Reference Bryant, Holloway, Bryant and Holloway1985), calibrating to 11,625–12,378 cal yr BP (IntCal13.4c).
Despite its presence in the record, it is unlikely that Picea grew anywhere near Hall's Cave or even on the Edwards Plateau, but rather at higher areas in the broader region such as the southern Rockies of New Mexico, where it has been widely reported (Hall, Reference Hall, Lucas, Morgan and Zeigler2005), and the mountain ranges (i.e., Sierra Madre Occidental and Sierra Madre Oriental) in northern Mexico. P. engelmannii, which today grows in the mountains of New Mexico, is found in isolated stands in the Sierra Madre Occidental of Mexico. If Picea attained a greater extension during cold phases, it could have contributed more pollen grains, particularly being on the path of westerly wind flow. The Sierra Madre Oriental, the Mexican mountain range geographically closer to Hall's Cave (Fig. 1), has elevations greater than 3500 m amsl, where today two species of Picea (P. martinezii and P. mexicana) grow (Ledig et al., Reference Ledig, Mápula-Larreta, Bermejo-Velázquez, Reyes-Hernández, Flores-López and Capó-Arteaga2000, Reference Ledig, Rehfeldt, Sáenz-Romero and Flores-Lopez2010). However, the dearth of terminal Pleistocene pollen records in the Sierra Madre Oriental and adjacent regions hinders a proper assessment of the extent of the Picea in northern Mexico during the LGM and deglaciation.
Pinus pollen is relatively abundant in most records within Texas (Bryant and Holloway, Reference Bryant, Holloway, Bryant and Holloway1985), which may be the result of far-flung air transport and differential preservation, just as with Picea pollen. The considerably larger numbers of pine in the Hall's Cave record suggest perhaps that pines existed locally on the Edwards Plateau. Today, Pinus is rare in this region, except for a few areas where isolated stands and individuals of Pinus remota exist (Farjon, Reference Farjon2013). This species is considered by some a subspecies of Pinus cembroides (includes the varieties of pinyon pine), which is more prevalent in the mountains of west Texas and in the Southwest and northern Mexico in general (Lanner et al., Reference Lanner, Van Devender, Richardson and Richardson1998; Farjon, Reference Farjon2010, Reference Farjon2013). However, it is difficult to ascertain if the modern stands of P. remota on the Edwards Plateau are relicts of a much larger community, or if other eastern pine species had their glacial refugia in this region. Remains of P. remota appear in almost all terminal Pleistocene records from packrat middens of west Texas and northern Mexico, including low areas along the Rio Grande (Van Devender, Reference Van Devender, Betancourt, Van Devender and Martin1990; Lanner et al., Reference Lanner, Van Devender, Richardson and Richardson1998). It is then probable that P. remota could have been also widespread in the western and southwestern part of the Edwards Plateau.
Among the typical full-glacial trees recorded in peat bog records of east Texas (Bryant and Holloway, Reference Bryant, Holloway, Bryant and Holloway1985; Boulter et al., Reference Boulter, Bateman and Frederick2010) is Betula, which is totally absent in the Hall's Cave record or other pollen records in south-central, south, and west Texas. Acer appears in small amounts, but its determination to species was not possible, eliminating the possibility to assert a refugium of Acer saccharum or any other subboreal species.
Traces of Ostrya-Carpinus appear in the records of east-central Texas only in the terminal Pleistocene, that is before about 10 ka at Gause Bog (Bryant and Holloway, Reference Bryant, Holloway, Bryant and Holloway1985) and Boriack Bog (Boulter et al., Reference Boulter, Bateman and Frederick2010) (Fig. 1, localities 9 and 11). In Hall's Cave, traces of Ostrya-Carpinus occur 18–14 ka, suggesting a proximal refugial location. Today, Ostrya virginiana and Carpinus caroliniana are absent from the broad region (i.e., the Edwards Plateau), with the nearest locations in far eastern Texas and on eastern slopes of the Sierra Madre Oriental of Mexico (Rzedowski, Reference Rzedowski1981; Thompson et al., Reference Thompson, Anderson and Bartlein1999). Similarly, Liquidambar is probably refugial and is reported in the terminal Pleistocene record at Friesenhahn Cave (Hall and Valastro, Reference Hall and Valastro1995), whereas at Hall's Cave, Liquidambar (<1%) appears mostly before 13 ka (Fig. 5). Like Ostrya and Carpinus, the modern distribution of Liquidambar (i.e., L. styraciflua) is present only in far eastern Texas and the Sierra Madre Oriental of Mexico (Rzedowski, Reference Rzedowski1981; Thompson et al., Reference Thompson, Anderson and Bartlein1999). Interestingly, the Liquidambar presence before 13 ka in the pollen records and absence in the region during the Holocene and at present suggest that these three tree taxa had a glacial refugium in the canyons cutting through the Edwards Plateau.
The Bølling-Allerød (BA) chronozone (14.7–12.9 ka) is evident in the Hall's Cave profile and is expressed as an increase in broadleaf tree species, notably Quercus, Ulmus, and Juglans (Fig. 5). However, the high AP frequencies are variable, displaying a peak about 14 ka, a short decline, and subsequent recovery before 13 ka. If this is a regional trend, it is not clear because of the poor age resolution of other pollen records for this period. However, Boriack Bog (Bryant, Reference Bryant1977) (Fig. 1, locality 10) AP counts suggest a moderate increase around 15 ka, a decline around 14 ka, and rapid increase shortly before 13 ka (Bousman Reference Bousman1998), which, despite being displaced relative to the Hall's Cave record because of low age resolution, shows a similar trend. A second profile from the same peat bog indicates an increase around 14 ka followed by a steady decline (Boulter et al., Reference Boulter, Bateman and Frederick2010), but with no second peak before 13 ka.
Despite the variability, the pollen record at Hall's Cave for the BA suggests more humid and warmer conditions than the previous period, which is supported not only by yet relatively high levels of C3 grasses, but also by the dominance of Panicoideae, the most common C4 grass (Fig. 9). Of note, the prevalence of Panicoideae suggests increased moisture in the warm season.
The YD chronozone (12.9–11.7 ka) appears to be expressed as a reduction of AP, and an increase of Artemisia (Fig. 6), which would suggest perhaps drier conditions. Unfortunately, the low amounts and poor preservation of GSSCs do not express any particular trend during the YD. However, in the regional study by Cooke et al. (Reference Cooke, Stern, Banner, Mack, Stafford and Toomey2003) and the subsequent MS data presented by Ellwood and Gose (Reference Ellwood and Gose2006), the YD represents a period of intense erosion, rendering sediments in the cave as a mixture of different soil horizons. Further, this mode of erosion and deposition probably contributed to the entraining and destruction of grass phytoliths and to their low concentration in that interval of the record. These processes may not have affected the pollen record, as pollen was largely deposited by wind and animal activities. It is difficult to correlate the YD record in Hall's Cave with other records in Texas in part because of their poor age resolution. Moreover, although most records reported for the east Texas bogs attribute the gradual shift from open to more forested environments to the YD (cf. Bousman, Reference Bousman1998), at Hall's Cave the increase in AP after the YD is steep, only to drop again by 9.5 ka.
The associated dryness of the hypsithermal, evident in many places in the southern Great Plains (Bousman, Reference Bousman1998; Nordt et al., Reference Nordt, Boutton, Jacob and Mandel2002, Reference Nordt, Von Fischer, Tieszen and Tubbs2008), is detectable in the Hall's Cave pollen record as lows in the AP (Fig. 10j) and as increases in NAP, particularly the Asteraceae (Fig. 10). The PC1 curve displays low values throughout the early and middle Holocene (Supplementary Fig. 4), which seem more associated with taxa adapted to warm and dry conditions (Fig. 7). The dry and warm conditions of the hypsithermal are also represented in the GSSC record, as relative dominance of the Chloridoideae over the Panicoideae (i.e., tall grasses) and the relatively low and sporadic appearance of the C3 grasses (i.e., cool-season grasses) suggest a dry hypsithermal in this region (Fig. 2). The trend to an increase in Chloridoideae grasses in the Holocene is also evident in the phytolith record at the Wilson Leonard site (Fig. 1, locality 20) (Fredlund, Reference Fredlund, Collins, Bousman and Bailey1998).
The sequence of δ13C data from paleosols and alluvial sediments of the Applewhite Terrace at the Richard Beene site (Fig. 1, locality 13) comprises several soils developed in alluvium spanning from 18 ka to the late Holocene from which values of δ13C VPDB of SOC (Vienna Pee Dee Belemnite of soil organic matter) serve as a proxy for the percent of C4 plants (Nordt et al., Reference Nordt, Boutton, Jacob and Mandel2002). These isotope data display a rapid increase in C4 plants 17–16 ka, which coincides with the reduction of AP and increase in C4 Panicoideae grasses at Hall's Cave (Fig. 9). The subsequent decrease of C4 in favor of C3 plants about 14–13 ka coincides with the prominent increase in arboreal taxa and return of some C3 grasses (Fig. 9). Subsequently, the percent of C4 plants increases rapidly, reaching a relatively high value (60%) about 11 ka and continued dominance throughout the Holocene, where some discrepancies with the phytolith record of Hall's Cave exist. In this case, it is important to bear in mind that the δ13C data from the Applewhite Terrace paleosols reflect vegetation of the lowland of the then floodplain of the Medina River with purportedly more moisture, whereas the Hall's Cave data record the local vegetation of an upland with drier soils.
Correlation with other terrestrial records
Geomorphic change indicated in the alluvial records from the Colorado, Pedernales, and Guadalupe Rivers (Fig. 1, localities 2, 6, and 7) provides a broad view of fluvial responses to climate-driven landscape change (Blum et al., Reference Blum, Toomey and Valastro1994; Toomey et al., Reference Toomey, Blum and Valastro1993). From about 20 to 14 ka, aggradation and sediment storage dominate as evidenced by extensive floodplain formation within these river valleys; from 14 to 11 ka, valley incision dominates; but, subsequently, throughout the early and middle Holocene, episodes of aggradation and incision occur, resulting in the narrow floodplains that characterize the rivers today (Blum et al., Reference Blum, Toomey and Valastro1994). An interesting aspect of this record is that sedimentation rates and MS in the cave (Fig. 10) reflect the process of upland soil denudation, which by 13 ka may have led to destabilization of the floodplains. This unstable period is also reflected in the rapid changes in vegetation shown by PC1 (Fig. 10). Furthermore, Juglans, a species with a preference for deep loamy soils, may be responding to changes in valley sedimentation, and data indicate that Juglans appeared stable until around 14.5 ka and subsequently increased until a rapid decline and ultimate disappearance by 12.5 ka (Fig. 5). This temporal pattern may be the response of rapid accumulation of sediments in valleys followed by the rapid incision identified by Blum et al. (Reference Blum, Toomey and Valastro1994). Subsequent appearances of Juglans through the Holocene are likely related to the periods of aggradation and soil formation alternating with those of channel incision periods.
Speleothem records from several localities in the southeastern part of the Edwards Plateau (Fig. 1, localities 3, 4, and 5) provide a measure of moisture based on the rate of stalagmite growth (Musgrove et al., Reference Musgrove, Banner, Mack, Combs, James, Cheng and Edwards2001). These data indicate relatively high speleothem growth rates during the LGM, followed by a large increase between 16 and 13 ka, then a second decline, and an increase again between 13 and 9 ka, followed by a considerable decline throughout the Holocene. Musgrove et al. (Reference Musgrove, Banner, Mack, Combs, James, Cheng and Edwards2001) interpreted these changes to secular and millennial changes in effective precipitation, rather than precipitation amounts. Based on this study, Cooke et al. (Reference Cooke, Stern, Banner, Mack, Stafford and Toomey2003) suggested that the high effective precipitation (i.e., relatively low temperatures) and moderate seasonal temperature change prior to 13 ka were conducive to the formation of thick soils, whereas the less effective and more seasonal precipitation changes afterward were conducive to soil erosion. Sedimentation rates and MS in the sediments in Hall's Cave record support this scenario.
Later studies using modern dripping rates in caves and air-CO2 suggest that dripping rates are associated more with rainfall seasonality and seasonal amplitude of temperatures and the rate of denudation of the soil (cf. Banner et al., Reference Banner, Guilfoyle, James, Stern and Musgrove2007; Wong et al., Reference Wong, Banner and Musgrove2015). Feng et al. (Reference Feng, Hardt, Banner, Meyer, James, Musgrove, Edwards, Cheng and Min2014) obtained speleothem data from Cave Without a Name (Fig. 1, locality 4), which they compared with a broader regional record encompassing the two main sources of precipitation, the Gulf of Mexico and the Pacific Ocean. Their results suggested that that dripping rates and δ18O values depended also on the influence of rainfall from the Gulf of Mexico, which varied with sea surface temperatures (SSTs). Accordingly, the increase in rain that originated from the Gulf of Mexico during the deglaciation increased as SST increased, reaching a maximum during the BA. This trend is reflected in the Hall's Cave pollen spectra as an increase in AP, particularly Quercus, and the decrease in Artemisia. In contrast, the YD reflects a reduction of rain originating in the Gulf of Mexico (Feng et al., Reference Feng, Hardt, Banner, Meyer, James, Musgrove, Edwards, Cheng and Min2014), which in the pollen record is mirrored in the reduction of arboreal taxa and the increase in Artemisia.
Records in the broader regional context
Various paleoecological and paleoclimatic records in Texas and northwestern Mexico have been related to SSTs in the Gulf of Mexico during the Pleistocene-Holocene transition (e.g., Bousman, Reference Bousman1998; Nordt et al., Reference Nordt, Boutton, Jacob and Mandel2002, Reference Nordt, Von Fischer, Tieszen and Tubbs2008; Holliday et al., Reference Holliday, Meltzer and Mandel2011; Feng et al., Reference Feng, Hardt, Banner, Meyer, James, Musgrove, Edwards, Cheng and Min2014; Roy et al., Reference Roy, Rivero-Navarrete, Sánchez-Zavala, Beramendi-Orosco, Muthu-Sankar and Lozano-Santacruz2016). SST changes in the Gulf of Mexico, although directly influenced by summer insolation, respond directly to the influx of meltwater coming from the Mississippi River (Aharon, Reference Aharon2003; Flower et al., Reference Flower, Hastings, Hill and Quinn2004). The direct SST proxy thus correlates in part with proxies suggesting the influx of water, which can be compared directly with summer insolation changes and a summary of the proxies obtained from Hall's Cave up to 9 ka (Fig. 11).
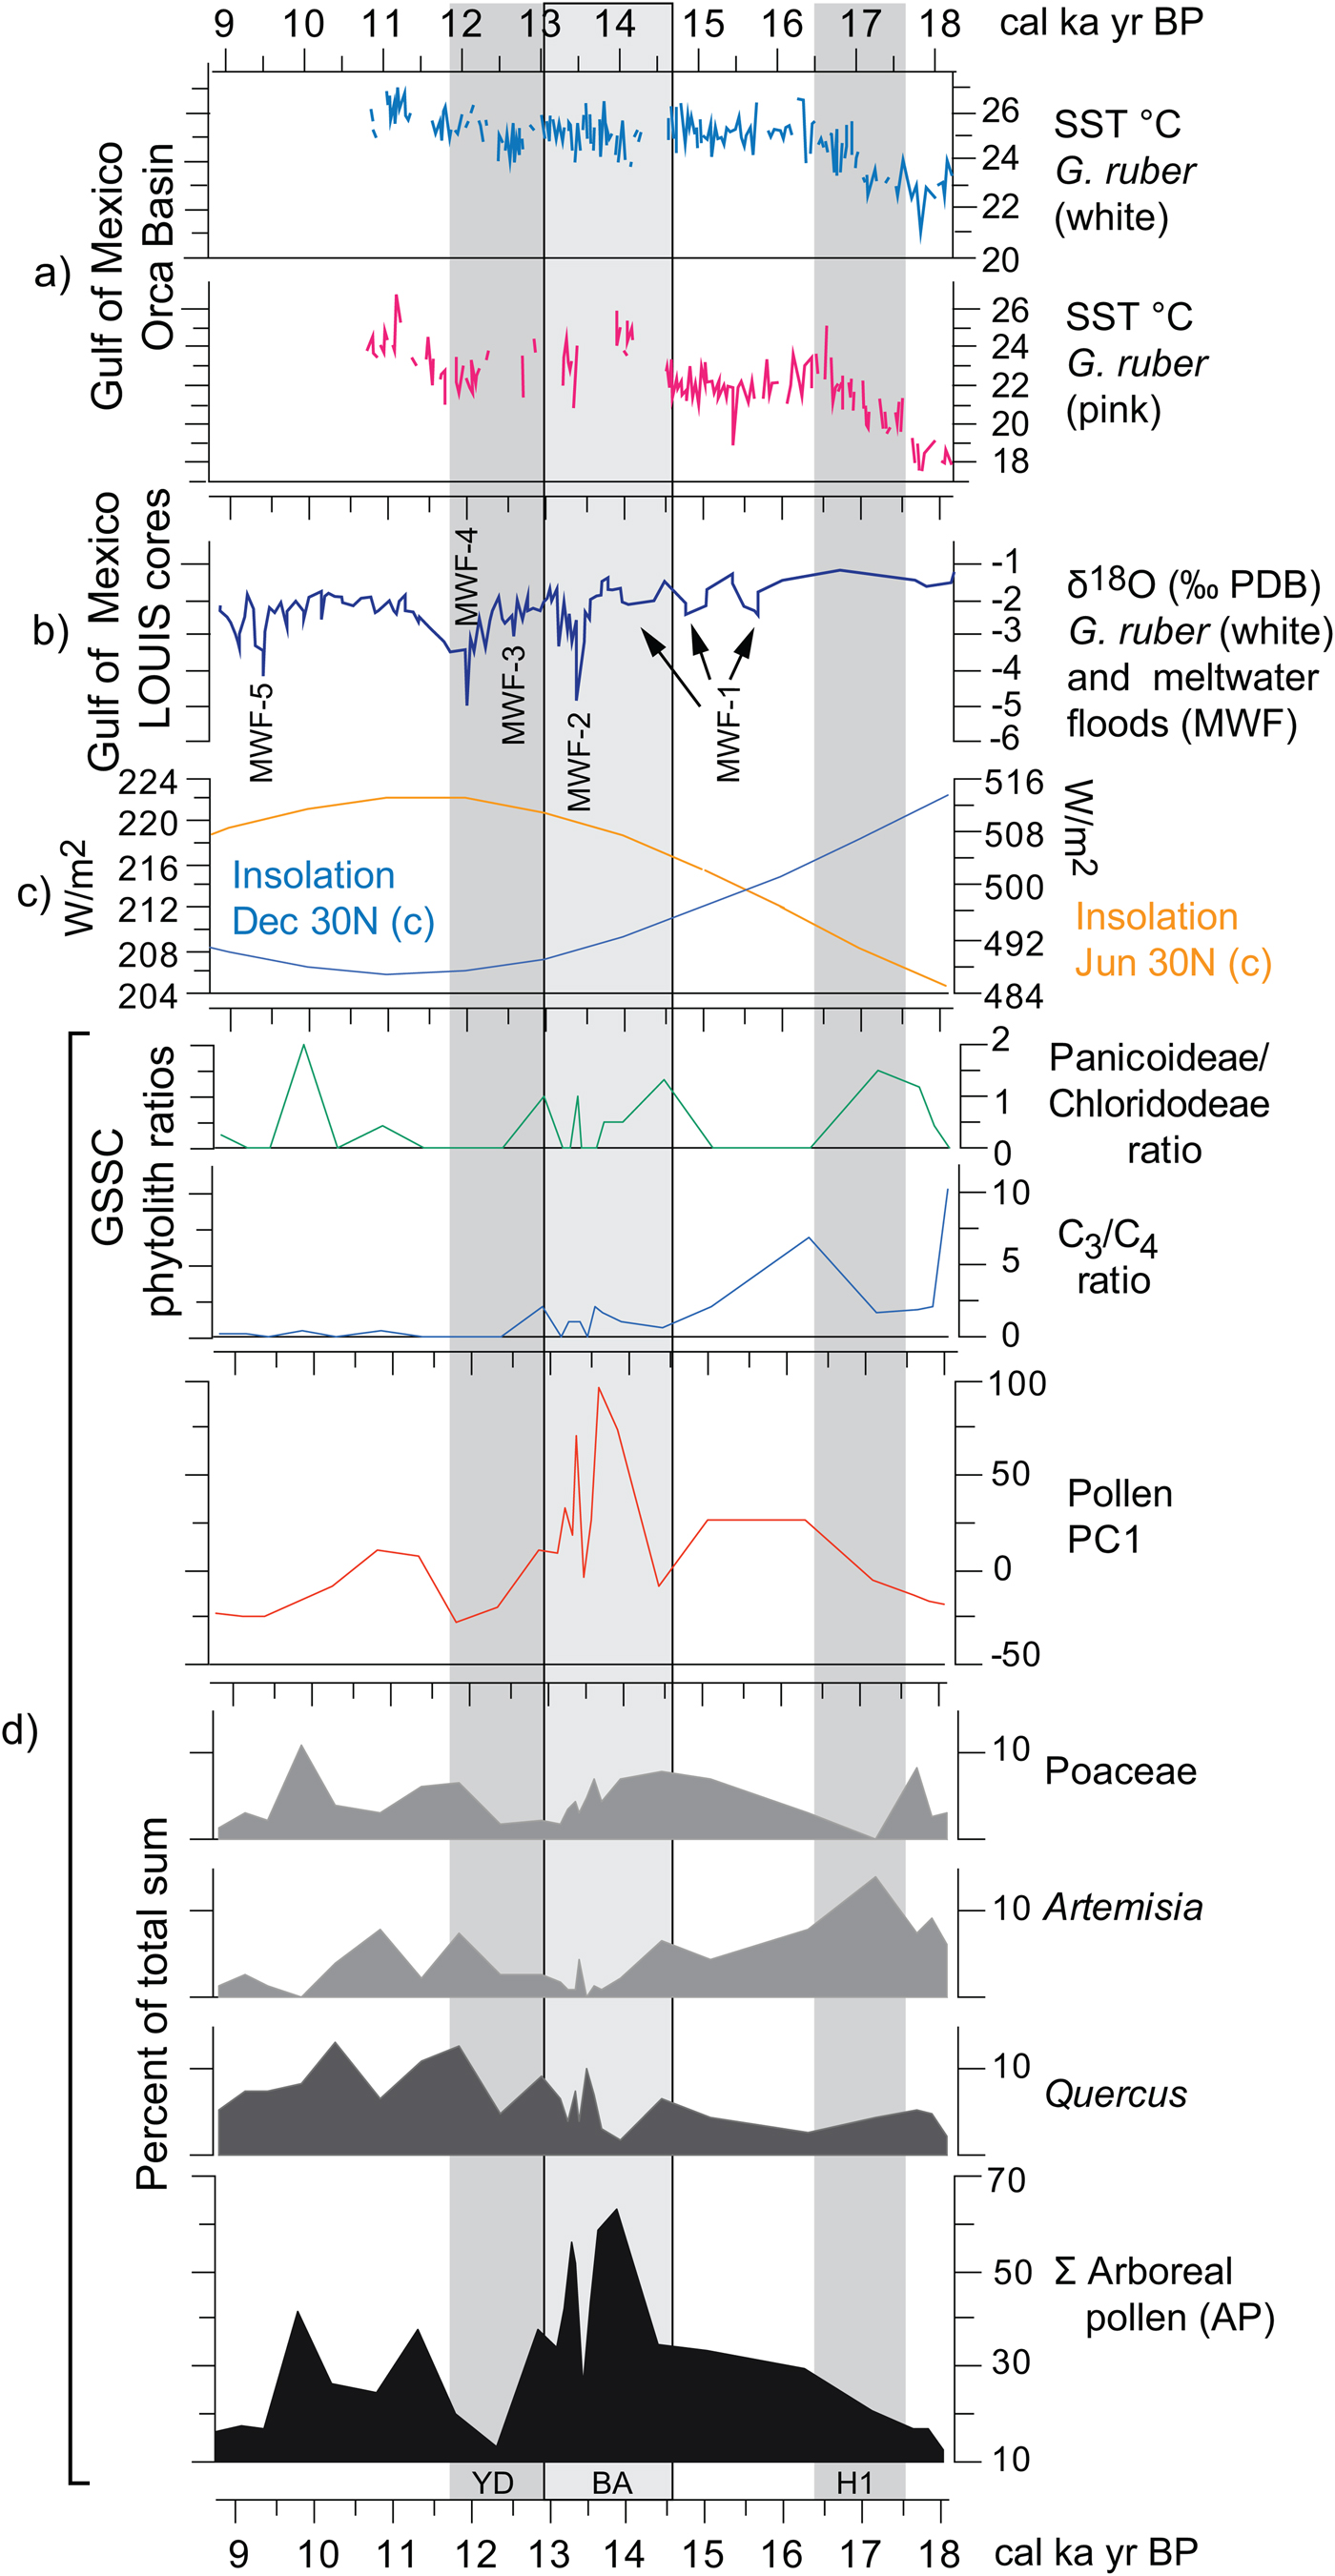
Figure 11. (color online) Correlation of regional paleoclimatic data and insolation curves with the Hall's Cave paleovegetation proxies of this study. (a) Sea surface temperatures (SSTs) derived from the Mg/Ca ratio on white and pink Globigerinoides ruber in the sediments of the Orca Basin, Gulf of Mexico (Williams et al., Reference Williams, Flower and Hastings2012). (b) δ18O on white G. ruber from the Louisiana (LOUIS) cores as a proxies for meltwater floods (Aharon, Reference Aharon2003). (c) June and December insolation curves at 30°N (Laskar et al., Reference Laskar, Robutel, Joutel, Tineau, Correia and Levrard2004). (d) Paleovegetation proxies of this study, grass silica short cells (GSSC) phytolith ratios (Fig. 9), PC1 values (Supplementary Fig. 4), and pollen percentages of selected taxa and arboreal pollen (AP).
The paired Mg/C ratios obtained from white and pink Globigerinoides ruber from cores in the Orca Basin are proxies for SSTs (Williams et al., Reference Williams, Flower and Hastings2012), while the δ18O (VPDB%) ratio from the Louisiana slope cores (i.e., LOUIS cores) (Aharon, Reference Aharon2003) links to meltwater pulses delivered by the Mississippi River (Fig. 11a and b). Although there is a trend of increasing SSTs in the Gulf of Mexico throughout the deglaciation as summer insolation increases in the Northern Hemisphere, declines in temperature are associated with global cooling episodes such as the H1 and the YD (Fig. 11c).
Correlating vegetation changes from the pollen and phytolith record of Hall's Cave (Fig. 11d) with regional and global trends is potentially problematic because of multiple taxa that respond to local changes such as slope exposure, soil depth, and microclimates. However, the pollen of the more regional and climatically sensitive taxa should correlate better with regional climatic trends, as is the case for Quercus, Artemisia, and Poaceae, and the AP (Bryant and Holloway, Reference Bryant, Holloway, Bryant and Holloway1985; Hall and Valastro, Reference Hall and Valastro1995). Likewise, general trends in the proportions of C3 and C4 grasses, and in the drought-adapted Chloridoideae and mesic Panicoideae grasses can also respond to broad regional climatic trends (Fig. 11d).
Low AP frequencies coincide with global cold episodes such as the H1 and YD, and high frequencies with the BA and its concomitant rapid meltwater influx (Fig. 11b and d). Quercus pollen frequencies decline only slightly at the end of the H1 cooling but increase considerably toward the end of the warmer and moister BA, followed by a rapid but moderate decline associated with the YD. The higher temperatures and possibly a short post-YD improvement in rains favor all the arboreal taxa, particularly Quercus (Fig. 11d). The PC1 curve reflects directly the trend of AP, magnifying the increase of species (in number and diversity) during the BA. This change could be a response to the general improvement in precipitation fostered by the increase of SSTs in the Gulf of Mexico that led to the meltwater pulse MWF-2 (meltwater flood 2) (Fig. 11b).
Artemisia pollen frequencies parallel the SST trends in the Gulf of Mexico more closely than the other selected pollen frequencies, showing trends opposite to those of the AP. Artemisia frequencies clearly parallel H1, signifying a relatively dry regional cooling, which correlates with decrease in AP. Artemisia declines considerably during the warmer and possibly wetter BA but increases only modestly toward the end of the YD, continuing into a declining trend in the early Holocene. Poaceae (C3) has a trend different from other records in west Texas, where cold seems to promote the opening of forest, as arboreal species decrease and the area occupied by grasses increases (see Bousman, Reference Bousman1998). At Hall's Cave, Poaceae instead decreases during the cold periods and has no parallel trend with AP.
GSSCs add some relevant information to pollen data in terms of responses of grass communities to temperature and precipitation changes during the deglaciation (Figs. 9 and 11). Throughout the deglaciation, C3 grasses decline in favor of C4, although notable fluctuations in the predominance of these two groups occur (Figs. 9 and 11). The first incidence of the C4 grasses occurs ca. 17–17.5 ka (Fig. 11d), which interestingly is dominated by the Panicoideae grasses, suggestive perhaps of some rain in the warm season and perhaps overall higher temperatures. However, soon after the onset of the H1, the C4 grasses decline in favor of the C3 grasses, suggesting perhaps cooling or increasing rain in the cool season. The dominance of C3 grasses continues through the times of MWF-1, 2, and 3 pulses, despite the increase of SST temperatures in the Gulf of Mexico (Fig. 11). During the BA, C4-Panicoideae becomes important again suggesting warmer, but still wet conditions, correlative with the relatively high SST temperatures (Fig. 11). Although C3 grasses remain relatively important throughout the BA, they begin to decline during the YD, during which the Panicoideae (pronounced summer rainfall) begins to yield to the Chloridoideae (low summer rainfall and high precipitation variability). This suggests that rather than cooling, the YD is marked by drying.
The most notable changes during the YD are the decline of AP (Fig. 11) and the apparent increase in C4 grasses (Fig. 11d). These changes correlate with the regional studies of δ13C records in soils, which show a slight increase in C4 plants (cf. Nordt et al., Reference Nordt, Von Fischer, Tieszen and Tubbs2008). The decrease in Panicoideae may be because of the decrease in effective summer precipitation recorded in speleothem records (Feng et al., Reference Feng, Hardt, Banner, Meyer, James, Musgrove, Edwards, Cheng and Min2014), thus corresponding with high summer insolation (Fig. 11), which increased evapotranspiration. Therefore, pollen and phytolith records from the study section seem to suggest that in this part of the Great Plains, the YD was apparently not a cold, but dry event attributable perhaps to the reduction of effective summer precipitation.
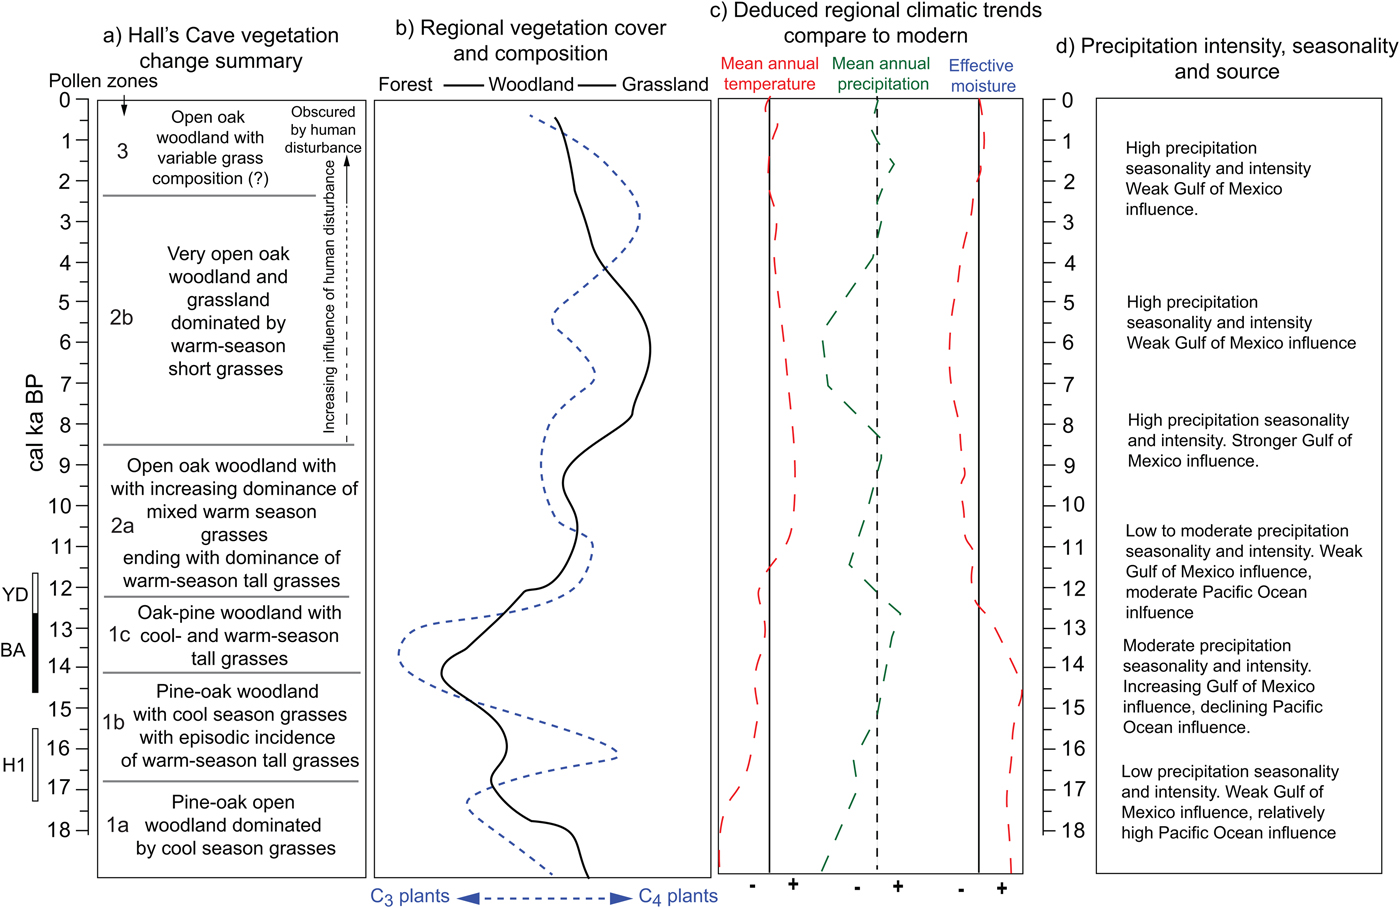
In summary, the opening and closing of vegetation communities around Hall's Cave and in the broader region and the varying incidence of C3 and C4 plants permit reconstructing climatic patterns during the past 18 ka in relation to modern patterns (Fig. 12). Low temperatures up to about 16 ka indicate relatively high effective moisture despite the still low amounts of precipitation, but the increase of C4 grasses afterward suggests an increase in summer precipitation originating from the Gulf of Mexico. After about 14.5 ka, the increase in arboreal taxa, particularly broadleaf trees, suggests greater effective moisture. However, temperatures are not cold enough to maintain boreal taxa, as Picea disappears from the records by about 13 ka. Opening vegetation and the increase of C4 grasses suggest that between 13 and 11 ka conditions were drier (Fig. 12). During the early Holocene, tree cover increases, but never reaching close canopy forest, while C4 grasses dominate. Subsequently, during the middle Holocene, the opening of vegetation community into grasslands suggests low effective moisture, probably accompanied by strong seasonality and sporadic intense rain. The late Holocene experiences an increase in effective moisture, but tree cover never recovers beyond open woodlands.

Figure 12. (color online) Summary of vegetation and climatic changes deduced from regional terrestrial records. Local (Hall's Cave) (a) and regional (b) changes in vegetation communities. (c) Mean annual temperature, mean annual precipitation, and effective moisture deduced from changes in vegetation (a and b) and faunal tolerances (Toomey et al., Reference Toomey, Blum and Valastro1993). (d) Changes in precipitation patterns deduced from cave speleothems (Musgrove et al., Reference Musgrove, Banner, Mack, Combs, James, Cheng and Edwards2001; Feng et al., Reference Feng, Hardt, Banner, Meyer, James, Musgrove, Edwards, Cheng and Min2014; Wong et al., Reference Wong, Banner and Musgrove2015) and soil thickness and erosion (Cooke et al., Reference Cooke, Stern, Banner, Mack, Stafford and Toomey2003).
CONCLUSIONS
The study of pollen and its comparison with the record of spores, microscopic charcoal, and phytoliths in a cave setting provide a comprehensive perspective on paleovegetation and paleoclimatic change for the past 18 ka in south-central Texas. Unfortunately, the plant microfossil record is not a reliable indicator of past climatic conditions for periods encompassing the middle and late Holocene (about 6–0 ka) because of disturbance by human occupation of the cave, which produced unusual amounts of certain taxa (e.g., Umbelliferae and Opuntia), unusual amounts of certain phytolith types (e.g., grass phytoliths and Celtis-type), and disproportionate amounts of charcoal and fungal spores, a factor to consider when interpreting paleoenvironmental proxies in other cave sedimentary records. However, despite the human noise in the middle and late Holocene record, the undisturbed portion of the stratigraphic sequence provides reliable proxy records for the reconstruction of vegetation and climate during deglaciation, the Pleistocene-Holocene transition, and the early Holocene.
Highlights of the pollen record in terms of vegetation response to climatic change reflect the transition from cooler climatic conditions in the early part of the deglaciation (pre–14 ka) in which the overall landscape is dominated by Pinus, Poaceae, Artemisia, and Ambrosia, and the local landscape by modest amounts of Cyperaceae and Quercus. During the same period, traces of Acer, Liquidambar, and Ostrya-Carpinus suggest possible glacial refugia of these trees nearby. H1 influence is suggested by a sharp increase in Artemisia and decline in Quercus and Poaceae, involving a sharp decline in Panicoideae in favor of C3 grasses. The time corresponding to the BA is characterized by an increase in arboreal vegetation and a decrease in Artemisia, but with high variability in the composition of other taxa. Up until this time, the grass phytolith record shows a considerable representation of C3 grasses, suggesting relatively cool growing seasons. The high variability experienced during this part of the last deglaciation correlates with broader regional and marine information on paleotemperatures and meltwater pulses.
Vegetation during the YD is characterized by a sudden decrease in arboreal taxa with a rapid recovery before the global end of the YD (about 11.7 ka). Post-YD/early Holocene time is characterized by a notable increase in arboreal taxa, a time with Quercus as the dominant tree species and the increasing dominance of phytoliths characteristic of C4 grasses. AP declines again by 9.5 ka, during which herbaceous taxa dominate, suggesting the general drying trend recorded regionally during the middle Holocene, coinciding with the increase of phytoliths characteristic of the drought-adapted Chloridoideae grasses. The unusually large amounts of certain pollen taxa (e.g., Opuntia and Umbelliferae) during the middle and late Holocene suggest that during this time human influence in the cave was contributing noise to the climate signal expressed in the pollen record.
Pollen and phytoliths correlate well with other proxies in the cave, particularly the faunal record and the sedimentation record, as well as other regional records, notably changes in effective moisture deduced from cave speleothem growth and SST and salinity in the Gulf of Mexico. Although dissimilarities with pollen records in west and east Texas may be because of the location of Hall's Cave in a relatively drier area than east Texas, it is possible to correlate changes across a broader region and reconstruct changes in effective moisture in relation to changes in effective moisture influenced by land and sea temperatures (Fig. 12).
ACKNOWLEDGMENTS
The authors express their appreciation to T.D. Hall and Billie Hall for free access to the cave and its sedimentary record, and to Fran Hall and Lee Hall for their permission to work on their property. We very much appreciate encouragement and technical support from Professor Ernest Lundelius (University of Texas at Austin) and assistance in the field and with the processing of phytolith samples from Jason Joines (Clemson University). The Geography Department and the College of Arts and Sciences at Oklahoma State University contributed partial funding and facilities support for this study. We also thank the anonymous reviewers and Derek Booth (journal editor) for their valuable comments and suggestions.
SUPPLEMENTARY MATERIAL
The supplementary material for this article can be found at https://doi.org/10.1017/qua.2019.17.