Geopolymers are amorphous aluminosilicates that are considered to be the precursors of zeolites. These materials find many applications in chemical technology (Provis & van Deventer, Reference Provis and van Deventer2009). It was Joseph Davidovits who, in the 1970s, introduced the term ‘geopolymer’ and its definition for materials synthesized by the reaction of aluminosilicate powders with alkaline solutions (activators) at temperatures <100°C (Davidovits, Reference Davidovits1991). Numerous attempts have been made to obtain geopolymers from Si- and Al-rich industrial wastes and by-products (e.g. fly ash, silica fume, slag, red mud [residue from the production of aluminium] and amorphous metakaolin; Provis & van Deventer, Reference Provis and van Deventer2009).
The structure and properties of geopolymers depend mainly on the starting raw material. The quality of geopolymer is also affected by the type and concentration of alkaline activator, activation temperature and time of polycondensation. Hydroxides and silicates of alkali metals (sodium and potassium) are commonly used activators (Xu & van Deventer, Reference Xu and van Deventer2000). Geopolymers exhibit high compressive strength (>90 MPa after 28 days) and flexural strength (10–15 MPa), resistance to changing weather conditions, low porosity and little binding shrinkage (<0.05%) (Davidovits, Reference Davidovits2016). The synthesis of metakaolin- and fly ash-based geopolymers resistant to fire, frost, acids, sulfates and seawater has also been studied (Fernandez-Jimenez & Palomo, Reference Fernandez-Jimenez, Palomo and Davidovits2005).
Metakaolin is the anhydrous calcined form of the clay mineral kaolinite, often examined in the context of the starting material for the production of geopolymers or as a pozzolanic additive to Portland cement. The optimum activation temperatures range from 550°C to 850°C (Snellings et al., Reference Snellings, Mertens and Elsen2012). Kakali et al. (Reference Kakali, Perraki, Tsivilis and Badogiannis2001) calcined kaolins at 650°C for 3 h and reported that the pozzolanic activity of the metakaolin produced from dehydroxylated disordered kaolinite was greater than that of metakaolin from ordered kaolinite. Abo-El-Enein et al. (Reference Abo-El-Enein, Amin, El-Hosiny, Hanafi, ElSokkary and Hazem2014) prepared metakaolin by firing kaolin at 750–825°C for 2 h. The optimum firing temperature of metakaolin with respect to the pozzolanic activity with hydrated lime as an activator was 750°C. Kenne Diffo et al. (2015) studied the effect of the calcination rate (in the range 1–20°/min to 700°C) of kaolin on the mechanical properties of metakaolin-based geopolymers and reported that lower calcination rates resulted in more durable materials. Zuhua et al. (Reference Zuhua, Xiao, Huajun and Yue2009) calcined kaolin at 600–1000°C for 6 h and tested the strength of the calcined geopolymers. However, those authors did not confirm the presence or absence of zeolites in the geopolymeric matrix, although geopolymers are considered to be precursors of zeolites (Liu et al., Reference Liu, Yan, Zhang, Gong, Wang and Qiu2016).
Geopolymers incorporating zeolites may merge interesting properties of both aluminosilicate materials. While geopolymeric gel serves as a support for zeolites, zeolites provide greater surface area, porosity and cation exchange capacity (Khalid et al., Reference Khalid, Lee, Park, Abbas and Lee2018). Geopolymer–zeolite composites may be used as self-supporting membranes (Zhang et al., Reference Zhang, He, Wang, Mao and Cui2014) or solid adsorbents of carbon dioxide (Minelli et al., Reference Minelli, Papa, Medri, Miccio, Benito, Doghieri and Landi2018). Geopolymer–zeolite composites may be obtained by adding a commercial zeolite (e.g. zeolite Na13X) to a geopolymer slurry at the stage of mixing (Papa et al., Reference Papa, Medri, Amari, Manaud, Benito, Vaccari and Landi2018) or by hydrothermal treatment of a solid geopolymer (Wang et al., Reference Wang, Yan, Li, Zhou, Liu, Zhou and Komarneni2018). Zeolites A and X may also form in the metakaolin-based geopolymer matrix by simple curing in an autoclave at elevated temperatures, without applying hydrothermal treatment (Król et al., Reference Król, Minkiewicz and Mozgawa2016; Brylewska et al., Reference Brylewska, Rożek, Król and Mozgawa2018). In fly ash-based geopolymers, the most commonly present zeolite-like phase is hydroxysodalite (Rożek et al., Reference Rożek, Król and Mozgawa2018).
The aim of this research was to characterize the structure of metakaolin-based materials. Due to the various temperatures of metakaolin production for application as a raw material in alkali activation used in previous studies, the reactivity of metakaolin obtained at various temperatures was assessed. The optimum firing temperature of metakaolin in the context of zeolite synthesis was analysed for the first time. In addition, diffuse reflectance infrared Fourier-transform spectroscopy (DRIFTS) was used to analyse structural changes during heating of the kaolinite sample. The influence of geopolymerization temperature and activator concentration on the type of zeolite phases obtained was also investigated.
MATERIALS AND METHODS
Starting material
Kaolin KOC (Surmin-Kaolin) was used as the starting material. Homogenized samples of the kaolin were thermally treated at 600°C, 700°C and 800°C for 2 h (temperatures were chosen on the basis of literature data and DRIFTS measurements) to obtain metakaolin. The metakaolin materials were named as ME600, ME700 and ME800, respectively.
Alkali activation
The metakaolin materials obtained in calcination process were subjected to alkali activation. For this purpose, metakaolin specimens were mixed with aqueous solutions of 3, 5, 7 and 9 mol/dm3 NaOH at a 0.8:1.0 solution:solid ratio. The slurries were inserted into silicon moulds under vibration to exclude air bubbles. Because polycondensation during the geopolymerization process is not spontaneous but demands energy (Xu & van Deventer, Reference Xu and van Deventer2000), the samples were sealed with plastic film and put into a laboratory dryer for 24 h at 70°C and 90°C activation temperatures.
Methodology
Phase composition was determined by XRD from International Centre for Diffraction Data (ICDD)-registered mineral patterns with a Philips X-ray diffractometer X'Pert system (Cu-Kα radiation). The XRD patterns were obtained in the range 5–60°2θ, with a step 0.05°2θ and 2 s per step.
The FTIR spectra were obtained with a Bruker VERTEX 70v vacuum spectrometer in the mid-infrared range (4000–400 cm–1). The samples were prepared by the KBr (Merck) method. Spectra were recorded in absorbance mode with 128 scans and a resolution of 4 cm–1. The same spectrometer equipped with a diffuse reflectance cell (Praying Mantis™ with a reaction chamber and temperature controller) was used to obtain in situ DRIFT spectra of the kaolin heated at 700°C. Spectra were collected at 2 min (every 10°C) intervals in the range 4000–600 cm−1 over 64 scans and at 4 cm−1 resolution.
The chemical compositions of kaolin and the calcination products were determined by X-ray fluorescence (XRF). A WD-XRF spectrometer (Axios mAX 4 kW, PANalytical, The Netherlands) equipped with Rh source was used to determine the concentrations of elements. Microstructure analysis of the materials was performed with an FEI Nova Nanosem 200 scanning electron microscope on graphite-coated samples.
RESULTS AND DISCUSSION
The XRD trace of the starting kaolin is shown in Fig. 1. The sample contains quartz and minor muscovite impurities except for kaolinite. The chemical compositions of kaolin and its calcination products are listed in Table 1.

Fig. 1. XRD pattern of kaolin KOC.
Table 1. Chemical composition (wt.%) of the original kaolin (KOC) and the metakaolins (ME) fired at various temperatures.
Heating of kaolin results in partial decomposition and structure rearrangement due to the removal of water in the crystal lattice of kaolinite (at 500–800°C dehydroxylation) (Bolewski & Żabiński, 1979; Osornio-Rubio et al., Reference Osornio-Rubio, Torres-Ochoa, Palma-Tirado, Iménez-Islas, Rosas-Cedillo, Fierro-Gonzalez and Martínez-González2016). These reactions may be theoretically denoted as shown in reaction 1:
 $$\eqalign{& {\rm Al}_4\lsqb {{\rm Si}_4{\rm O}_{10}} \rsqb \lpar {{\rm OH}} \rpar _8\to {\rm Al}_4\lsqb {{\rm Si}_4{\rm O}_{13}} \rsqb \lpar {{\rm OH}} \rpar _2 \cr & \quad + 3{\rm H}_2{\rm O}\to {\rm Al}_4\lsqb {{\rm Si}_4{\rm O}_{14}} \rsqb + {\rm H}_2{\rm O}} $$
The calcination temperature of kaolin was determined with DRIFTS, which allows in situ temperature measurement. The spectra obtained are shown in Fig. 2. For readability, only some records are presented at temperature intervals of 50°C. From 600°C, rapid dehydroxylation is observed as a clear change in the range of OH-stretching vibrations (i.e. 3800–3600 cm−1), and this is combined with an amorphization of structure (Si–O vibrations at 1200–600 cm–1). Therefore, for further research, temperatures of 600°C, 700°C and 800°C were chosen.
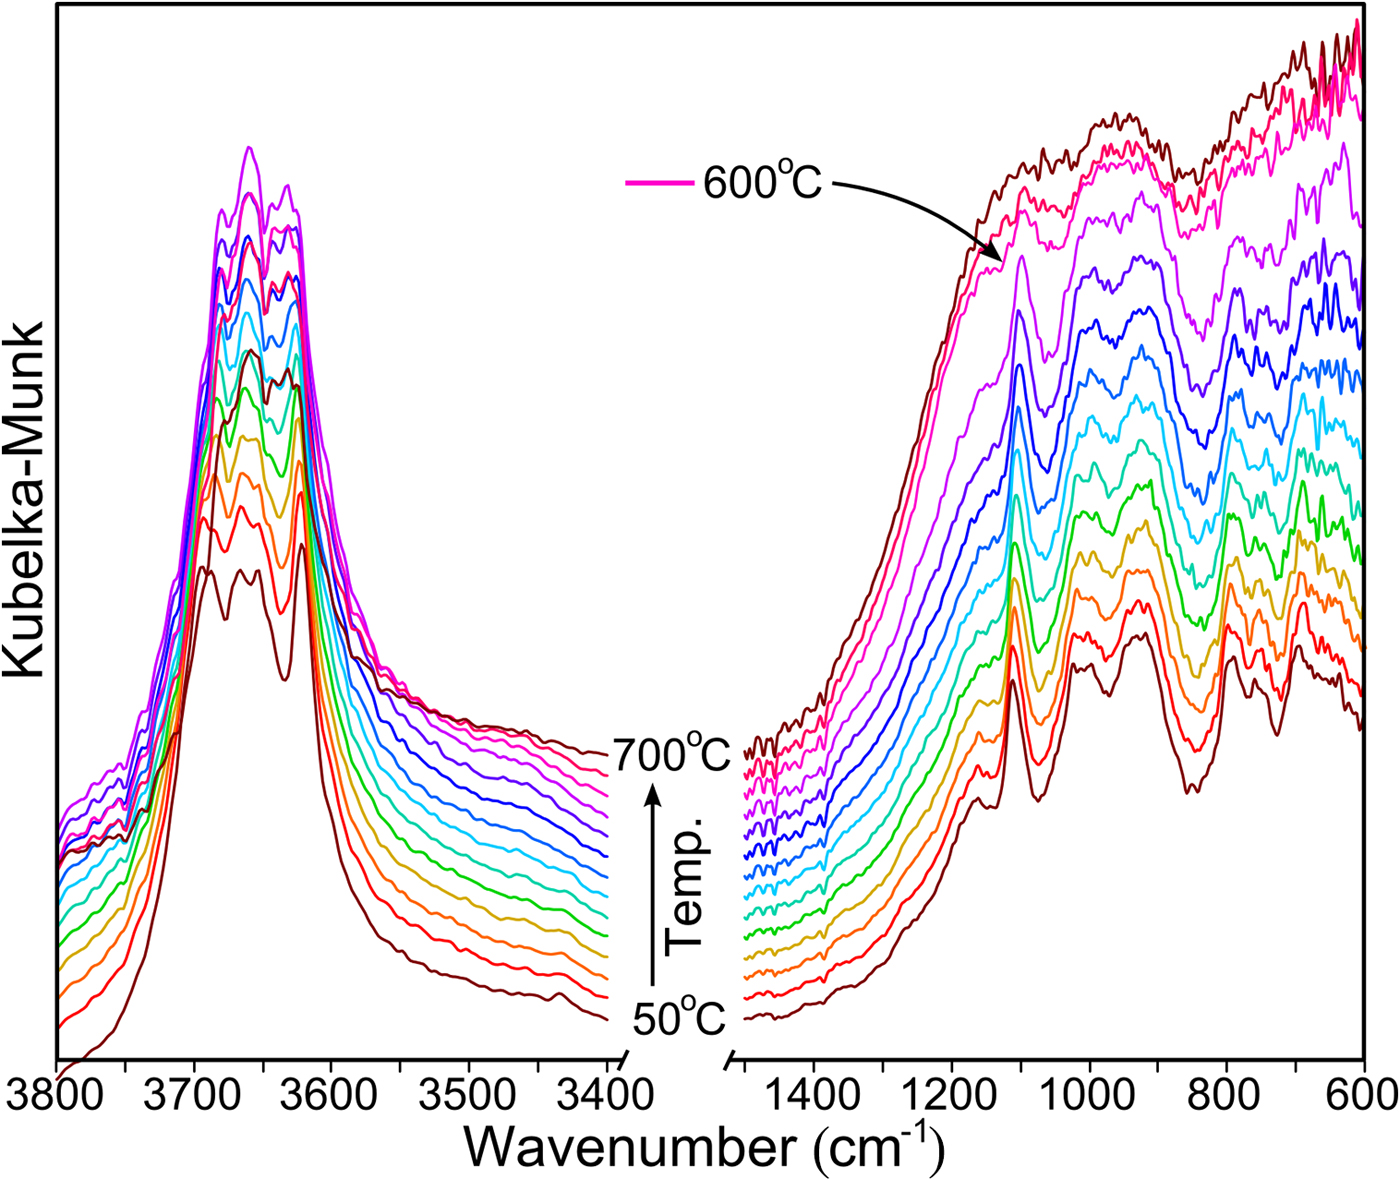
Fig. 2. DRIFT spectra of kaolin recorded at 50°C intervals.
The products of kaolin calcination at 600°C, 700°C and 800°C were examined by XRD (Fig. 3). Kaolinite, the dominant phase in the starting material, was transformed completely into the amorphous phase. Only in the ME600 sample did kaolinite remain, as is indicated by the persistence of the peak at 12.4°2θ. In all of the patterns, a hump appeared in the range 20–30°2θ, which indicates amorphization of the kaolin. Peaks related to quartz and muscovite present in the starting material (Fig. 1) were also observed in the fired products (Fig. 3).
Fig. 3. XRD traces of metakaolins obtained at various temperatures.
The FTIR spectra of metakaolins obtained at various temperatures are shown in Fig. 4. In all of the spectra, the main infrared bands may be assigned as follows:
– The bands at 1086–1099 cm–1 result from asymmetric stretching vibrations of Si–O–(Si,Al) bonds.
– The doublet at 800 and 780 cm–1, which is related to symmetrical Si–O–Si stretching vibrations, is characteristic of quartz.
– The bands at ~695 cm–1 are attributed to Al–O–Si symmetric stretching vibrations.
– The bands at ~469 cm–1 are related to bending Si–O–Si(Al) vibrations.
– Finally, in ME700 and ME800, the band at 567 cm–1 is attributed to the vibrations of rings built of [TO4] tetrahedra (Mozgawa et al., Reference Mozgawa, Jastrzębski and Handke2006), as well as to octahedral Al–O vibrations (Tarte, Reference Tarte1967).

Fig. 4. FTIR spectra of metakaolins collected at various temperatures.
Scanning electron micrographs of the metakaolins are shown in Fig. 5. The thermal treatment modified the clay microstructure in comparison to the starting kaolin (Fig. 5a). Kaolinite crystals have a pseudohexagonal habit and form characteristic aggregates that arrange into booklets (Christidis, Reference Christidis and Christidis2011). The least structural modification was observed in ME600 (Fig. 5b); despite the fact that the crystal size decreased, some of the crystals remained unchanged, retaining the initial habit of hexagonal plates. In samples ME700 (Fig. 5c) and ME800 (Fig. 5d), amorphization was observed, which was confirmed by detailed analysis of the infrared spectra (Fig. 4). Indeed, the OH-stretching vibrations of kaolinite bands at 3696, 3669, 3653 and 3621 cm–1 with low integral intensity (Król et al., Reference Król, Minkiewicz and Mozgawa2016) may be observed only in the spectrum of ME600 (clearly visible when enlarging this part of the spectrum). In contrast, significant differences in the microstructures of ME700 (Fig. 5c) and ME800 (Fig. 5d) were not observed.
Fig. 5. SEM images of KOC (a), ME600 (b), ME700 (c) and ME800 (d).
The data obtained suggest that a temperature of 600°C is too low to cause complete transformation of kaolin into metakaolin. However, the firing products at 700°C and 800°C were essentially X-ray amorphous, containing only minor crystalline phases such as quartz and muscovite.
The next step was to assess the influence of the activation temperature on the reactivity of the metakaolin during alkali activation with various concentrations of NaOH. X-ray diffraction was used to determine the phase compositions of samples obtained during alkali activation, and the results are presented in Fig. 6. Beside quartz and clay mica, which were present in the starting material (Fig. 1), zeolite A and hydroxysodalite were identified. In those samples activated at 70°C (Fig. 6a), the zeolite formed was obtained at the highest concentration of NaOH used (9 mol/dm3), but only in metakaolins prepared at lower temperatures. Therefore, ME700 was most active, while only amorphous matter was obtained from ME800. Thus, the temperature of 700°C was optimal for obtaining an intermediate product with potential application in sorption processes. Synthesis of zeolite proceeds in several stages, with the first being the dissolution of the aluminosilicate raw material (Cundy & Cox, Reference Cundy and Cox2005). The metakaolin obtained at 700°C is probably subjected to this process to a greater extent and, consequently, the successive stages of the formation of zeolite structures may occur.

Fig. 6. XRD traces of the alkali-activated metakaolins at (a) 70°C and (b) 90°C.
Alkali activation at 90°C yielded various results. Upon activation with 9 M NaOH solution, all metakaolins yielded zeolites. ME600 yielded the largest amounts of zeolite. ME700, in turn, produced zeolites with the lowest concentration of activator (7 M NaOH). As a general trend, alkali activation at 90°C favours the formation of sodalite, which has inferior sorption properties.
Figure 7 shows the infrared spectra of materials produced from ME600 after alkali activation at 70°C. The bands attributed to Si–O vibrations are observed in the range of 1000–400 cm–1. Because zeolite phases are present in the analysed samples, the infrared region of 800–500 cm–1 enables the observation of bands due to ring vibrations (Mozgawa, Reference Mozgawa2007). A characteristic structural unit for zeolite A is the double four ring, with absorption bands at ~560 cm–1. The occurrence of these bands in ME600 activated at 70°C with 9 M NaOH (Fig. 7) confirms that the largest amount of zeolite is obtained by using the highest concentration of NaOH. In addition, the full width at half maximum of bands corresponding to the Si–O vibrations decreases with increasing abundance of the crystalline phases. The intensity of the band at ~1455 cm–1, assigned to the vibrations of carbonate groups, increases with increasing concentration of NaOH. This band is related to the reaction of NaOH with atmospheric CO2 during thermal activation at elevated temperature. Finally, the intense band at 3460 cm–1 due to O–H stretching, and the corresponding O–H bending vibrations at 1650 cm–1, indicate the presence of adsorbed – mostly zeolitic – water in the analysed samples. The spectra of the remaining samples are similar to sample ME600 (data not shown) and are in accordance with their mineralogical composition (Fig. 6).

Fig. 7. FTIR spectra of alkali-activated ME600 at 70°C at various NaOH concentrations.
CONCLUSIONS
The following conclusions can be drawn from this study:
– The DRIFT spectra used to observe changes in kaolinite structure during firing at >600°C showed rapid dehydroxylation and structure amorphization, indicating transformation of kaolinite into metakaolinite.
– The most active metakaolin for zeolite synthesis by alkali activation was obtained after calcination at 700°C.
– Optimum synthesis conditions yielded zeolite A in an amorphous matrix of geopolymer. Such composites may be used as self-supporting zeolitic membranes.
– The largest amounts of zeolites might be obtained by alkali activation of ME600 and ME700 with 9 mol/dm3 NaOH solution at 70°C and ME600 with 9 mol/dm3 solution at 90°C.
– The increase in activation temperature favours hydroxysodalite, which does not have a disadvantageous structure for sorption applications.
ACKNOWLEDGEMENTS
This work was financially supported by the National Science Centre in Poland under grant no. 2015/17/B/ST8/01200.