


1 Introduction
Strong coupling of several fluid dynamic phenomena occurs when a shock wave interacts with a density inhomogeneity. This interaction of a pressure discontinuity at an interface between two fluids results in the amplification of disturbances due to baroclinic deposition of vorticity that finally develops into regions of intense mixing, a phenomenon often referred to as the Richtmyer–Meshkov instability (RMI). Secondary instabilities, like the shear-induced Kelvin–Helmholtz instability (KHI), develop at a later time as the interface becomes more distorted. This class of problems – having diverse applications in the fields of supersonic combustion systems (Scramjet), astrophysical environments of supernovas, supersonic/hypersonic flow control and inertial confinement fusion – has been studied extensively after Richtmyer (Reference Richtmyer1960) first provided the theoretical analysis, and Meshkov (Reference Meshkov1969) confirmed it experimentally. Zabusky (Reference Zabusky1999) and Brouillette (Reference Brouillette2002) gave a comprehensive review on RMI environments and shock accelerated inhomogeneous flows respectively.
A rich literature in the realm of RMI is found for the interaction of a shock wave with an isolated gas bubble, which is a fundamental yet vital configuration for studying shock accelerated inhomogeneous flows. When a shock wave impinges on a bubble, baroclinic vorticity deposition evolves the interface into two counter-rotating vortices, entraining fluid from the surrounding flow and thereby enabling stirring and mixing. Much earlier than all of these events, the impacted incident shock undergoes nonlinear shock effects, like reflection, refraction and diffraction at the gas bubble. Generally, depending on the acoustic impedance of the gas bubble and the surrounding fluid, they are classified as either slow/fast or fast/slow configurations. The same can be classified on the basis of density as heavy/light or light/heavy respectively. A wide variety of investigations covering theoretical, experimental and numerical aspects on light and heavy, cylindrical (two-dimensional) and spherical (three-dimensional) gas bubbles were previously performed. For instance, pioneering work by Markstein (Reference Markstein1957) utilized a reactive flame front of an oblong shape to study the shock interaction. Rudinger & Somers (Reference Rudinger and Somers1960) created bubbles using either a spark discharge or fine jet technique to study the effects experimentally and theoretically. Haas & Sturtevant (Reference Haas and Sturtevant1987) reported on the shock nonlinear acoustics and evolution of spherical bubbles produced by soap film and two-dimensional (2-D) gas cylinder by a nitrocellulose membrane. Picone & Boris (Reference Picone and Boris1988) numerically modelled the experiments conducted by Haas & Sturtevant (Reference Haas and Sturtevant1987) and presented an analytical model for calculating circulation, a measure of the net strength of the developed vortices. Another analytical model for circulation was formulated by Yang, Kubota & Zukoski (Reference Yang, Kubota and Zukoski1994) based on their numerical results. A detailed high-resolution numerical study capturing the nonlinear acoustics and the vortices was performed by Quirk & Karni (Reference Quirk and Karni1996). By implementing planar laser-induced fluorescence and a seeded round laminar test jet, Jacobs (Reference Jacobs1992) improved the quality of flow visualization enabling measurement of species concentration and mixing. Layes, Jourdan & Houas (Reference Layes, Jourdan and Houas2003, Reference Layes, Jourdan and Houas2005, Reference Layes, Jourdan and Houas2009) utilized a high-speed camera to obtain the evolution from a single run as compared to the single shot images captured previously. Giordano & Burtschell (Reference Giordano and Burtschell2006) and Layes & LeMetayer (Reference Layes and LeMetayer2007) numerically simulated the experimental results of Layes et al. (Reference Layes, Jourdan and Houas2003). The effects of a high incident Mach number (
 $M=2.95$
) were investigated experimentally by Ranjan et al. (Reference Ranjan, Anderson, Oakley and Bonazza2005, Reference Ranjan, Niederhaus, Motl, Anderson, Oakley and Bonazza2007) and numerically by Niederhaus et al. (Reference Niederhaus, Greenough, Oakley, Ranjan, Anderson and Bonazza2007), where they reported a secondary baroclinic source of vorticity. Departure from the single cylinder configuration was initiated by Yang, Kubota & Zukoski (Reference Yang, Kubota and Zukoski1993) who numerically simulated two and three cylinder interactions in various configurations. Tomkins et al. (Reference Tomkins, Prestridge, Rightley, Marr-Lyon, Vorobieff and Benjamin2003) investigated twin cylinder interactions experimentally which was increased to multiple cylinders by Kumar et al. (Reference Kumar, Vorobieff, Orlicz, Palekar and Tomkins2007). An in-depth review by Ranjan, Oakley & Bonazza (Reference Ranjan, Oakley and Bonazza2011) offers a comprehensive discussion on the shock bubble interaction problem. The common factor in the above stated investigations is the classic circular shape of the bubble whereas studies on different interface shapes are limited. Besides the circular shape, Ray, Samtaney & Zabusky (Reference Ray, Samtaney and Zabusky2000) studied the interaction of a shock wave with a heavy prolate ellipse and provided a heuristic model for calculating interfacial circulation. Bates, Nikiforakis & Holder (Reference Bates, Nikiforakis and Holder2007) studied the evolution of a rectangular block experimentally and numerically. Large-eddy simulation on a rectangular interface was performed by Wang et al. (Reference Wang, Bai, Li and Liu2010). Zou et al. (Reference Zou, Liu, Tan, Huang and Luo2010) studied a heavy elliptic cylinder with various aspect ratios, Zhai et al. (Reference Zhai, Wang, Si and Luo2014) investigated the interaction with three polygonal interfaces (the square, triangle and diamond) and most recently Georgievskiy, Levin & Sutyrin (Reference Georgievskiy, Levin and Sutyrin2015) numerically studied the shock focusing process in both light and heavy prolate ellipses.
$M=2.95$
) were investigated experimentally by Ranjan et al. (Reference Ranjan, Anderson, Oakley and Bonazza2005, Reference Ranjan, Niederhaus, Motl, Anderson, Oakley and Bonazza2007) and numerically by Niederhaus et al. (Reference Niederhaus, Greenough, Oakley, Ranjan, Anderson and Bonazza2007), where they reported a secondary baroclinic source of vorticity. Departure from the single cylinder configuration was initiated by Yang, Kubota & Zukoski (Reference Yang, Kubota and Zukoski1993) who numerically simulated two and three cylinder interactions in various configurations. Tomkins et al. (Reference Tomkins, Prestridge, Rightley, Marr-Lyon, Vorobieff and Benjamin2003) investigated twin cylinder interactions experimentally which was increased to multiple cylinders by Kumar et al. (Reference Kumar, Vorobieff, Orlicz, Palekar and Tomkins2007). An in-depth review by Ranjan, Oakley & Bonazza (Reference Ranjan, Oakley and Bonazza2011) offers a comprehensive discussion on the shock bubble interaction problem. The common factor in the above stated investigations is the classic circular shape of the bubble whereas studies on different interface shapes are limited. Besides the circular shape, Ray, Samtaney & Zabusky (Reference Ray, Samtaney and Zabusky2000) studied the interaction of a shock wave with a heavy prolate ellipse and provided a heuristic model for calculating interfacial circulation. Bates, Nikiforakis & Holder (Reference Bates, Nikiforakis and Holder2007) studied the evolution of a rectangular block experimentally and numerically. Large-eddy simulation on a rectangular interface was performed by Wang et al. (Reference Wang, Bai, Li and Liu2010). Zou et al. (Reference Zou, Liu, Tan, Huang and Luo2010) studied a heavy elliptic cylinder with various aspect ratios, Zhai et al. (Reference Zhai, Wang, Si and Luo2014) investigated the interaction with three polygonal interfaces (the square, triangle and diamond) and most recently Georgievskiy, Levin & Sutyrin (Reference Georgievskiy, Levin and Sutyrin2015) numerically studied the shock focusing process in both light and heavy prolate ellipses.
Despite these achievements, the inhomogeneities studied thus far are aligned normal to the incident shock wave, introducing symmetry along the centre axis. The effect of inclining an isolated bubble embedded in the surrounding fluid to the incoming flow field is an area that is unexplored and could potentially open up interesting features, driving future investigations. This paper is focused on exploring the effects of such an inclined isolated bubble introducing asymmetry into the flow field. Geometrically, a circular shape is always symmetric along any axis of incidence of the incident shock and is therefore not suitable for studies pertaining to our problem. The closest shape to a circle covering the complete range of angles between the pressure and density gradients, and still permit inclination, is an ellipse. Here we define the angle of inclination (
 $\unicode[STIX]{x1D6FC}$
) as the angle between the normal to the incident shock and the ellipse major axis. Moreover, we are interested in the dynamic characteristics of the early time development of the vortices, necessitating the need for an elongated ellipse. By early time, we mean the time taken for the fastest shock in the system to reach the downstream interface. However, information on such early time development, even for an uninclined ellipse (
$\unicode[STIX]{x1D6FC}$
) as the angle between the normal to the incident shock and the ellipse major axis. Moreover, we are interested in the dynamic characteristics of the early time development of the vortices, necessitating the need for an elongated ellipse. By early time, we mean the time taken for the fastest shock in the system to reach the downstream interface. However, information on such early time development, even for an uninclined ellipse (
 $\unicode[STIX]{x1D6FC}=0^{\circ }$
), is very scarce so that a rigorous treatment of it is essential before studying the inclination effects. Therefore the motivation in this paper is twofold: (i) first, to study the early time development of vortices in a straight elongated elliptic configuration (
$\unicode[STIX]{x1D6FC}=0^{\circ }$
), is very scarce so that a rigorous treatment of it is essential before studying the inclination effects. Therefore the motivation in this paper is twofold: (i) first, to study the early time development of vortices in a straight elongated elliptic configuration (
 $\unicode[STIX]{x1D6FC}=0^{\circ }$
) and (ii) to extend the knowledge thereby obtained to analyse an inclined elongated elliptic configuration.
$\unicode[STIX]{x1D6FC}=0^{\circ }$
) and (ii) to extend the knowledge thereby obtained to analyse an inclined elongated elliptic configuration.
Experimentally, generating an elliptic inhomogeneity that can also be inclined is a vital part of the investigation. Inspired by Markstein (Reference Markstein1957) and Rudinger & Somers (Reference Rudinger and Somers1960), who utilized heat to create a slow/fast (heavy/light) density inhomogeneity, we implement a new technique based on the principle of ‘Joule heating’. This technique, successfully used in our previous work (Sembian, Liverts & Apazidis Reference Sembian, Liverts and Apazidis2018) to create straight elliptic inhomogeneities (
 $\unicode[STIX]{x1D6FC}=0^{\circ }$
), is extended in this paper to generate inclined ones. This inhomogeneity is impacted by a plane wave of shock Mach number 2.15 with a blast profile generated by using an exploding wire technique. An existing in-house numerical code solving a full set of 2-D compressible Navier–Stokes equations is used to interpret and analyse the experimentally observed flow features.
$\unicode[STIX]{x1D6FC}=0^{\circ }$
), is extended in this paper to generate inclined ones. This inhomogeneity is impacted by a plane wave of shock Mach number 2.15 with a blast profile generated by using an exploding wire technique. An existing in-house numerical code solving a full set of 2-D compressible Navier–Stokes equations is used to interpret and analyse the experimentally observed flow features.
Such elongated inhomogeneities are also used in energy deposition problems that are mainly targeted towards flow control and drag reduction in supersonic and hypersonic flight. Energy deposition is a method of controlling the aerodynamic forces and moments through localized regions of thin elongated low density/heated channels (Mirels Reference Mirels1986; Artem’ev et al. Reference Artem’ev, Bergel’Son, Nemchinov, Orlova, Smirnov and Khazins1989, Reference Artem’ev, Bergel’Son, Medvedyuk, Orlova, Nemchinovand, Rybakov and Khazins1993; Aleksandrov Reference Aleksandrov1993; Nemchinov et al. Reference Nemchinov, Artem’ev, Bergel’Son, Khazins, Orlova and Rybakov1994; Grun et al. Reference Grun, Burris, Joyce, Slinker, Huba, Evans, Manka, Barthel and Wiehe1998; Svetsov Reference Svetsov2001; Knight, Azarova & Kolesnichenko Reference Knight, Azarova and Kolesnichenko2009; Georgievskii, Levin & Sutyrin Reference Georgievskii, Levin and Sutyrin2010, Reference Georgievskii, Levin and Sutyrin2016; Azarova, Knight & Kolesnichenko Reference Azarova, Knight and Kolesnichenko2013), plasma/glow discharge (Klimov et al. Reference Klimov, Koblov, Mishin, Serov and Yavor1982; Gordeev et al. Reference Gordeev, Krasil’Nikov, Lagutin and Otmennikov1996; Ganguly, Bletzinger & Garscadden Reference Ganguly, Bletzinger and Garscadden1997; Macheret et al. Reference Macheret, Ionikh, Chernysheva, Yalin, Martinelli and Miles2001; Zudov et al. Reference Zudov, Tret’yakov, Tupikin and Yakovlev2003) or jets (Zudov Reference Zudov2010; Tretyakov, Tupikin & Zudov Reference Tretyakov, Tupikin and Zudov2012) generated ahead of the vehicle body. A selected survey on drag reduction at high speeds can be found in Knight (Reference Knight2008). Generally, when a shock wave propagates through such channels with a high speed of sound, a thermal precursor shock (a wedge-shaped disturbance) forms as a result of the acceleration of the refracted shock from the incident shock (Mirels Reference Mirels1986; Artem’ev et al. Reference Artem’ev, Bergel’Son, Medvedyuk, Orlova, Nemchinovand, Rybakov and Khazins1993). This phenomenon was observed much earlier in a classical work by Jahn (Reference Jahn1956) due to irregular refraction at the interface between two gas layers. While the influence of magnetic fields on the flow was examined by Aleksandrov (Reference Aleksandrov1993), the generation of an intense vortex motion ahead of the vehicle body was investigated by Artem’ev et al. (Reference Artem’ev, Bergel’Son, Medvedyuk, Orlova, Nemchinovand, Rybakov and Khazins1993). Grun et al. (Reference Grun, Burris, Joyce, Slinker, Huba, Evans, Manka, Barthel and Wiehe1998) measured the precursor thermal layer with respect to its growth as a function of time. Later Knight et al. (Reference Knight, Azarova and Kolesnichenko2009) and Azarova, Knight & Kolesnichenko (Reference Azarova, Knight and Kolesnichenko2010), Azarova et al. (Reference Azarova, Knight and Kolesnichenko2013) established three types of vortex related instabilities namely, RMI, KHI and the instability of flat-parallel tangential discontinuity and investigated their influence on drag reduction. Although the elongated heat channels closely resemble the inhomogeneities generated in this work, they were primarily studied from a drag reduction enhancement point of view, with little to no emphasis on the vortex development. Also, the literature on shock interaction with inclined channels is notably meagre apart from the work of Zudov (Reference Zudov2010) and Tretyakov et al. (Reference Tretyakov, Tupikin and Zudov2012) who studied an oblique shock interaction with subsonic and supersonic jets where the main focus was on the jet characteristics.
2 Experimental set-up
The experimental set-up and the generation of the inhomogeneity are similar to those in our previous work (Sembian et al.
Reference Sembian, Liverts and Apazidis2018). The shock waves are generated by exploding a 0.4 mm diameter copper wire in the test cell consisting of an exploding chamber and a test chamber (figure 1
a). Both of the chambers are constructed in such a way that a uniform channel of length 360 mm, width 74 mm and height 5 mm runs throughout. The test cell is maintained at an ambient pressure of 1 atm. The wire to be exploded, from here on called the ‘exploding wire’, is screwed to the electrodes housed in the exploding chamber. The other ends of the electrodes are connected to a
 $6~\unicode[STIX]{x03BC}\text{F}$
capacitor charged to 12 kV. Upon discharge, the exploding wire is subjected to very high current, resulting in the generation of a cylindrical blast wave. Since the generated cylindrical wave is confined to a narrow rectangular section, it modifies itself into a plane wave with a blast profile. This plane wave then propagates into the test chamber where a 0.2 mm diameter copper wire (from here on called the ‘hot wire’ or simply ‘wire’) is suspended from two 3 mm diameter brass electrodes, one solid (anode) and the other hollow (cathode). Different inclination angles can be obtained by properly positioning the electrodes. The wire is always maintained in a state of tension by passing its other end through a guide cylinder and then connecting it to a freely suspended weight, as shown in figure 1(b). The top and bottom wall of the test chamber are made up of Plexiglas plates, providing a maximum field of view of 200 mm in length for visual access. The wire is subjected to a 24 V, 3.6 A current, resulting in heating up of the wire. This in turn heats the air surrounding the wire, producing a density inhomogeneity.
$6~\unicode[STIX]{x03BC}\text{F}$
capacitor charged to 12 kV. Upon discharge, the exploding wire is subjected to very high current, resulting in the generation of a cylindrical blast wave. Since the generated cylindrical wave is confined to a narrow rectangular section, it modifies itself into a plane wave with a blast profile. This plane wave then propagates into the test chamber where a 0.2 mm diameter copper wire (from here on called the ‘hot wire’ or simply ‘wire’) is suspended from two 3 mm diameter brass electrodes, one solid (anode) and the other hollow (cathode). Different inclination angles can be obtained by properly positioning the electrodes. The wire is always maintained in a state of tension by passing its other end through a guide cylinder and then connecting it to a freely suspended weight, as shown in figure 1(b). The top and bottom wall of the test chamber are made up of Plexiglas plates, providing a maximum field of view of 200 mm in length for visual access. The wire is subjected to a 24 V, 3.6 A current, resulting in heating up of the wire. This in turn heats the air surrounding the wire, producing a density inhomogeneity.

Figure 1. (a) Test unit (top view), (b) cut section view of the test chamber (side view).
The propagation of the shock wave through the inhomogeneity is captured as shadowgraph images by an optical set-up. Two types of camera are used in capturing the flow structures. A high-speed camera (Shimadzu HPV-X2) set to capture at 0.5 million fps (frames per second) is used for temporal resolution, and a digital still camera (Nikon D90) with 13 MP is utilized for spatial resolution. Images captured using this set-up have a resolution of
 $0.42~\text{mm}~\text{pixel}^{-1}$
and
$0.42~\text{mm}~\text{pixel}^{-1}$
and
 $0.07~\text{mm}~\text{pixel}^{-1}$
respectively. Depending on the camera used, the light source is either a continuous mode argon–ion laser (Spectra-physics BeamLok 2060) or a single pulsed Nd:YAG laser (New wave Orion).
$0.07~\text{mm}~\text{pixel}^{-1}$
respectively. Depending on the camera used, the light source is either a continuous mode argon–ion laser (Spectra-physics BeamLok 2060) or a single pulsed Nd:YAG laser (New wave Orion).

Figure 2. Current supplied time versus heat spread.
The effective thickness b of the inhomogeneity is influenced by the amount of time the wire is subjected to the current. Single-shot shadowgraph images showing the effect of the current supply time to the spreading of heat is presented in figure 2. As the wire is suspended in the middle of a thin 5 mm channel, the heat from the wire reaches the Plexiglas plates, making them soft and pliable at the contact region. This affects the optical properties at the surface, making it partially opaque, as depicted by the dark region, indicated by ‘Hot gas’ in figure 2(b). After approximately 60 s, the heat has spread to
 $b=10\pm 2~\text{mm}$
with an overall shape resembling an ellipse along the inclination axis. Since the heat fills the 5 mm channel (wall to wall) coupled with the subsequent heating of the top and bottom plates, the resulting inhomogeneity is approximated by a D configuration. Although there exists a gradient at the interface with a finite thickness, the distribution of the temperature in the transverse direction can be safely approximated by a step function based on the shape of the transmitted shock. In the presence of large gradients, the transmitted shock will be curved but, as will be shown in § 4, the transmitted shock in our case is very slightly curved, leading to the step function approximation. Also, the observed features were found to be largely unaffected by the temperature gradients, as discussed in Sembian et al. (Reference Sembian, Liverts and Apazidis2018).
$b=10\pm 2~\text{mm}$
with an overall shape resembling an ellipse along the inclination axis. Since the heat fills the 5 mm channel (wall to wall) coupled with the subsequent heating of the top and bottom plates, the resulting inhomogeneity is approximated by a D configuration. Although there exists a gradient at the interface with a finite thickness, the distribution of the temperature in the transverse direction can be safely approximated by a step function based on the shape of the transmitted shock. In the presence of large gradients, the transmitted shock will be curved but, as will be shown in § 4, the transmitted shock in our case is very slightly curved, leading to the step function approximation. Also, the observed features were found to be largely unaffected by the temperature gradients, as discussed in Sembian et al. (Reference Sembian, Liverts and Apazidis2018).
3 Numerical simulation
The numerical simulations were performed using an existing in-house code solving a full set of 2-D compressible Navier–Stokes equations with air as the test gas.
 $$\begin{eqnarray}\boldsymbol{U}_{t}+(\boldsymbol{F}_{a_{x}}+\boldsymbol{F}_{b_{y}})-(\boldsymbol{G}_{a_{x}}+\boldsymbol{G}_{b_{y}})=0,\end{eqnarray}$$
where
 $\boldsymbol{U}$
represent the vectors of conservative quantities,
$\boldsymbol{U}$
represent the vectors of conservative quantities,
 $\boldsymbol{F}_{a}$
and
$\boldsymbol{F}_{a}$
and
 $\boldsymbol{F}_{b}$
the vectors of inviscid flux and
$\boldsymbol{F}_{b}$
the vectors of inviscid flux and
 $\boldsymbol{G}_{a}$
and
$\boldsymbol{G}_{a}$
and
 $\boldsymbol{G}_{b}$
the vectors of viscous flux in the
$\boldsymbol{G}_{b}$
the vectors of viscous flux in the
 $x$
and
$x$
and
 $y$
directions respectively.
$y$
directions respectively.
 $$\begin{eqnarray}\boldsymbol{U}=\left[\begin{array}{@{}c@{}}\unicode[STIX]{x1D70C}\\ \unicode[STIX]{x1D70C}u\\ \unicode[STIX]{x1D70C}v\\ \unicode[STIX]{x1D70C}E\end{array}\right];\quad \boldsymbol{F}_{a}=\left[\begin{array}{@{}c@{}}\unicode[STIX]{x1D70C}u\\ \unicode[STIX]{x1D70C}u^{2}+p\\ \unicode[STIX]{x1D70C}uv\\ \unicode[STIX]{x1D70C}Eu+pu\end{array}\right];\quad \boldsymbol{F}_{b}=\left[\begin{array}{@{}c@{}}\unicode[STIX]{x1D70C}v\\ \unicode[STIX]{x1D70C}uv\\ \unicode[STIX]{x1D70C}v^{2}+p\\ \unicode[STIX]{x1D70C}Ev+pv\end{array}\right]\end{eqnarray}$$
 $$\begin{eqnarray}\boldsymbol{G}_{a}=\left[\begin{array}{@{}c@{}}0\\ \unicode[STIX]{x1D70F}_{xx}\\ \unicode[STIX]{x1D70F}_{xy}\\ u\unicode[STIX]{x1D70F}_{xx}+v\unicode[STIX]{x1D70F}_{xy}-q_{x}\end{array}\right];\quad \boldsymbol{G}_{b}=\left[\begin{array}{@{}c@{}}0\\ \unicode[STIX]{x1D70F}_{xy}\\ \unicode[STIX]{x1D70F}_{yy}\\ u\unicode[STIX]{x1D70F}_{xy}+v\unicode[STIX]{x1D70F}_{yy}-q_{y}\end{array}\right],\end{eqnarray}$$
where
 $$\begin{eqnarray}\left.\begin{array}{@{}c@{}}\unicode[STIX]{x1D70F}_{xx}=2\unicode[STIX]{x1D707}u_{x}-{\textstyle \frac{2}{3}}\unicode[STIX]{x1D707}(u_{x}+v_{y});\quad \unicode[STIX]{x1D70F}_{yy}=2\unicode[STIX]{x1D707}v_{y}-{\textstyle \frac{2}{3}}\unicode[STIX]{x1D707}(u_{x}+v_{y});\\ \unicode[STIX]{x1D70F}_{xy}=\unicode[STIX]{x1D707}(u_{y}+v_{x});\quad q_{x}=-\unicode[STIX]{x1D705}T_{x};\quad q_{y}=-\unicode[STIX]{x1D705}T_{y}.\end{array}\right\}\end{eqnarray}$$
Here
 $\unicode[STIX]{x1D70C}$
,
$\unicode[STIX]{x1D70C}$
,
 $u$
,
$u$
,
 $v$
,
$v$
,
 $p$
,
$p$
,
 $E$
,
$E$
,
 $T$
, denote density, particle velocity components in the
$T$
, denote density, particle velocity components in the
 $\mathit{x}$
and
$\mathit{x}$
and
 $\mathit{y}$
directions, pressure, specific total energy and temperature respectively. Dynamic viscosity (
$\mathit{y}$
directions, pressure, specific total energy and temperature respectively. Dynamic viscosity (
 $\unicode[STIX]{x1D707}$
) (Johnson Reference Johnson2016) and thermal conductivity (
$\unicode[STIX]{x1D707}$
) (Johnson Reference Johnson2016) and thermal conductivity (
 $\unicode[STIX]{x1D705}$
) for air are temperature dependent and are calculated using the following relations:
$\unicode[STIX]{x1D705}$
) for air are temperature dependent and are calculated using the following relations:
 $$\begin{eqnarray}\left.\begin{array}{@{}c@{}}\unicode[STIX]{x1D707}=\unicode[STIX]{x1D707}_{0}\left({\displaystyle \frac{T}{T_{0}}}\right)^{1.5}{\displaystyle \frac{T_{0}+110}{T+110}}\\ \unicode[STIX]{x1D705}=1.527\text{e}^{-11}T^{3}-4.8574\text{e}^{-08}T^{2}+1.0184\text{e}^{-04}T-0.00039333.\end{array}\right\}\end{eqnarray}$$
The equation for
 $\unicode[STIX]{x1D705}$
is obtained by curve fitting the data found in Stephan & Laesecke (Reference Stephan and Laesecke1985). Other relevant thermodynamic properties of air at normal atmospheric conditions are used. The system of equations are closed by modelling the ideal gas law. Given an interface with normal vector
$\unicode[STIX]{x1D705}$
is obtained by curve fitting the data found in Stephan & Laesecke (Reference Stephan and Laesecke1985). Other relevant thermodynamic properties of air at normal atmospheric conditions are used. The system of equations are closed by modelling the ideal gas law. Given an interface with normal vector
 $\boldsymbol{n}=(n_{x},n_{y})$
,
$\boldsymbol{n}=(n_{x},n_{y})$
,
 $\boldsymbol{U}$
and
$\boldsymbol{U}$
and
 $\boldsymbol{F}$
can be expressed in the direction of the normal face
$\boldsymbol{F}$
can be expressed in the direction of the normal face
 $n$
as,
$n$
as,
 $$\begin{eqnarray}\left[\begin{array}{@{}c@{}}\unicode[STIX]{x1D70C}\\ \unicode[STIX]{x1D70C}q_{n}\\ \unicode[STIX]{x1D70C}q_{t}\\ \unicode[STIX]{x1D70C}E\end{array}\right]+\left[\begin{array}{@{}c@{}}\unicode[STIX]{x1D70C}q_{n}\\ \unicode[STIX]{x1D70C}q_{n}^{2}+p\\ \unicode[STIX]{x1D70C}q_{n}q_{t}\\ \unicode[STIX]{x1D70C}Eq_{n}+pq_{n}\end{array}\right]-\boldsymbol{G}_{x,y}=0,\end{eqnarray}$$
where the normal (
 $q_{n}$
) and tangential (
$q_{n}$
) and tangential (
 $q_{t}$
) velocities through the interface are given as,
$q_{t}$
) velocities through the interface are given as,
 $$\begin{eqnarray}\left.\begin{array}{@{}c@{}}q_{n}=un_{x}+vn_{y}\\ q_{t}=vn_{x}-un_{y}\end{array}\right\}.\end{eqnarray}$$
The equations are solved numerically using a scheme termed AUFSR and proposed by Tchuen et al. (Reference Tchuen, Fogang, Burtschell and Woafo2014), which combines the efficiency of artificial upstream flux vector splitting (AUFS) scheme with the accuracy of Roe’s solver. The AUFS is a special flux vector splitting (FVS) scheme proposed by Sun & Takayama (Reference Sun and Takayama2003), that introduces two artificial wave speeds into the flux decomposition to adjust the direction of wave propagation. While it is an accurate and robust technique for resolving entropy waves without the carbuncle problem (MacCormack Reference MacCormack2011), it has some shortcomings when resolving shear layers (Kemm Reference Kemm2015). Roe’s scheme is a flux difference splitting (FDS) scheme that is known to resolve shear layers accurately but suffers from the carbuncle problem. The AUFSR overcomes these disadvantages by implementing the artificial wave speed technique with Roe’s solver, thereby introducing a certain amount of numerical dissipation to the shear waves. Hence, the AUFSR scheme is not only robust for shock capturing but also accurate for resolving shear layers. The basic idea is to split the flux vector
 $\boldsymbol{F}$
in (3.6) as,
$\boldsymbol{F}$
in (3.6) as,
 $$\begin{eqnarray}\boldsymbol{F}=(1-\boldsymbol{S})\boldsymbol{F}_{1}+\boldsymbol{S}\boldsymbol{F}_{2},\end{eqnarray}$$
where
 $\boldsymbol{F}_{1}$
and
$\boldsymbol{F}_{1}$
and
 $\boldsymbol{F}_{2}$
are the intermediate flux vectors, and
$\boldsymbol{F}_{2}$
are the intermediate flux vectors, and
 $\boldsymbol{S}=s_{1}/(s_{1}-s_{2})$
, where
$\boldsymbol{S}=s_{1}/(s_{1}-s_{2})$
, where
 $s_{1}$
and
$s_{1}$
and
 $s_{2}$
are the artificial wave speeds.
$s_{2}$
are the artificial wave speeds.
 $\boldsymbol{F}_{1}$
and
$\boldsymbol{F}_{1}$
and
 $\boldsymbol{F}_{2}$
, are calculated from,
$\boldsymbol{F}_{2}$
, are calculated from,
 $$\begin{eqnarray}\displaystyle & \boldsymbol{F}_{1}={\textstyle \frac{1}{2}}(\boldsymbol{P}^{L}+\boldsymbol{P}^{R})+\unicode[STIX]{x1D6FF}\boldsymbol{U}, & \displaystyle\end{eqnarray}$$
 $$\begin{eqnarray}\displaystyle & \displaystyle \boldsymbol{F}_{2}=\boldsymbol{U}^{\unicode[STIX]{x1D701}}(u^{\unicode[STIX]{x1D701}}-s_{2})+\boldsymbol{P}^{\unicode[STIX]{x1D701}},\quad \unicode[STIX]{x1D701}=\left\{\begin{array}{@{}ll@{}}L\quad & \text{for }s_{1}>0,\\ R\quad & \text{for }s_{1}\leqslant 0.\end{array}\right. & \displaystyle\end{eqnarray}$$
The artificial viscosity,
 $\unicode[STIX]{x1D6FF}\boldsymbol{U}$
, is given as
$\unicode[STIX]{x1D6FF}\boldsymbol{U}$
, is given as
 $$\begin{eqnarray}\unicode[STIX]{x1D6FF}\boldsymbol{U}=\frac{1}{2}\left[(q_{n}^{L}-s_{1})\boldsymbol{U}^{L}+(q_{n}^{R}-s_{1})\boldsymbol{U}^{R}\right]-\frac{1}{2}\mathop{\sum }_{k=1}^{4}|\unicode[STIX]{x1D706}_{k}|\unicode[STIX]{x1D702}_{k}R_{k},\end{eqnarray}$$
where
 $\unicode[STIX]{x1D706}_{k}$
,
$\unicode[STIX]{x1D706}_{k}$
,
 $\unicode[STIX]{x1D702}_{k}$
and
$\unicode[STIX]{x1D702}_{k}$
and
 $R_{k}$
are the eigenvalues, characteristic variables and eigenvectors calculated using Roe averaged values respectively.
$R_{k}$
are the eigenvalues, characteristic variables and eigenvectors calculated using Roe averaged values respectively.
The numerical values of
 $s_{1}$
and
$s_{1}$
and
 $s_{2}$
are computed using,
$s_{2}$
are computed using,
 $$\begin{eqnarray}\left.\begin{array}{@{}c@{}}s_{1}=\bar{q_{n}}\\ s_{2}=\left\{\begin{array}{@{}ll@{}}\min (0,q_{n}^{L}-c^{L},\bar{q_{n}}-\bar{c})\quad & \text{for }s_{1}>0,\\ \max (0,q_{n}^{R}+c^{R},\bar{q_{n}}+\bar{c})\quad & \text{for }s_{1}\leqslant 0,\end{array}\right.\end{array}\right\}\end{eqnarray}$$
where,
 $$\begin{eqnarray}\left.\begin{array}{@{}c@{}}\bar{q_{n}}={\displaystyle \frac{\sqrt{\unicode[STIX]{x1D70C}^{L}}q_{n}^{L}+\sqrt{\unicode[STIX]{x1D70C}^{R}}q_{n}^{R}}{\sqrt{\unicode[STIX]{x1D70C}^{L}}+\sqrt{\unicode[STIX]{x1D70C}^{R}}}}\\ \bar{c}=\left[(\unicode[STIX]{x1D6FE}-1)\left(\begin{array}{@{}c@{}}\bar{H}-\frac{1}{2}\bar{u}^{2}\end{array}\right)\right]^{1/2}\\ \bar{H}={\displaystyle \frac{\sqrt{\unicode[STIX]{x1D70C}^{L}}H^{L}+\sqrt{\unicode[STIX]{x1D70C}^{R}}H^{R}}{\sqrt{\unicode[STIX]{x1D70C}^{L}}+\sqrt{\unicode[STIX]{x1D70C}^{R}}}}.\end{array}\right\}\end{eqnarray}$$
A more detailed description can be found in Tchuen et al. (Reference Tchuen, Fogang, Burtschell and Woafo2014).
3.1 Domain description and initial conditions

Figure 3. Computational domain.
The computational domain of the simulated problem is as shown in figure 3. All boundaries are set with wall boundary conditions. Depending on
 $\unicode[STIX]{x1D6FC}$
, the entire domain was meshed with 2.5–5.5 million cells (unstructured triangle) refined along the axis of inclination. The mesh size varies slowly and smoothly as we go outwards from the axis with the smallest and the largest cell size being 0.025 mm and 0.15 mm respectively. The values of the properties of the flow have stagnated, exhibiting mesh independency. Due to the associated complexities in the problem coupled with the need for large computing resources required to resolve the finer structures, the simulations are performed assuming a 2-D inhomogeneity even for small
$\unicode[STIX]{x1D6FC}$
, the entire domain was meshed with 2.5–5.5 million cells (unstructured triangle) refined along the axis of inclination. The mesh size varies slowly and smoothly as we go outwards from the axis with the smallest and the largest cell size being 0.025 mm and 0.15 mm respectively. The values of the properties of the flow have stagnated, exhibiting mesh independency. Due to the associated complexities in the problem coupled with the need for large computing resources required to resolve the finer structures, the simulations are performed assuming a 2-D inhomogeneity even for small
 $b$
values. Although this is an approximation, it will be shown later in § 4 that the prediction results are identical to the experiments, justifying the assumption. The numerical analysis can be thought of as an accurate first-order estimate. The experiment was simulated numerically by replacing the exploding wire with a high pressure region with the following initial conditions:
$b$
values. Although this is an approximation, it will be shown later in § 4 that the prediction results are identical to the experiments, justifying the assumption. The numerical analysis can be thought of as an accurate first-order estimate. The experiment was simulated numerically by replacing the exploding wire with a high pressure region with the following initial conditions:
 $$\begin{eqnarray}(\unicode[STIX]{x1D70C},u,p)=\left\{\begin{array}{@{}ll@{}}(140~\text{kg}~\text{m}^{-3},0~\text{m}~\text{s}^{-1},15~\text{MPa})\quad & \text{for }1~\text{mm}\leqslant x\leqslant 3~\text{mm},\\ (1.17~\text{kg}~\text{m}^{-3},0~\text{m}~\text{s}^{-1},0.1~\text{MPa})\quad & \text{ for }x\leqslant 1~\text{mm}\text{ and }x\geqslant 3~\text{mm}.\end{array}\right.\end{eqnarray}$$
The above initial conditions were chosen by trial-and-error method to match the experimental pressure traces obtained from three piezoelectric pressure sensors, S1–S3 (113B24 PCB Piezotronics), flush mounted on the windows at 205 mm, 245 mm and 285 mm from the exploding wire plane, respectively. The uncertainty in determination of the peak pressure amplitude and time of arrival measured from a set of 5 repeatability tests were
 $\pm 5.5\,\%$
and
$\pm 5.5\,\%$
and
 $\pm 0.5\,\%$
respectively. Apart from demonstrating the simulation prediction accuracy, figure 4 also shows the blast wave profile along with its associated shock Mach number at each sensor which were
$\pm 0.5\,\%$
respectively. Apart from demonstrating the simulation prediction accuracy, figure 4 also shows the blast wave profile along with its associated shock Mach number at each sensor which were
 $2.15\pm 0.05$
,
$2.15\pm 0.05$
,
 $2.04\pm 0.05$
and
$2.04\pm 0.05$
and
 $1.98\pm 0.05$
respectively.
$1.98\pm 0.05$
respectively.

Figure 4. Comparison between experimental and numerical pressure trace at three sensor positions: S1 at 205 mm, S2 at 245 mm and S3 at 285 mm from the exploding wire plane.

Figure 5. Experimental shadowgraph (left) and numerical density gradient (right) images depicting the disturbances due to the anode. The times, (a)
 $t=48~\unicode[STIX]{x03BC}\text{s}$
and (b)
$t=48~\unicode[STIX]{x03BC}\text{s}$
and (b)
 $t=123~\unicode[STIX]{x03BC}\text{s}$
are relative to the initial shock wave impact at the anode.
$t=123~\unicode[STIX]{x03BC}\text{s}$
are relative to the initial shock wave impact at the anode.
It is important to know the disturbances in the flow due to the 3 mm anode prior to conducting the experiments with the inhomogeneity. In this way, the disturbances can be identified later and neglected from the analysis. As can be seen in figure 5, the shock diffraction around the anode results in a reflected wave (
 $R_{c}$
) and a Mach stem. The collision of the Mach–Mach stem (
$R_{c}$
) and a Mach stem. The collision of the Mach–Mach stem (
 $MM_{c}$
) behind the cylinder gives rise to shock patterns, as shown in figure 5(a). As it travels downstream, the initial reflected wave get reflected from the side walls forming a ‘concave’ structure, as in figure 5(b). The results of numerical simulation performed with a 3 mm cylinder are shown as a density gradient image beside each shadowgraph image. The magnitude of the density gradient field is calculated as (Quirk & Karni Reference Quirk and Karni1996),
$MM_{c}$
) behind the cylinder gives rise to shock patterns, as shown in figure 5(a). As it travels downstream, the initial reflected wave get reflected from the side walls forming a ‘concave’ structure, as in figure 5(b). The results of numerical simulation performed with a 3 mm cylinder are shown as a density gradient image beside each shadowgraph image. The magnitude of the density gradient field is calculated as (Quirk & Karni Reference Quirk and Karni1996),
 $$\begin{eqnarray}|\unicode[STIX]{x1D735}\unicode[STIX]{x1D70C}|=\left[\begin{array}{@{}c@{}}\left({\displaystyle \frac{\unicode[STIX]{x2202}\unicode[STIX]{x1D70C}}{\unicode[STIX]{x2202}x}}\right)^{2}+\left({\displaystyle \frac{\unicode[STIX]{x2202}\unicode[STIX]{x1D70C}}{\unicode[STIX]{x2202}y}}\right)^{2}\end{array}\right]^{1/2}.\end{eqnarray}$$
4 Results and discussion

Figure 6. Single shot (high spatial resolution) experimental shadowgraph images (a,b) for straight inhomogeneities (
 $\unicode[STIX]{x1D6FC}=0^{\circ }$
) along with their corresponding numerical density gradient (c,d) and vorticity magnitude (e,f) for the
$\unicode[STIX]{x1D6FC}=0^{\circ }$
) along with their corresponding numerical density gradient (c,d) and vorticity magnitude (e,f) for the
 $b=3~\text{mm}$
and
$b=3~\text{mm}$
and
 $b=10~\text{mm}$
case.
$b=10~\text{mm}$
case.

Figure 7. Sequence of high-speed experimental images at normalized time
 $t/t_{o}=0.14$
, 0.28, 0.42, 0.55, 0.69, 0,83 for
$t/t_{o}=0.14$
, 0.28, 0.42, 0.55, 0.69, 0,83 for
 $b=3~\text{mm}$
case.
$b=3~\text{mm}$
case.

Figure 8. Sequence of high-speed experimental images at normalized time
 $t/t_{o}=0.13$
, 0.27, 0.41, 0.54, 0.68, 0,81 for
$t/t_{o}=0.13$
, 0.27, 0.41, 0.54, 0.68, 0,81 for
 $b=10~\text{mm}$
case.
$b=10~\text{mm}$
case.
The experiments are conducted for a set of two different inclination angles (
 $\unicode[STIX]{x1D6FC}$
) with each set comprising two
$\unicode[STIX]{x1D6FC}$
) with each set comprising two
 $b$
values. The evolution of two straight elliptic inhomogeneities (
$b$
values. The evolution of two straight elliptic inhomogeneities (
 $\unicode[STIX]{x1D6FC}=0^{\circ }$
) with
$\unicode[STIX]{x1D6FC}=0^{\circ }$
) with
 $b=3~\text{mm}$
and 10 mm shocked by an initially plane blast wave of strength Mach 2.15 are as shown in figures 6–8. Figure 6(a,b) is a single shot shadowgraph image with high spatial resolution while figures 7 and 8 represent images taken with the high-speed camera. With the aid of numerical simulation, the hot gas density (
$b=3~\text{mm}$
and 10 mm shocked by an initially plane blast wave of strength Mach 2.15 are as shown in figures 6–8. Figure 6(a,b) is a single shot shadowgraph image with high spatial resolution while figures 7 and 8 represent images taken with the high-speed camera. With the aid of numerical simulation, the hot gas density (
 $\unicode[STIX]{x1D70C}_{h}$
) for this case was determined to be
$\unicode[STIX]{x1D70C}_{h}$
) for this case was determined to be
 $0.5\pm 0.03~\text{kg}~\text{m}^{-3}$
by a trial-and-error method i.e. by adjusting
$0.5\pm 0.03~\text{kg}~\text{m}^{-3}$
by a trial-and-error method i.e. by adjusting
 $\unicode[STIX]{x1D70C}_{h}$
in the simulation until the distance travelled by the incident shock and the transmitted shock matches with the experimental measurement. The corresponding numerical simulation results are shown as density gradient images (c,d) and vorticity magnitude in figure 6. By juxtaposing experimental and numerical images (figure 6), it can be seen that the simulation captured important structures observed in experiments with sufficient accuracy. As expected, when a shock wave encounters such a medium, it gets reflected and transmitted. Since this is a slow/fast case, the absolute velocity of the transmitted shock wave is higher and tends to travel faster than the incident shock. Also, the transmitted shock curvature is very small, justifying the step function approximation for the temperature distribution (Sembian et al.
Reference Sembian, Liverts and Apazidis2018). The transmitted shock wave is connected to the incident shock through a precursor shock initiating a quadruple point at its intersection with the Mach stem and reflected shock. The flow field is symmetric along the inclination axis. The transmitted shock propagation speed also varies slightly corresponding to
$\unicode[STIX]{x1D70C}_{h}$
in the simulation until the distance travelled by the incident shock and the transmitted shock matches with the experimental measurement. The corresponding numerical simulation results are shown as density gradient images (c,d) and vorticity magnitude in figure 6. By juxtaposing experimental and numerical images (figure 6), it can be seen that the simulation captured important structures observed in experiments with sufficient accuracy. As expected, when a shock wave encounters such a medium, it gets reflected and transmitted. Since this is a slow/fast case, the absolute velocity of the transmitted shock wave is higher and tends to travel faster than the incident shock. Also, the transmitted shock curvature is very small, justifying the step function approximation for the temperature distribution (Sembian et al.
Reference Sembian, Liverts and Apazidis2018). The transmitted shock wave is connected to the incident shock through a precursor shock initiating a quadruple point at its intersection with the Mach stem and reflected shock. The flow field is symmetric along the inclination axis. The transmitted shock propagation speed also varies slightly corresponding to
 $b$
. For instance, to traverse the 145 mm long inhomogeneity, it takes
$b$
. For instance, to traverse the 145 mm long inhomogeneity, it takes
 $180\pm 5~\unicode[STIX]{x03BC}\text{s}$
and
$180\pm 5~\unicode[STIX]{x03BC}\text{s}$
and
 $185\pm 5~\unicode[STIX]{x03BC}\text{s}$
for
$185\pm 5~\unicode[STIX]{x03BC}\text{s}$
for
 $b=3~\text{mm}$
and 10 mm respectively. The propagation distance
$b=3~\text{mm}$
and 10 mm respectively. The propagation distance
 $x$
, defined as the distance travelled by the transmitted shock wave through the inhomogeneity (figure 9
a), is measured at an interval of
$x$
, defined as the distance travelled by the transmitted shock wave through the inhomogeneity (figure 9
a), is measured at an interval of
 $10~\unicode[STIX]{x03BC}\text{s}$
and the non-dimensionalized
$10~\unicode[STIX]{x03BC}\text{s}$
and the non-dimensionalized
 $x{-}t$
diagram for both thicknesses is plotted in figure 9(b). The propagation distance
$x{-}t$
diagram for both thicknesses is plotted in figure 9(b). The propagation distance
 $x$
is normalized by the overall length of the inhomogeneity (
$x$
is normalized by the overall length of the inhomogeneity (
 $x_{o}=145~\text{mm}$
) and the time
$x_{o}=145~\text{mm}$
) and the time
 $t$
is normalized with
$t$
is normalized with
 $t_{o}$
, the time taken to traverse (
$t_{o}$
, the time taken to traverse (
 $x_{o}$
). The variation is almost linear across both thicknesses and the speed difference is very small compared to the overall propagation time scale.
$x_{o}$
). The variation is almost linear across both thicknesses and the speed difference is very small compared to the overall propagation time scale.

Figure 9. (a) Schematic drawing illustrating the notations associated with the test configuration; (b) normalized propagation distance (
 $x/x_{0}$
) as a function of
$x/x_{0}$
) as a function of
 $t/t_{o}$
; (c) normalized width (
$t/t_{o}$
; (c) normalized width (
 $d/b$
) and (d) normalized length (
$d/b$
) and (d) normalized length (
 $l/x_{0}$
) of the vortices as a function of
$l/x_{0}$
) of the vortices as a function of
 $x/x_{0}$
. The corresponding numerical results are also plotted against their experimental values.
$x/x_{0}$
. The corresponding numerical results are also plotted against their experimental values.


During this period of shock interaction, vorticity is deposited locally on the interface due to the misalignment between the density and pressure gradients resulting in the formation of two counter-rotating vortices. The sense of rotation of the vortex is clockwise (negative) on the bottom half and counter-clockwise (positive) on the top half, as shown in figure 6(e,f). The vortices are observed experimentally from figures 7(b)–8(b) and grow in both length (
 $l$
) and width (
$l$
) and width (
 $d$
) as the shock propagates further into the region. The corresponding vorticity magnitude (top) and density gradient (bottom) images are shown in figure 10. The size of the vortices is directly related to the mixing characteristics and therefore is an important parameter to analyse. The width of the vortex is scaled with
$d$
) as the shock propagates further into the region. The corresponding vorticity magnitude (top) and density gradient (bottom) images are shown in figure 10. The size of the vortices is directly related to the mixing characteristics and therefore is an important parameter to analyse. The width of the vortex is scaled with
 $b$
, the length with
$b$
, the length with
 $x_{o}$
and both are plotted against
$x_{o}$
and both are plotted against
 $x/x_{o}$
as in figure 9(c,d). For
$x/x_{o}$
as in figure 9(c,d). For
 $b=3~\text{mm}$
,
$b=3~\text{mm}$
,
 $d/b$
increases and reaches a factor of 5.5 at the downstream interface while it reduces to 2 for
$d/b$
increases and reaches a factor of 5.5 at the downstream interface while it reduces to 2 for
 $b=10~\text{mm}$
. Large factor indicates more fluid being entrained by the vortices from the surrounding fluid. On close observation, it is interesting to note that, irrespective of initial thickness, the location of the quadruple point is fairly similar and the vortices always almost fill up the entire region below them. For example, the quadruple point distance measured from the centre axis in figures 7(f)–8(f) is
$b=10~\text{mm}$
. Large factor indicates more fluid being entrained by the vortices from the surrounding fluid. On close observation, it is interesting to note that, irrespective of initial thickness, the location of the quadruple point is fairly similar and the vortices always almost fill up the entire region below them. For example, the quadruple point distance measured from the centre axis in figures 7(f)–8(f) is
 ${\sim}10.9~\text{mm}$
and
${\sim}10.9~\text{mm}$
and
 ${\sim}11.4~\text{mm}$
respectively, providing relatively more fluid for entrainment by vortices resulting in large
${\sim}11.4~\text{mm}$
respectively, providing relatively more fluid for entrainment by vortices resulting in large
 $d/b$
for small
$d/b$
for small
 $b$
values. Conversely, this also implies minor variations in
$b$
values. Conversely, this also implies minor variations in
 $d$
across the various thicknesses which is governed by the shock dynamics in the precursor shock region. Similarly, the length (
$d$
across the various thicknesses which is governed by the shock dynamics in the precursor shock region. Similarly, the length (
 $l$
), which is measured as the distance between the transmitted shock and the downstream edge of the vortex boundary, is also dependent on the precursor shock region and varies linearly with
$l$
), which is measured as the distance between the transmitted shock and the downstream edge of the vortex boundary, is also dependent on the precursor shock region and varies linearly with
 $x$
.
$x$
.
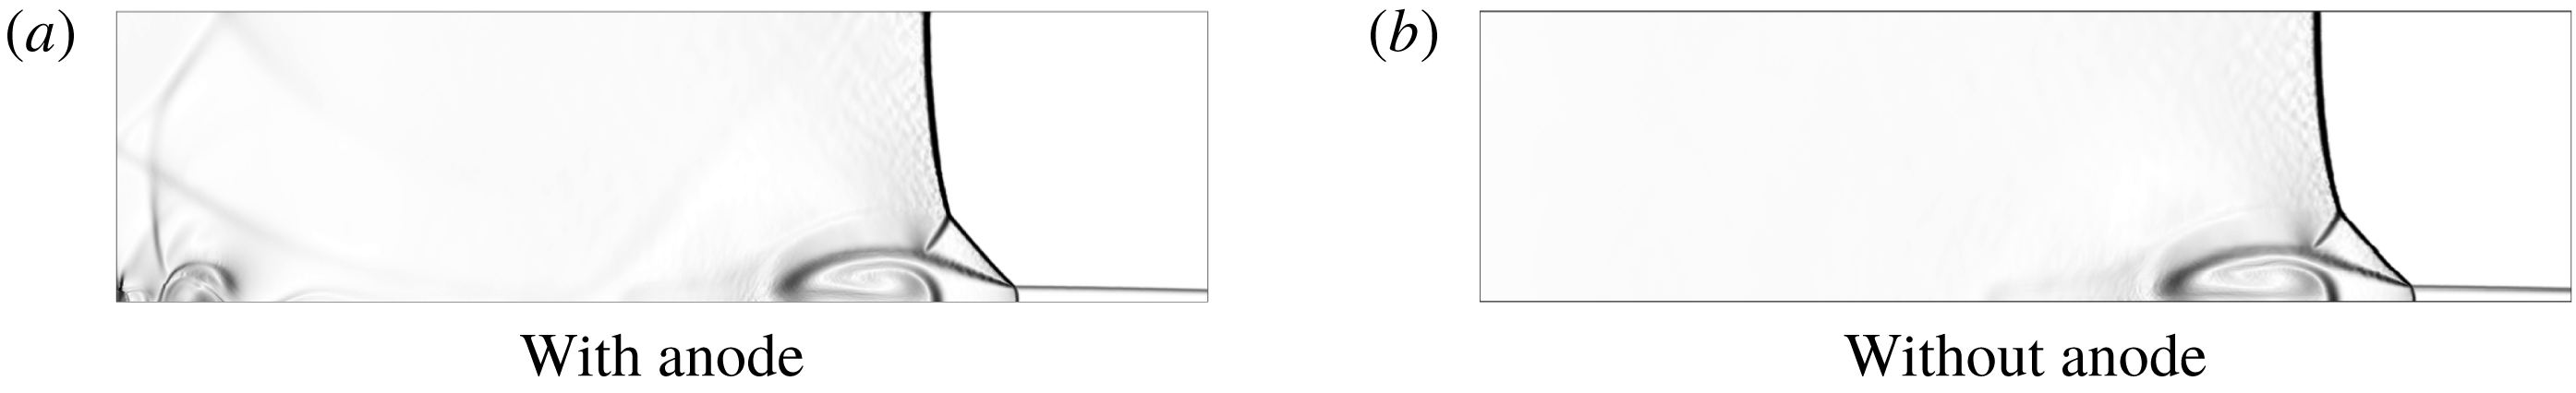
Figure 11. Images showing the effects due to the presence of the anode. Apart from the initial shock reflections, the anode does not affect the evolution of the inhomogeneity. Due to symmetry, only the top half is presented.
Since this is a slow/fast case, the reflected wave was supposed to be an expansion wave. However, due to the presence of a 3 mm solid cylinder (anode), it was reflected as a shock wave. In order to determine this effect on the shock propagation, a numerical simulation with no anode is performed and the results are compared in figure 11. The shock structures are observed to be identical in both cases, with no variation in either
 $l$
or
$l$
or
 $d$
. Although the anode introduces unwanted shock reflections, this proves that the end results are not affected by it.
$d$
. Although the anode introduces unwanted shock reflections, this proves that the end results are not affected by it.
Circulation
 $\unicode[STIX]{x1D6E4}$
, defined as the line integral of velocity around a closed curve, is an important scalar quantity for describing and understanding vortical flows. It quantifies the net strength of the vortices generated by the shock interaction with the inhomogeneity. Several analytical models, like Kelvin’s model (Haas & Sturtevant Reference Haas and Sturtevant1987), the Picone and Boris (PB) model (Picone et al.
Reference Picone, Oran, Boris and Young1984; Picone & Boris Reference Picone and Boris1988), the Yang, Kubota and Zukoski (YKZ) model (Yang et al.
Reference Yang, Kubota and Zukoski1994), the Samtaney and Zabusky (SZ) model (Samtaney & Zabusky Reference Samtaney and Zabusky1994), and the Niederhaus 1-D model (Niederhaus et al.
Reference Niederhaus, Greenough, Oakley, Ranjan, Anderson and Bonazza2007), were formulated to calculate the circulation in shock–bubble interactions. Although the models predict the total circulation (
$\unicode[STIX]{x1D6E4}$
, defined as the line integral of velocity around a closed curve, is an important scalar quantity for describing and understanding vortical flows. It quantifies the net strength of the vortices generated by the shock interaction with the inhomogeneity. Several analytical models, like Kelvin’s model (Haas & Sturtevant Reference Haas and Sturtevant1987), the Picone and Boris (PB) model (Picone et al.
Reference Picone, Oran, Boris and Young1984; Picone & Boris Reference Picone and Boris1988), the Yang, Kubota and Zukoski (YKZ) model (Yang et al.
Reference Yang, Kubota and Zukoski1994), the Samtaney and Zabusky (SZ) model (Samtaney & Zabusky Reference Samtaney and Zabusky1994), and the Niederhaus 1-D model (Niederhaus et al.
Reference Niederhaus, Greenough, Oakley, Ranjan, Anderson and Bonazza2007), were formulated to calculate the circulation in shock–bubble interactions. Although the models predict the total circulation (
 $\unicode[STIX]{x1D6E4}_{o}$
) present at the instant of shock passage, the approach and the underlying assumptions made in arriving at the expressions vary. The PB and YKZ models assume that the shape of the bubble and the density ratio do not change significantly during shock passage so that the effects associated with shock refraction are neglected. The SZ model uses the extension of shock polar analysis on planar interfaces by scaling laws to include the refraction effects on circular interfaces. Niederhaus et al. (Reference Niederhaus, Greenough, Oakley, Ranjan, Anderson and Bonazza2007), on the basis of a series of 3-D simulations, formulated a heuristic model reconstructed using 1-D gas dynamic parameters obtained from modelling. However, the common factor in all these models is that they were formulated for a circular interface with a defined radius (
$\unicode[STIX]{x1D6E4}_{o}$
) present at the instant of shock passage, the approach and the underlying assumptions made in arriving at the expressions vary. The PB and YKZ models assume that the shape of the bubble and the density ratio do not change significantly during shock passage so that the effects associated with shock refraction are neglected. The SZ model uses the extension of shock polar analysis on planar interfaces by scaling laws to include the refraction effects on circular interfaces. Niederhaus et al. (Reference Niederhaus, Greenough, Oakley, Ranjan, Anderson and Bonazza2007), on the basis of a series of 3-D simulations, formulated a heuristic model reconstructed using 1-D gas dynamic parameters obtained from modelling. However, the common factor in all these models is that they were formulated for a circular interface with a defined radius (
 $R$
) where the density gradient is normal to the interface as we move radially outward. Ray et al. (Reference Ray, Samtaney and Zabusky2000), extended the SZ model to an elliptic interface but it is applicable only to heavy prolate gaseous ellipses with the major axis along the vertical direction. In the present study, we use a slow/fast elliptic interface – where the density gradient normal to the interface is no longer radial – with the major axis along the horizontal direction, for which models are non-existent. Deriving a formulation for such cases is beyond the scope of this work, and only numerically determined circulation will be presented. Additionally, the models provide the total circulation (
$R$
) where the density gradient is normal to the interface as we move radially outward. Ray et al. (Reference Ray, Samtaney and Zabusky2000), extended the SZ model to an elliptic interface but it is applicable only to heavy prolate gaseous ellipses with the major axis along the vertical direction. In the present study, we use a slow/fast elliptic interface – where the density gradient normal to the interface is no longer radial – with the major axis along the horizontal direction, for which models are non-existent. Deriving a formulation for such cases is beyond the scope of this work, and only numerically determined circulation will be presented. Additionally, the models provide the total circulation (
 $\unicode[STIX]{x1D6E4}_{o}$
) only after the fastest shock in the system reaches the downstream interface whereas numerically it can be obtained at every shock instant along
$\unicode[STIX]{x1D6E4}_{o}$
) only after the fastest shock in the system reaches the downstream interface whereas numerically it can be obtained at every shock instant along
 $x$
.
$x$
.
Numerically it is calculated following Stokes’ theorem that the circulation around a closed curve is equal to the flux of vorticity (
 $\unicode[STIX]{x1D714}$
) through a closed surface
$\unicode[STIX]{x1D714}$
) through a closed surface
 $S$
.
$S$
.
 $$\begin{eqnarray}\unicode[STIX]{x1D6E4}=\oint _{S}\unicode[STIX]{x1D714}\cdot \,\text{d}S,\end{eqnarray}$$
where
 $$\begin{eqnarray}\unicode[STIX]{x1D714}=\unicode[STIX]{x1D735}\times U\end{eqnarray}$$
and
 $U$
is the velocity vector. Figure 12(a) plots the circulation, calculated along the top half of the inhomogeneity, for
$U$
is the velocity vector. Figure 12(a) plots the circulation, calculated along the top half of the inhomogeneity, for
 $b=3~\text{mm}$
and 10 mm for every 10 mm transmitted shock passage with the dotted line representing a linear fit. As expected, the circulation value is higher for the 10 mm case at all instants owing to the large initial energy from the hot gas coupled with the relatively small energy dissipation through entrainment compared with the 3 mm thickness.
$b=3~\text{mm}$
and 10 mm for every 10 mm transmitted shock passage with the dotted line representing a linear fit. As expected, the circulation value is higher for the 10 mm case at all instants owing to the large initial energy from the hot gas coupled with the relatively small energy dissipation through entrainment compared with the 3 mm thickness.
 $\unicode[STIX]{x1D6E4}$
at
$\unicode[STIX]{x1D6E4}$
at
 $x=145~\text{mm}$
represents the total circulation (
$x=145~\text{mm}$
represents the total circulation (
 $\unicode[STIX]{x1D6E4}_{o}$
) corresponding to each
$\unicode[STIX]{x1D6E4}_{o}$
) corresponding to each
 $b$
and the normalized
$b$
and the normalized
 $\unicode[STIX]{x1D6E4}/\unicode[STIX]{x1D6E4}_{0}$
is plotted against
$\unicode[STIX]{x1D6E4}/\unicode[STIX]{x1D6E4}_{0}$
is plotted against
 $x/x_{o}$
as in figure 12(b). Evidently
$x/x_{o}$
as in figure 12(b). Evidently
 $\unicode[STIX]{x1D6E4}/\unicode[STIX]{x1D6E4}_{0}$
falls along the same line represented by one linear fit equation. To examine the effects of thickness and density, simulations were performed for different combinations of
$\unicode[STIX]{x1D6E4}/\unicode[STIX]{x1D6E4}_{0}$
falls along the same line represented by one linear fit equation. To examine the effects of thickness and density, simulations were performed for different combinations of
 $b$
and
$b$
and
 $\unicode[STIX]{x1D70C}_{h}$
, and the normalized circulation is plotted in figure 12(b). It is interesting to note that all data points follow a unique linear fit equation with a measured growth rate of 0.9715 conveniently decoupling the normalized circulation from thickness and density. The
$\unicode[STIX]{x1D70C}_{h}$
, and the normalized circulation is plotted in figure 12(b). It is interesting to note that all data points follow a unique linear fit equation with a measured growth rate of 0.9715 conveniently decoupling the normalized circulation from thickness and density. The
 $\unicode[STIX]{x1D6E4}_{o}$
for all combinations is tabulated in table 1. Since
$\unicode[STIX]{x1D6E4}_{o}$
for all combinations is tabulated in table 1. Since
 $x/x_{o}$
varies linearly with
$x/x_{o}$
varies linearly with
 $t/t_{o}$
, the variation of
$t/t_{o}$
, the variation of
 $\unicode[STIX]{x1D6E4}/\unicode[STIX]{x1D6E4}_{0}$
with
$\unicode[STIX]{x1D6E4}/\unicode[STIX]{x1D6E4}_{0}$
with
 $t/t_{o}$
will also be linear.
$t/t_{o}$
will also be linear.

Figure 12. (a) Numerically computed circulation (
 $\unicode[STIX]{x1D6E4}$
) as a function of
$\unicode[STIX]{x1D6E4}$
) as a function of
 $x$
for both
$x$
for both
 $b=3$
and 10 mm case; (b) normalized circulation (
$b=3$
and 10 mm case; (b) normalized circulation (
 $\unicode[STIX]{x1D6E4}/\unicode[STIX]{x1D6E4}_{0}$
) for different combinations of
$\unicode[STIX]{x1D6E4}/\unicode[STIX]{x1D6E4}_{0}$
) for different combinations of
 $b$
and
$b$
and
 $\unicode[STIX]{x1D70C}_{h}$
plotted against
$\unicode[STIX]{x1D70C}_{h}$
plotted against
 $x/x_{0}$
.
$x/x_{0}$
.

Figure 13. Single shot experimental shadowgraph (a) and numerical density gradient (b) corresponding to
 $\unicode[STIX]{x1D6FC}=24^{\circ }$
case for
$\unicode[STIX]{x1D6FC}=24^{\circ }$
case for
 $b=1.5~\text{mm}$
depicting the vortex train structure.
$b=1.5~\text{mm}$
depicting the vortex train structure.

Figure 14. Sequence of high-speed experimental images at normalized time
 $t/t_{o}=0.13$
, 0.27, 0.41, 0.54, 0.68, 0.81 for
$t/t_{o}=0.13$
, 0.27, 0.41, 0.54, 0.68, 0.81 for
 $b=1.5~\text{mm}$
case.
$b=1.5~\text{mm}$
case.

Figure 15. Sequence of high-speed experimental images at normalized time
 $t/t_{o}=0.13$
, 0.26, 0.39, 0.52, 0.66, 0.79 for
$t/t_{o}=0.13$
, 0.26, 0.39, 0.52, 0.66, 0.79 for
 $b=10~\text{mm}$
case.
$b=10~\text{mm}$
case.

Figure 16. Density gradient (left) and vorticity magnitude (right) for
 $b=1.5~\text{mm}$
case. The times
$b=1.5~\text{mm}$
case. The times
 $t/t_{o}$
correspond to their respective high-speed experimental images in figure 14.
$t/t_{o}$
correspond to their respective high-speed experimental images in figure 14.

Figure 17. (a) Distance travelled by points A and B in the vortex train from their point of origin (
 $x_{origin}$
) and (b) their corresponding average velocity plotted against
$x_{origin}$
) and (b) their corresponding average velocity plotted against
 $t$
for
$t$
for
 $b=1.5~\text{mm}$
. Similar plots for
$b=1.5~\text{mm}$
. Similar plots for
 $b=10~\text{mm}$
is shown in (c,d).
$b=10~\text{mm}$
is shown in (c,d).

Figure 18. (a) Numerically computed positive (
 $\unicode[STIX]{x1D6E4}_{+}$
) and negative (
$\unicode[STIX]{x1D6E4}_{+}$
) and negative (
 $\unicode[STIX]{x1D6E4}_{-}$
) circulation for
$\unicode[STIX]{x1D6E4}_{-}$
) circulation for
 $\unicode[STIX]{x1D70C}_{h}=0.39$
and 0.5 plotted against
$\unicode[STIX]{x1D70C}_{h}=0.39$
and 0.5 plotted against
 $t/t_{0}$
; due to the symmetric nature of both
$t/t_{0}$
; due to the symmetric nature of both
 $\unicode[STIX]{x1D6E4}_{+}$
and
$\unicode[STIX]{x1D6E4}_{+}$
and
 $\unicode[STIX]{x1D6E4}_{-}$
, only one component is plotted to be consistent with the
$\unicode[STIX]{x1D6E4}_{-}$
, only one component is plotted to be consistent with the
 $\unicode[STIX]{x1D6FC}=0^{\circ }$
results. (b) Circulation (
$\unicode[STIX]{x1D6FC}=0^{\circ }$
results. (b) Circulation (
 $\unicode[STIX]{x1D6E4}$
) plotted against
$\unicode[STIX]{x1D6E4}$
) plotted against
 $x/x_{0}$
; normalized circulation (
$x/x_{0}$
; normalized circulation (
 $\unicode[STIX]{x1D6E4}/\unicode[STIX]{x1D6E4}_{0}$
) plotted against (c)
$\unicode[STIX]{x1D6E4}/\unicode[STIX]{x1D6E4}_{0}$
) plotted against (c)
 $t/t_{0}$
and (d)
$t/t_{0}$
and (d)
 $x/x_{0}$
respectively. Also included in (c,d) are the results from
$x/x_{0}$
respectively. Also included in (c,d) are the results from
 $\unicode[STIX]{x1D6FC}=0^{\circ }$
for comparison.
$\unicode[STIX]{x1D6FC}=0^{\circ }$
for comparison.
Table 1. Total circulation (
 $\unicode[STIX]{x1D6E4}_{o}$
) for different combinations of
$\unicode[STIX]{x1D6E4}_{o}$
) for different combinations of
 $b$
and
$b$
and
 $\unicode[STIX]{x1D70C}_{h}$
.
$\unicode[STIX]{x1D70C}_{h}$
.

The second part of the analysis is done for an inclined inhomogeneity with
 $\unicode[STIX]{x1D6FC}=24^{\circ }$
. The single shot and high-speed experimental shadowgraph images for
$\unicode[STIX]{x1D6FC}=24^{\circ }$
. The single shot and high-speed experimental shadowgraph images for
 $b=1.5~\text{mm}$
and 10 mm are as shown in figures 13–15. As with the straight case, the general structures observed here are also similar for both thicknesses. This indicates that the qualitative behaviour is dependant on the inclination angle and not on the thicknesses investigated in this paper. The corresponding numerical density gradient and vorticity magnitude with
$b=1.5~\text{mm}$
and 10 mm are as shown in figures 13–15. As with the straight case, the general structures observed here are also similar for both thicknesses. This indicates that the qualitative behaviour is dependant on the inclination angle and not on the thicknesses investigated in this paper. The corresponding numerical density gradient and vorticity magnitude with
 $\unicode[STIX]{x1D70C}_{h}=0.39$
for
$\unicode[STIX]{x1D70C}_{h}=0.39$
for
 $b=1.5~\text{mm}$
are as shown in figure 16. The first and foremost feature observed is the asymmetric flow field along the inclination axis. The transmitted shock rotates itself by
$b=1.5~\text{mm}$
are as shown in figure 16. The first and foremost feature observed is the asymmetric flow field along the inclination axis. The transmitted shock rotates itself by
 $\unicode[STIX]{x1D6FC}$
in the clockwise direction and propagates normal to the inclination axis, making it symmetric. However, this introduces an asymmetry to the precursor shock region about the inclination axis. The location of the quadruple point above the axis is far away from the interface, creating an elongated precursor region compared to the bottom. The incident shock is largely unaffected by the inclination as it is seen propagating along the same plane. So the quadruple points can be thought of as acting as a hinge, providing leverage for the transmitted shock rotation by varying the precursor shock length without hindering the incident shock path.
$\unicode[STIX]{x1D6FC}$
in the clockwise direction and propagates normal to the inclination axis, making it symmetric. However, this introduces an asymmetry to the precursor shock region about the inclination axis. The location of the quadruple point above the axis is far away from the interface, creating an elongated precursor region compared to the bottom. The incident shock is largely unaffected by the inclination as it is seen propagating along the same plane. So the quadruple points can be thought of as acting as a hinge, providing leverage for the transmitted shock rotation by varying the precursor shock length without hindering the incident shock path.
The most striking feature observed is the appearance of a train of vortices that is particularly distinct in figure 13. The vortices are similar in nature to the KHI. During shock passage through the inhomogeneity, the baroclinic mechanism deposits vorticity, initiating an external perturbation at the interface, as seen clearly in figures 14(b) and 15(b). Similar to
 $\unicode[STIX]{x1D6FC}=0^{\circ }$
, the sense of rotation of vorticity is clockwise (negative) on the bottom interface and counter-clockwise (positive) on the top interface. In addition, the vortices are also embedded in a high velocity region flowing normal to the incident shock which provides additional momentum and sweeps the vortices along its path. During this process, there are effectively two regions of different velocity i.e. the flow due the incident shock and the vortices interacting with each other at an angle. This velocity discontinuity due to the vorticity causes the amplitude of the initial perturbation to grow, resulting in the rolling-up phenomenon of the interface, as seen in figures 14(c–f) and 15(c–f). As the shock traverses the full length, a train of vortices is generated similar to the KHI. As time progresses, the rolled-up vortices continue to grow in size but eventually slow down.
$\unicode[STIX]{x1D6FC}=0^{\circ }$
, the sense of rotation of vorticity is clockwise (negative) on the bottom interface and counter-clockwise (positive) on the top interface. In addition, the vortices are also embedded in a high velocity region flowing normal to the incident shock which provides additional momentum and sweeps the vortices along its path. During this process, there are effectively two regions of different velocity i.e. the flow due the incident shock and the vortices interacting with each other at an angle. This velocity discontinuity due to the vorticity causes the amplitude of the initial perturbation to grow, resulting in the rolling-up phenomenon of the interface, as seen in figures 14(c–f) and 15(c–f). As the shock traverses the full length, a train of vortices is generated similar to the KHI. As time progresses, the rolled-up vortices continue to grow in size but eventually slow down.
Incidentally, the vortices are also translated normal to the incident shock and can be easily traced to their point of origin. In order to estimate their average translational velocity, two points in the train (marked A and B in figures 14
f and 15
f) are identified and its path is tracked from the series of images obtained from experiments. The distance travelled from its point of origin (
 $x_{origin}$
) is fitted against time in figure 17(a) while its corresponding velocity averaged every
$x_{origin}$
) is fitted against time in figure 17(a) while its corresponding velocity averaged every
 $10~\unicode[STIX]{x03BC}\text{s}$
is plotted in figure 17(b) for the
$10~\unicode[STIX]{x03BC}\text{s}$
is plotted in figure 17(b) for the
 $b=1.5~\text{mm}$
case. Similar plots for
$b=1.5~\text{mm}$
case. Similar plots for
 $b=10~\text{mm}$
are shown in figure 17(c,d). They are tracked as soon as they are discernible up until
$b=10~\text{mm}$
are shown in figure 17(c,d). They are tracked as soon as they are discernible up until
 $t_{o}$
. It can been seen that their path follows a quadratic function, consistent with a linear drop in velocity. This is attributed to the energy expenditure associated with the growth of the vortex that entrains more fluid from the surrounding flow. The velocity close to its point of origin (initial velocity) of the generated vortex is dependent on the transmitted shock strength, the source of baroclinicity. But the strength of the transmitted shock gradually reduces as it propagates through the inhomogeneity, resulting in a reduction of the initial velocity of the vortices generated at a later time. This is the reason behind the reduced initial velocity of B compared to A, after which the vortex velocity drops at a constant rate. Also this effectively means that each vortex along the train moves with a different velocity, with the lowest farther away, and the highest close to the transmitted shock. This results in a slight bending of the vortex train, as can be clearly seen in figures 14(f)–15(f).
$t_{o}$
. It can been seen that their path follows a quadratic function, consistent with a linear drop in velocity. This is attributed to the energy expenditure associated with the growth of the vortex that entrains more fluid from the surrounding flow. The velocity close to its point of origin (initial velocity) of the generated vortex is dependent on the transmitted shock strength, the source of baroclinicity. But the strength of the transmitted shock gradually reduces as it propagates through the inhomogeneity, resulting in a reduction of the initial velocity of the vortices generated at a later time. This is the reason behind the reduced initial velocity of B compared to A, after which the vortex velocity drops at a constant rate. Also this effectively means that each vortex along the train moves with a different velocity, with the lowest farther away, and the highest close to the transmitted shock. This results in a slight bending of the vortex train, as can be clearly seen in figures 14(f)–15(f).
The evolution of
 $\unicode[STIX]{x1D6E4}$
for
$\unicode[STIX]{x1D6E4}$
for
 $\unicode[STIX]{x1D70C}_{h}=0.39$
and 0.5 with respect to
$\unicode[STIX]{x1D70C}_{h}=0.39$
and 0.5 with respect to
 $t/t_{o}$
and
$t/t_{o}$
and
 $x/x_{o}$
is shown in figure 18(a,b). As expected,
$x/x_{o}$
is shown in figure 18(a,b). As expected,
 $(\unicode[STIX]{x1D6E4})_{\unicode[STIX]{x1D70C}_{h}=0.39}$
is larger than
$(\unicode[STIX]{x1D6E4})_{\unicode[STIX]{x1D70C}_{h}=0.39}$
is larger than
 $(\unicode[STIX]{x1D6E4})_{\unicode[STIX]{x1D70C}_{h}=0.5}$
at every point. Also, both the positive (
$(\unicode[STIX]{x1D6E4})_{\unicode[STIX]{x1D70C}_{h}=0.5}$
at every point. Also, both the positive (
 $\unicode[STIX]{x1D6E4}_{+}$
) and negative (
$\unicode[STIX]{x1D6E4}_{+}$
) and negative (
 $\unicode[STIX]{x1D6E4}_{-}$
) components of circulation, calculated by integrating only the counter-clockwise and clockwise vorticity respectively, are nearly equal, as can be seen in figure 18(a). Unlike the
$\unicode[STIX]{x1D6E4}_{-}$
) components of circulation, calculated by integrating only the counter-clockwise and clockwise vorticity respectively, are nearly equal, as can be seen in figure 18(a). Unlike the
 $\unicode[STIX]{x1D6FC}=0^{\circ }$
case, the variation follows a second-order function. This quadratic nature is influenced by two factors: the reduction in strength of the transmitted shock thereby generating vortices with reduced vorticity, coupled with the gradual loss of vorticity of the earlier-generated vortices. These effects are particularly amplified during the late stage of shock propagation, in this case after
$\unicode[STIX]{x1D6FC}=0^{\circ }$
case, the variation follows a second-order function. This quadratic nature is influenced by two factors: the reduction in strength of the transmitted shock thereby generating vortices with reduced vorticity, coupled with the gradual loss of vorticity of the earlier-generated vortices. These effects are particularly amplified during the late stage of shock propagation, in this case after
 $t/t_{o},x/x_{0}=0.7$
.
$t/t_{o},x/x_{0}=0.7$
.
 $\unicode[STIX]{x1D6E4}/\unicode[STIX]{x1D6E4}_{0}$
for different densities is plotted in figure 18(c,d). Also included is
$\unicode[STIX]{x1D6E4}/\unicode[STIX]{x1D6E4}_{0}$
for different densities is plotted in figure 18(c,d). Also included is
 $\unicode[STIX]{x1D6E4}/\unicode[STIX]{x1D6E4}_{0}$
from
$\unicode[STIX]{x1D6E4}/\unicode[STIX]{x1D6E4}_{0}$
from
 $\unicode[STIX]{x1D6FC}=0^{\circ }$
for comparison. The normalized circulation also follows a second-order function but is non-unique with the value at each corresponding point larger than that of
$\unicode[STIX]{x1D6FC}=0^{\circ }$
for comparison. The normalized circulation also follows a second-order function but is non-unique with the value at each corresponding point larger than that of
 $(\unicode[STIX]{x1D6E4}/\unicode[STIX]{x1D6E4}_{0})_{\unicode[STIX]{x1D6FC}=0^{\circ }}$
. It is interesting to note that
$(\unicode[STIX]{x1D6E4}/\unicode[STIX]{x1D6E4}_{0})_{\unicode[STIX]{x1D6FC}=0^{\circ }}$
. It is interesting to note that
 $(\unicode[STIX]{x1D6E4}/\unicode[STIX]{x1D6E4}_{o})_{\unicode[STIX]{x1D70C}_{h}=0.5}$
is slightly larger than
$(\unicode[STIX]{x1D6E4}/\unicode[STIX]{x1D6E4}_{o})_{\unicode[STIX]{x1D70C}_{h}=0.5}$
is slightly larger than
 $(\unicode[STIX]{x1D6E4}/\unicode[STIX]{x1D6E4}_{o})_{\unicode[STIX]{x1D70C}_{h}=0.39}$
despite the opposite trend in
$(\unicode[STIX]{x1D6E4}/\unicode[STIX]{x1D6E4}_{o})_{\unicode[STIX]{x1D70C}_{h}=0.39}$
despite the opposite trend in
 $\unicode[STIX]{x1D6E4}$
variation. This is due to either the lower than expected value of
$\unicode[STIX]{x1D6E4}$
variation. This is due to either the lower than expected value of
 $\unicode[STIX]{x1D6E4}_{0}$
for
$\unicode[STIX]{x1D6E4}_{0}$
for
 $\unicode[STIX]{x1D70C}_{h}=0.5$
, or higher than expected value for
$\unicode[STIX]{x1D70C}_{h}=0.5$
, or higher than expected value for
 $\unicode[STIX]{x1D70C}_{h}=0.39$
for the function to be unique. Therefore the normalized circulation is dependent on
$\unicode[STIX]{x1D70C}_{h}=0.39$
for the function to be unique. Therefore the normalized circulation is dependent on
 $\unicode[STIX]{x1D70C}_{h}$
and a universal fit equation is non-existent.
$\unicode[STIX]{x1D70C}_{h}$
and a universal fit equation is non-existent.
5 Summary
The results presented here describe the early time interaction of a plane blast wave with an elongated elliptic inhomogeneity, aligned both normal as well as at an angle to the incoming wave. The inhomogeneities were generated on the basis of ‘Joule heating’ by supplying current to a small conducting wire suspended between two electrodes. This technique provided freedom in the positioning of the electrodes, enabling production of inclined inhomogeneities. The study was performed for two cases:
 $\unicode[STIX]{x1D6FC}=0^{\circ }$
and
$\unicode[STIX]{x1D6FC}=0^{\circ }$
and
 $\unicode[STIX]{x1D6FC}=24^{\circ }$
with two
$\unicode[STIX]{x1D6FC}=24^{\circ }$
with two
 $b$
values. The structures observed in
$b$
values. The structures observed in
 $\unicode[STIX]{x1D6FC}=0^{\circ }$
were similar to those for a circular bubble, where two counter-rotating vortices were formed due to the RMI. The flow field was symmetric about the centre axis. Since this is an elongated inhomogeneity along the horizontal axis, the baroclinic vorticity deposited along each point at the interface leads to a much faster rolling up of the vortices compared to a circular bubble, enabling early time (time until the transmitted shock reached the downstream interface) study. The variation of the normalized width, length and circulation of the vortices with distance was found to be linear. Also, with the aid of numerical simulation, a unique linear fit equation for normalized circulation was given and it was found to be independent of the inhomogeneity density and thickness. For the inclined case, the transmitted shock was seen to adjust itself to travel normal to the inclined inhomogeneity with uneven precursor shock regions about the inclination axis. Unlike
$\unicode[STIX]{x1D6FC}=0^{\circ }$
were similar to those for a circular bubble, where two counter-rotating vortices were formed due to the RMI. The flow field was symmetric about the centre axis. Since this is an elongated inhomogeneity along the horizontal axis, the baroclinic vorticity deposited along each point at the interface leads to a much faster rolling up of the vortices compared to a circular bubble, enabling early time (time until the transmitted shock reached the downstream interface) study. The variation of the normalized width, length and circulation of the vortices with distance was found to be linear. Also, with the aid of numerical simulation, a unique linear fit equation for normalized circulation was given and it was found to be independent of the inhomogeneity density and thickness. For the inclined case, the transmitted shock was seen to adjust itself to travel normal to the inclined inhomogeneity with uneven precursor shock regions about the inclination axis. Unlike
 $\unicode[STIX]{x1D6FC}=0^{\circ }$
, a vortex train similar to the KHI was observed for the
$\unicode[STIX]{x1D6FC}=0^{\circ }$
, a vortex train similar to the KHI was observed for the
 $\unicode[STIX]{x1D6FC}=24^{\circ }$
case. The initial velocity of each individual vortex in the train is dependent on the strength of the transmitted wave and the train was observed to lose its velocity linearly with time as it grew in size. The normalized circulation at each location along
$\unicode[STIX]{x1D6FC}=24^{\circ }$
case. The initial velocity of each individual vortex in the train is dependent on the strength of the transmitted wave and the train was observed to lose its velocity linearly with time as it grew in size. The normalized circulation at each location along
 $x$
was found to be larger than that for the
$x$
was found to be larger than that for the
 $\unicode[STIX]{x1D6FC}=0^{\circ }$
case. Also, it follows a quadratic function influenced by two factors: the reduction in strength of the transmitted shock thereby generating vortices with reduced vorticity and the gradual loss of vorticity of the earlier-generated vortices.
$\unicode[STIX]{x1D6FC}=0^{\circ }$
case. Also, it follows a quadratic function influenced by two factors: the reduction in strength of the transmitted shock thereby generating vortices with reduced vorticity and the gradual loss of vorticity of the earlier-generated vortices.
Acknowledgement
The financial support of Vetenskapsrådet (The Swedish Research Council) is gratefully acknowledged.


