
1. Introduction
One of the major topics in biomolecular research is the mechanistic understanding of biological functions on a molecular level, which is commonly approached by studying reaction kinetics, structures, and structural dynamics. With respect to structure, X-ray diffraction allowed to solve the structure of biomolecular complexes like the plant photosystem II (PS II) (Loll et al. Reference Loll, Kern, Saenger, Zouni and Biesiadka2005), the transcription complex (Cramer et al. Reference Cramer, Bushnell and Kornberg2001; Gnatt et al. Reference Gnatt, Cramer, Fu, Bushnell and Kornberg2001), and the ribosome (Tocilj et al. Reference Tocilj, Schluenzen, Hansen, Bashan, Janell, Gluehmann, Bartels, Harms, Agmon, Franceschi and Yonath1999; Ban et al. Reference Ban, Nissen, Hansen, Moore and Steitz2000; Nissen et al. Reference Nissen, Hansen, Ban, Moore and Steitz2000; Yusupov et al. Reference Yusupov, Yusupova, Baucom, Lieberman, Earnest, Cate and Noller2001) with high resolution. However, the structures obtained are those of biosystems in the solid state of the crystal. In contrast, nuclear magnetic resonance (NMR) spectroscopy can be performed on biomolecules in liquid solution and additionally yields structural and dynamical information (Wüthrich, Reference Wüthrich1986; Ernst, Reference Ernst1992; Bonvin et al. Reference Bonvin, Boelens and Kaptein2005). Yet, high-resolution liquid-state NMR spectroscopy is currently restricted to biological systems with a size below ∼50 kDa. Thus, to be able to study structures, folding, and conformational changes of large biomolecules in solution, other biophysical spectroscopic methods are required, for example fluorescence (Lakowicz, Reference Lakowicz2006) and electron paramagnetic resonance (EPR) spectroscopy (Hoff, Reference Hoff1989; Schweiger & Jeschke, Reference Schweiger and Jeschke2001). Especially, fluorescence resonance energy transfer (FRET) and certain EPR-based experiments are suited to measure large distances in the nanometer range without restriction to the size of the biomolecule. Collecting several of these long-range constraints can yield global structure elements, information about domain arrangements, complex formation, and structural changes upon ligand binding. Combined with molecular dynamics (MD) simulations this approach is extremely valuable (Sale et al. Reference Sale, Faulon, Gray, Schoeniger and Young2004).
Continuous wave EPR methods were already applied to biological systems in the 1960s and 1970s (Berliner, Reference Berliner1976), but were mainly complicated by unspecific labeling methods and the inhomogeneous continuous wave EPR line widths, which limited measurements to distances below 20 Å. Three important advances raised these limits dramatically: (1) the invention of site-directed spin labeling (Altenbach et al. Reference Altenbach, Marti, Khorana and Hubbell1990; Berliner, Reference Berliner1998), (2) the technical development of EPR spectrometers at high fields/high frequencies (Bennati & Prisner, Reference Bennati and Prisner2005; Möbius et al. Reference Möbius, Savitsky, Schnegg, Plato and Fuchs2005), and (3) the methodological development of pulse sequences suitable for biological applications (Prisner et al. Reference Prisner, Rohrer and MacMillan2001; Calle et al. Reference Calle, Sreekanth, Fedin, Forrer, Garcia-Rubio, Gromov, Hinderberger, Kasumaj, Léger, Mancosu, Mitrikas, Santangelo, Stoll, Schweiger, Tschaggelar and Harmer2006). Consequently, EPR spectroscopy has become a growing field in biomolecular sciences.
Here, we first give a short overview of EPR methods suitable to measure long-range distances and then summarize examples of their application to biological systems. Pulsed EPR methods applied to spin-labeled biomacromolecules and complexes thereof are the main focus of this review. Other general reviews related to this area of research are Berliner et al. (Reference Berliner, Eaton and Eaton2000), Lakshmi & Brudvig (Reference Lakshmi and Brudvig2001) and Eaton & Eaton (Reference Eaton and Eaton2004). More specific reviews will be mentioned in the respective sections.
2. Methods and theory
2.1 Magnetic dipole–dipole interaction
Distance determination relies in all EPR methods on the magnetic dipole–dipole interaction between the magnetic moments  and of two spins A and B. Both spins can either be electron spins (dipolar spectroscopy) or one of them can be a nuclear spin (hyperfine spectroscopy). The former case is considered here. The interaction energy E between the two magnetic moments is given by
where R is the distance between A and B. This classical energy expression can be converted to a quantum mechanical spin Hamiltonian using the relation between the magnetic moment of the electron and the electron spin operator
where γe is the magnetogyric ratio of the electron and ħ is the Planck constant divided by 2π. This dipolar Hamiltonian H dip is usually written in the following way (Slichter, Reference Slichter1980)
with g defined as the g-value of radial A and B and βe as the Bohr magneton. The terms A–F represent products of spin operators and angular expressions in spherical coordinates θ, φ, and R describing the orientation of the molecule with respect to the external magnetic field:
If the dipolar coupling is small compared to the Zeeman splitting of the electron spin states and the g-values are only weakly anisotropic, the dipolar splitting of the EPR transitions is mainly determined by the secular term A. In this case, the dipolar frequency is given by
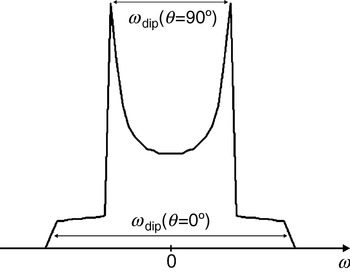
with the splitting constant D dip calculated to 2π×52 MHz/nm3, with g A=g B=2. As can be seen from Eq. (5), ωdip varies from −2D dip/R 3 to +1D dip/R 3 for a rotation of the dipolar axis R parallel (θ=0°) to perpendicular (θ=90°) with respect to the external magnetic field B 0. As can also be infered from Eq. (5), the average value of the dipolar interaction is zero for randomly orientated molecules and the dipolar interaction vanishes at the so-called magic angle (θ=54·7°). Therefore, the dipolar interaction is averaged to zero for molecules rotating fast compared to the inverse coupling strength. Differently, the spectra of slowly rotating molecules or of frozen samples are a superposition of spectra of the randomly oriented biradicals, each consisting of two lines splitted by the dipolar coupling. The resulting spectrum of such a sample of randomly oriented molecules is called Pake pattern (see Fig. 1). The edge-to-edge distance of the Pake pattern corresponds to the dipolar splitting for molecules with an angle of θ=0°; the peak-to-peak distance corresponds to the dipolar splitting for molecules with θ=90°. These two peaks are usually the most easily observeable features in spectra of such samples.

Fig. 1. Pake pattern with peaks at ±½ωdip and edges at ±ωdip corresponding to θ=90° and 0°, respectively. The splitting between the two peaks is ωdip(θ=90°) and the splitting between the two edges is ωdip(θ=0°)=2ωdip(θ=90°). In the case of pulsed EPR experiments like PELDOR, DQC, and ‘2+1’ the peaks appear at ±ωdip and the edges at ±2ωdip.
For distances shorter than 1 nm or in the case of conjugated bridges between the two radicals, also the exchange interaction J has to be taken into account. If this interaction is not orientation-dependent, it will only shift peak-to-peak and edge-to-edge distances by +2πJ. Given that the full Pake powder pattern can be observed with sufficient accuracy, both quantities R and J can be determined independently (Weber et al. Reference Weber, Schiemann, Bode and Prisner2002). For very short distances, where the splitting by dipolar and exchange coupling exceeds the difference in Larmor frequencies of spins A and B, the situation becomes more complicated.
Different EPR methods have been developed to reveal the dipolar interaction, depending on the spectral and dynamical properties of the paramagnetic centers, as well as the distance R between them. In the following sections, we will briefly describe these different methods, their application range, and limitations.
2.2 Continuous wave EPR
For paramagnetic centers with distances below 2 nm the dipolar splitting can be observed directly by continuous wave EPR spectroscopy (Hustedt et al. Reference Hustedt, Smirnov, Laub, Cobb and Beth1997, Reference Hustedt, Stein, Sethaphong, Brandon, Zhou and DeSensi2006), provided the intrinsic linewidth of at least one of the paramagnetic centers involved is smaller than the dipolar coupling. Therefore, it has been most successfully applied to organic radicals and half-integer spin transition metal ions.
Usually, the dipolar splitting is smaller than the intrinsic linewidth and leads only to a line broadening in biological samples. In these cases, deconvolution methods have to be used to disentangle the dipolar contribution to the linewidth from other contributions (Berliner et al. Reference Berliner, Eaton and Eaton2000). However, such methods require that the intrinsic linewidth of the paramagnetic center has to be measured without dipolar coupling under otherwise identical conditions, which is not always possible. In addition, from the continuous wave EPR spectrum itself it is impossible to distinguish static dipolar broadening from dipolar relaxation broadening (see Section 2.6) and at short distances, the exchange interaction might contribute to the splitting, which may both easily lead to wrong distances. Numerically, the deconvolution method is not very stable for spectra with unresolved dipolar peaks and needs high signal-to-noise ratios to avoid artifacts (see discussion in Section 2.3.1.3). Therefore, although the method has been shown to yield quantitative distances in the range of 1–2 nm, it is commonly applied in a more qualitative fashion for distance determination between close paramagnetic centers. The advantage of this method is its easy experimental accessibility and the possibility to measure at physiological temperatures.
2.3 Pulsed electron–electron dipolar spectroscopy
2.3.1 PELDOR
At low temperatures in disordered powder samples of paramagnetic centers with a spin of S=½, the linewidth is dominated by inhomogeneous broadening caused by unresolved hyperfine couplings to nearby nuclei and the anisotropy of the g tensor. In such cases, pulsed experiments, like the Hahn-echo sequence (see Fig. 2), can be performed to refocus all static inhomogeneous contributions and to recover the much narrower homogeneous linewidth, given by the transversal relaxation rate 1/T 2, thus tremendously increasing spectral resolution. This allows extension of the measurable distance R between two paramagnetic centers from 2 nm up to a limit, where the dipolar splitting becomes comparable to the homogeneous linewidth. A pulsed EPR method capable of recovering dipolar couplings is called pulsed electron–electron double resonance (PELDOR) (Milov et al. Reference Milov, Salikhov and Shchirov1981, Reference Milov, Ponomarev and Tsvetkov1984) or sometimes also named double electron–electron resonance (DEER) (Larsen & Singel, Reference Larsen and Sigel1993). The three-pulse version of PELDOR (see Fig. 2) is identical to Hahn's spin echo double resonance (SEDOR) sequence used to detect the coupling between two nuclear spins (Mehring & Weberruß, Reference Mehring and Weberruß2001). In PELDOR, a two-pulse Hahn echo sequence with a fixed pulse separation time τ is employed to selectively monitor the echo intensity V(T) of the paramagnetic species A of the A–B spin pair. An additional microwave pulse at time T and with a frequency resonant with spin B selectively flips this spin B. This stimulated spin-flip induces a sudden change in the Larmor frequency of spin A by ±ωdip, so that the A spins precess with this altered frequency in the transversal plane, which leads to a non-perfect refocusing of the A spins at the echo time 2τ. By variation of the time position T of the inversion pulse, the dephasing angle can be changed to induce a periodic modulation of the A-spin echo intensity:
where ωdip is the dipolar coupling frequency [see Eq. (5)] and V 0 is the echo intensity at T=0 (Milov et al. Reference Milov, Maryasov and Tsvetkov1998). The modulation depth is 200% (full inversion of the echo signal) in an ideal case, where spins A and B are spectrally well-separated and both are ideally excited by the detection and inversion pulses, respectively. In most biological applications, the paramagnetic species A and B are identical nitroxide radicals. Spins A and B are then defined by their spectral position in the EPR spectra. At X-band frequencies, the spectrum of a nitroxide radical is dominated by the strong anisotropic hyperfine coupling of the 14N nucleus with a nuclear spin of I=1. This leads to a three-line spectrum with a hyperfine splitting of about 100 MHz, if the molecular plane is perpendicular to the magnetic field (molecular z axis parallel to B 0) and is only 10 MHz for all magnetic field orientations in the plane (see Fig. 3). In a PELDOR experiment, the spins A and B are usually chosen as those with a resonance frequency corresponding to the low-field wing and to the center of the nitroxide spectrum, respectively (see Fig. 4 b). This choice defines the A spins as molecules in the nitrogen nuclear spin state m I=−1 and with the molecular z axis almost parallel to B 0, while the B spin ensemble consists of all molecules in the m I=0 state and molecules in the m I=±1 state with the molecular z axis perpendicular to B 0. The excitation bandwidths of inversion and detection pulses have to be chosen small enough to avoid spectral overlap. On the other hand, the excitation width of the inversion pulse should be as large as possible to achieve a deep modulation. The fraction of spins B excited by the inversion pulse is described by the modulation depth parameter λ:
If the two nitroxides in the biradical are flexible, the orientation between their molecular z axis z A and z B and the R vector will be almost randomly distributed. In such cases, the modulation depth parameter λ may be approximated to be independent of the orientation of the biradical with respect to the external magnetic field. Therefore, V(T) can be readily integrated over all orientations:

Under such conditions, the time domain signal is the sum of an inverse Fourier transform of a Pake pattern in frequency space and a constant offset with amplitude V 0(1−λ). Note that the splitting of the corresponding frequency spectrum is twice as large as in the original Pake pattern observed by continuous wave EPR experiments. The time domain signal is characterized by a fast initial decay and a fast damping of the dipolar oscillations due to interference of the θ-distributed oscillation frequencies from the Pake pattern (see Fig. 4 c) and an offset given by
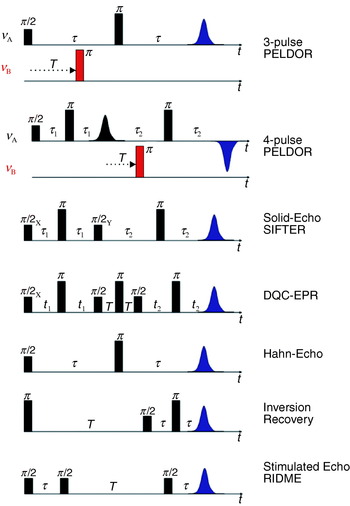
Fig. 2. Pulse sequences as discussed in the article.

Fig. 3. Nitroxide EPR spectra. (a) Axis system within a nitroxide. The g- and A-axes systems are considered to be collinear. (b) Typical field-sweep spectrum of a nitroxide in frozen solution, acquired at X-band (9·6 GHz). The spectrum is dominated by the large hyperfine splitting of A zz (red lines). The two other hyperfine splittings corresponding to A xx (blue lines) and A yy (green lines) are hidden under the inhomogeneous linewidth of the central peak. The g-anisotropy is not resolved. (c) The same nitroxide at G-band (180 GHz). This spectrum is dominated by the g-anisotropy of the nitroxide. g xx, g yy, and g zz are clearly separated. The hyperfine splitting of A zz can be seen on g zz, the hyperfine splittings on g xx and g yy are not resolved.

Fig. 4. PELDOR on a bisnitroxide model system. (a) Structure of a model biradical with an end-to-end distance of 34·7 Å and (b) its two-pulse Hahn-echo field swept spectrum. The portions of the spectrum excited by the detection and inversion pulses are depicted in green and red, respectively. (c) The four-pulse PELDOR time trace (black line) together with the fitted intermolecular background decay (red line). (d) Fourier transformation of the dipolar modulation time trace with peaks at 1·3 and 2·3 MHz, corresponding to θ⊥ and θ‖, respectively. From these frequencies a distance of 35·2 Å and an exchange coupling constant J of −0·1 MHz is calculated as outlined in Section 2.1 (e) Tikhonov regularization of the same time trace, reveals a mean distance of r=33·4 Å and a width at half height of ±0·5 Å. The Tikhonov regularization does not take the exchange coupling into account.
2.3.1.1 Multi-spin clusters
If N identical spins are coupled in a cluster, the total signal can be described as a sum of the products of individual two-spin interactions between spins K and J (Milov et al. Reference Milov, Ponomarev and Tsvetkov1984):
The echo amplitude V(T) levels for T→∞ at
Thus, the number of spins N in the cluster can be determined from the signal amplitude at large values of T, if the parameter λ is known independently from a structurally similar biradical system, as shown recently in a PELDOR study on a series of model systems (Bode et al. Reference Weber, Schiemann, Bode and Prisner2007).
The intermolecular dipolar interaction between the different spin clusters in the sample with an absolute spin concentration c introduces an additional exponential attenuation of the signal:
where V(T) is given by Eq. (10). The exponential decay due to intermolecular interactions has to be removed from V(T)total, before the distance R and the number of coupled spins N can be extracted. To reduce the intermolecular contribution, spin concentrations of c<200 μM should be used. Additionally, aggregation of molecules has to be avoided. To determine the intermolecular exponential decay, V(T) has to be fitted at long times T, where only this part contributes to the signal decay (see Fig. 4 c). All these constraints set a lower limit to the pulse separation time τ, which might be difficult to fulfill in biological samples with low signal-to-noise ratio and fast intrinsic relaxation time T 2 of the nitroxide radicals.
To solve Eq. (11) for N, it is important to record the signal V 0 at T=0. With the three-pulse sequence this is for most experimental setups impossible, because an overlap of the first detection pulse with the inversion pulse introduces experimental artifacts. A four-pulse sequence (see Fig. 2) overcomes this problem by refocusing the primary two-pulse Hahn-echo with an additional π-pulse of frequency νA. The primary Hahn-echo at time 2τ corresponds now to T=0 and dead-time free signals can be recorded by stepping the inversion pulse between the two π-pulses (Martin et al. Reference Martin, Pannier, Diederich, Gramlich, Hubrich and Spiess1998). The usage of phase cycling eliminates experimental amplitude offsets to the echo function V(T) and the Pake pattern is obtained free of experimental distortions allowing to accurately measure the distance R and the exchange coupling J (Pannier et al. Reference Pannier, Veit, Godt, Jeschke and Spiess2000).
2.3.1.2 Orientation selection
For rigid biradicals, where the relative orientations between the two radicals and to the connecting vector R are fixed, the extraction of distances and numbers of coupled spins is more demanding. Firstly, the orientation selection h(θ) of the excitation of spin A will lead to a non-random detection of dipolar angles θ and consequently to the observation of a distorted and incomplete Pake pattern. In this case the integration of the signal is more complex (Larsen & Sigel, Reference Larsen and Sigel1993):
![V\lpar T\hskip1\rpar \equals V_{\setnum{0}} \left( {1 \minus {\hskip-2}\int\nolimits_{\setnum{0}}^{\pi \sol \setnum{2}} {\left[ {\lambda \plus \lambda \cos \left( {{{D_{{\rm c}} } \over {R^{\setnum{3}} }}\lpar 1 \minus 3\cos ^{\setnum{2}} \theta \rpar \,T} \right)} \right]} \cdot h\lpar \theta \rpar \sin \theta \,d\theta } \right).](https://static.cambridge.org/binary/version/id/urn:cambridge.org:id:binary:20151023075125032-0937:S003358350700460X_eqn13.gif?pub-status=live)
Secondly, also the modulation depth parameter λ depends now on the angle θ. This orientation dependence of λ may lead to different signal intensities for large T. Thus, the observed dipolar frequency spectrum cannot be converted directly to a distance R, if the relative orientations are unknown. This is shown in Fig. 5, displaying simulated PELDOR time traces for two theoretical biradicals with rigid structures. In the first case, the molecular z axes of the two nitroxides are chosen parallel to each other and both are perpendicular to R. In the second case, the two molecular z axes are perpendicular to each other, one being parallel and the other perpendicular to R. In this example, different offsets for large values of T as well as different frequency components in the oscillations can be observed. To unravel orientational and distance information in such cases, the excitation and pump frequencies can be varied to excite and pump different sub-ensembles of the disordered biradical. This can be experimentally better achieved at higher microwave frequencies and high magnetic fields (see Section 2.7).
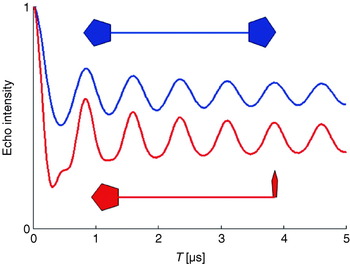
Fig. 5. Influence of different spin label orientations on the PELDOR time trace.
2.3.1.3 Data analysis
The maximum distance that can be extracted depends on the length of the recorded time trace due to Fourier arguments. It is limited by the intrinsic transversal relaxation properties of the A spin. For nitroxide radicals at 60 K it is typically in the order of a few microseconds, depending on the solvent. A maximum T of 3 μs corresponds to an oscillation frequency ωdip/2π of 300 kHz and a distance R of 5·5 nm. Longer distances are accessible with extended time windows or high signal-to-noise ratios. Extended time windows may be achieved with improved signal-to-noise ratio via a variable τ2 experiment (Jeschke et al. Reference Jeschke, Bender, Paulsen, Zimmermann and Godt2004a).
In cases where either more than two paramagnetic molecules with different distances are coupled or where large conformational distributions of R occur, more elaborate time domain fitting methods have to be used to accurately determine distance distributions and relative intensities. Tikhonov regularization can be performed to gain information of the distance distribution P(R) directly from the time domain trace (see Fig. 4 e). This is a very efficient numerical algorithm to gather consistent and stable results in ‘ill-defined’ problems, where small variations in the experimental data may lead to rather different solutions of the desired function. For orientationally uncorrelated radicals, the oscillatory part of the signal V(T) can be written as (Jeschke et al. Reference Jeschke, Panek, Godt, Bender and Paulsen2004b; Chiang et al. Reference Chiang, Borbat and Freed2005a):
with x=cos θ. Assuming a smooth distribution P(R), this method can be used to simulate time traces and to extract the distance distribution function P(R) far better than by direct Fourier transform and visual inspection of the resulting Pake pattern. The additional constraint of R>0 can be incorporated via a consecutive maximum entropy regularization (Chiang et al. Reference Chiang, Borbat and Freed2005b).
Orientational selection and correlation hampers the simulation of the time domain data as the selection of A and B spins depends not only on the experimental pulse lengths, field strengths, and frequencies, but also on the relative orientations of the two nitroxides with respect to each other and with respect to the R vector. In principle, Tikhonov regularization may still be applied, but the integral kernel function κ(R, T) is complicated to formulate. If the simple integral kernel function presented above is used in such cases to extract P(R), artificial peaks may occur which compensate the encoded orientational correlations. Therefore, like for all ‘ill-defined’ problems, careful processing of the experimental data is mandatory to avoid artifacts and over-interpretation. This is especially valid for time traces with a low signal-to-noise ratio, without any visible dipolar oscillations, with modulations due to hyperfine couplings, with a short T time window or with fast intermolecular relaxation. Data should then be treated with care and rather conservatively. This description for the analysis of the data holds for all time domain dipolar methods described in this review. Computer programs for distance extractions from PELDOR time traces are available on the websites of G. Jeschke and J. H. Freed.
2.3.2 The ‘2+1’ pulse sequence
The two-frequency PELDOR method is, from an experimental point of view, more demanding than the earlier introduced single-frequency version called ‘2+1’ (Kurshev et al. Reference Kurshev, Raitsimring and Tsvetkov1988). Firstly, two different microwave sources have to be used and secondly the quality factor Q of the microwave resonant circuit has to be lowered to achieve the necessary bandwidth to support both frequencies. Nevertheless, PELDOR has been more successfully employed to determine distances between spin pairs. One of the reasons is that the additional degree of freedom with two independent microwave frequencies allows to adjust the experiment better for optimum spectral pump and detection positions. Additionally, the ‘2+1’ method does not work well for strong pumping efficiencies due to strong interference of pump and probe spins. The major disadvantage of the single frequency ‘2+1’ method is that the desired dipolar oscillation may be obscured by hyperfine modulation artifacts. These artifacts are strongly reduced in the two-frequency PELDOR experiment, where the two microwave sources are not phase coherent to each other (Raitsimring et al. Reference Raitsimring, Crepeau and Freed1995).
Even in the two-frequency PELDOR experiment, the dipolar modulation may be blotted by hyperfine artifacts, especially if the dipolar modulation is weak. However, hyperfine frequencies can be distinguished from electron–electron dipolar couplings by performing PELDOR experiments at different magnetic field strengths (Weber et al. Reference Weber, Schiemann, Bode and Prisner2002). The hyperfine frequencies shift upon changing the external magnetic field, whereas the dipolar interaction frequencies remain the same. Hyperfine modulations are also suppressed in the four-pulse sequence by either adjusting τ to minima for specific hyperfine frequencies (blind spots) or by averaging PELDOR time traces recorded with different τ1 values so that the hyperfine modulations diminish due to phase interference (Jeschke et al. Reference Jeschke, Panek, Godt, Bender and Paulsen2004b).
2.3.3 Solid-echo experiment
Another way to observe the dipolar coupling is the solid echo-pulse sequence ((π/2)x−τ−(π/2)y−τ-echo) known from NMR spectroscopy (Mehring & Weberruß, Reference Mehring and Weberruß2001). To achieve a sufficient refocusing in EPR, with broad lines and off-resonant spins, two additional π pulses have been symmetrically inserted into the two evolution time segments (see Fig. 2) in the SIFTER (single-frequency techniques for refocusing) pulse sequence (Jeschke et al. Reference Jeschke, Pannier, Godt and Spiess2000). For τ1=τ2, the dipolar coupling is fully refocused and for τ1≠τ2, the intensity of the echo signal V(τ2−τ1) reflects the dipolar coupling. Ideally, this experiment requires that the whole EPR line is excited. Therefore, it suffers, as any multi-pulse sequence in EPR, from non-ideal excitations, which partially allow unwanted coherence pathways to contribute to the observed signal. A spin-alignment sequence, as the Jeener–Broekaert echo sequence in NMR (Mehring & Weberruß, Reference Mehring and Weberruß2001), can be used to minimize some of these unwanted signal contributions, but it strongly reduces the echo intensity and is less efficient than the double quantum filter explained below.
2.4 Double-quantum coherence EPR
An elegant way to solely detect the dipolar electron–electron coupling in a time-domain experiment is by introducing a double-quantum coherence filter into the pulse sequence, similar to multiple-quantum NMR experiments (Ernst et al. Reference Ernst, Bodenhausen and Wokaun1990). In contrast to liquid-state NMR, this experiment is extremely challenging in EPR, because of the large spectral width of the nitroxide spin labels, which have to be fully excited for an optimum performance. Such an experiment has, nevertheless, been successfully carried out by the group of Freed with a home-built pulsed K-band (17 GHz) EPR spectrometer, which exhibits very strong B1 fields and a short dead time. They used an optimized six-pulse sequence (see Fig. 2) together with appropriate phase cycling to suppress all unwanted coherence pathways (Borbat & Freed, Reference Borbat and Freed1999). The sequence consists of three echo sandwiches: in the first and third segment single quantum coherence evolves under the dipolar coupling Hamiltonian. The second echo sandwich serves together with the appropriate phase cycle as a double-quantum filter in the coherence pathway of the observable signal V(t 2−t 1) and suppresses all contributions not related to dipolar coupled spin pairs. The intermolecular interaction to other electron spins and spectral diffusion can be removed from the time trace by inspection of the signal decay for large time offsets from the refocusing position (t 1=t 2), similar to the PELDOR experiment. The interference with electron-nuclear modulation effects is strongly reduced and shifted to frequencies larger than the dipolar frequencies at higher magnetic field values. The chosen K-band frequency might already be the optimum for nitroxide radicals, since the full excitation of the whole spin system becomes increasingly difficult at higher fields due to the larger spectral widths.
Different from the PELDOR experiment, a full excitation of both radicals has to be achieved for optimal performance, which leads in principle to a larger signal intensity and a bigger modulation depth than PELDOR. Yet, the sample size has to be restricted to the center part of the resonator to perform the experiment with maximum and homogeneous microwave field strength. Additionally, the maximum achievable B 1 field strength is still not large enough to obtain optimized coherence transfer efficiencies. Therefore, the signal quality of double-quantum coherence (DQC) experiments is at the moment just similar to PELDOR experiments, even under best experimental conditions (Freed, Reference Freed2000) and has been applied convincingly only by the Freed group.
The direct generation of double-quantum coherences is not efficient in the case of weaker microwave pulses as obtainable by commercial instruments. In such cases it is possible to excite double-quantum coherences by forbidden transitions (Saxena & Freed, Reference Saxena and Freed1996), but hyperfine modulation artifacts will be very difficult to suppress. They are diminished to a certain extent by variation of the observation window (Bonora et al. Reference Bonora, Becker and Saxena2004), but this leads to additional loss in the signal-to-noise ratio.
In contrast to the PELDOR experiment, DQC-EPR does not suffer from orientational selection or orientation-dependent inversion efficiency. If angular correlations between the two coupled spins exist, a 2D version of the experiment (Freed, Reference Freed2000) would allow to disentangle orientation from distance information. Furthermore, DQC-EPR might also be applicable to distances shorter than 15 Å (Freed, Reference Freed2000).
2.5 Photo-excited radical pairs
A special situation exists for radical pairs created by fast charge separation after photo-excitation out of a singlet ground state. In this case the radical pair is generated with a high non-Boltzmann population. Only |αβ〉 and |βα〉 states are created as longitudinal two-spin order with an initial zero-quantum coherence between these two states (Salikhov et al. Reference Salikhov, Bock and Stehlik1990; Zwanenburg & Hore, Reference Zwanenburg and Hore1993). Under these special preparation conditions, the dipolar coupling between the two spins can be detected with a variety of rather unique experiments described in the following sections.
2.5.1 Zero-quantum coherence beat experiment
The zero-quantum coherence, created by the fast radical pair generation, can be monitored directly by fast time-resolved EPR. The oscillation frequency is governed by the balance between the Larmor frequency difference between the two spins and their dipolar and exchange coupling. Therefore, this quantum-beat experiment allows to obtain the dipolar coupling strength and the distance between the radicals within the radical pair (Salikhov et al. Reference Salikhov, Bock and Stehlik1990; Bittl & Kothe, Reference Bittl and Kothe1991).
2.5.2 Transient EPR
Even after the attenuation of these short-lived, coherent zero-quantum oscillations (typically 100–1000 ns), the spin system is far from Boltzmann equilibrium. This leads to strong superimposed absorptive and emissive transitions to the |αα〉 and |ββ〉 states, respectively, which can be measured by transient time-resolved EPR spectroscopy. The spectra of these two signals would cancel each other exactly if they were not shifted with respect to each other by the dipolar and exchange coupling frequencies. The highly structured spectrum with emissive and absorptive components is very sensitive to the dipolar coupling strength and the relative orientation of the R vector with respect to the molecular axes systems of the two paramagnetic centers. The relative orientation between the two radicals can be obtained at high magnetic fields, where the spectrum is dominated by the anisotropic g tensor (Stehlik & Möbius, Reference Stehlik and Möbius1997).
2.5.3 Out-of-phase echo
In principle, a simple two-pulse Hahn-echo decay, recorded as a function of τ, is already modulated by the dipolar coupling if both spins are efficiently excited by the microwave pulses. Usually this can hardly be observed in a direct manner, because other effects such as transversal relaxation and hyperfine modulation dominate the signal V(τ). The situation differs for photo-excited radical pairs. The spin alignment of the two spins after photo-excitation leads to a peculiar echo signal that can only be observed for a non-zero dipolar coupling and with a 90° phase shift with respect to the usual Hahn-echo signal (Timmel et al. Reference Timmel, Fursman, Hoff and Hore1998). This unusual echo signal is modulated by the dipolar coupling, which can be directly observed as a function of the pulse separation time τ (Dzuba et al. Reference Dzuba, Gast and Hoff1995).
2.6 Relaxation methods
All pulsed-EPR methods described so far rely on an inversion pulse efficiently flipping the B spin and a longitudinal relaxation time T 1 of the B spins that is larger than the observation time T. For metal centers, both conditions can, in most cases, not satisfactorily be fulfilled. Nevertheless, if the B spin relaxes much faster than the A spin, then the B spin flips during the observation time window, even without inversion pulse, due to its short intrinsic longitudinal relaxation time T 1B. Because of the statistical nature of these spin flips, the effect of the dipolar coupling will not bear any coherent oscillations, but only add an additional monotonous attenuation to the signal decay of spin A. If the longitudinal relaxation process of spin B is not correlated with the intrinsic relaxation mechanism of the A spin, the attenuation of the A spin signal will be a product of this intrinsic relaxation and the dipolar relaxation due to the interaction with spin B. If the intrinsic relaxation properties of spin A are known independently, the dipolar relaxation contribution can be separated. Depending on the value of the longitudinal relaxation time T 1B the dipolar relaxation will effect either the transversal or longitudinal relaxation properties of spin A.
2.6.1 Transverse dipolar relaxation
If the longitudinal relaxation rate 1/T 1B of spin B is in the order of the dipolar splitting frequency ωdip, the dipolar relaxation will mostly effect the transversal relaxation of spin A.
The transversal dipolar relaxation enhancement can be determined by monitoring the decay of a two-pulse Hahn-echo as a function of 2τ. The decay of the echo amplitude V(2τ) is then T A2,dip as described by Zhidomirov & Salikhov (Reference Zhidomirov and Salikhov1969) and Salikhov et al. (Reference Salikhov, Semenov and Tsvetkov1976, Reference Salikhov, Dzuba and Raitsimring1981):
For the two cases 1/T 1B≪ωdip and 1/T 1B≫ωdip the following approximate solutions can be derived:
and
Equations (16)–(18) show that the dipolar relaxation enhancement is maximal for 1/T B1=ωdip. Because the relaxation time T B1 depends on the temperature, a temperature-dependent measurement of the transversal relaxation of spin A can be used to optimize the dipolar relaxation effect and to extract the dipolar coupling strength from the relaxation enhancement.
2.6.2 Longitudinal dipolar relaxation
If the longitudinal relaxation rate 1/T B1 of spin B is in the order of the larmor frequency ωA of spin A, the dipolar relaxation will predominately effect the longitudinal relaxation of spin A. A pulse sequence commonly used to measure the longitudinal relaxation is the inversion recovery sequence (see Fig. 2). The intrinsic longitudinal relaxation properties of the A spin have to be known to extract the dipolar relaxation enhancement. This dipolar relaxation enhancement on the longitudinal relaxation rate 1/T 1A is given by Kulikov & Likhtenstein (Reference Kulikov and Likhtenstein1977) and Rakowsky et al. (Reference Rakowsky, More, Kulikov, Eaton and Eaton1995) :
![\left.\openup2\eqalign{ {1 \over {T_{\setnum{1}{\rm A}}^{{\rm dip}} }} \equals \tab {8 \over 3} \cdot {{T_{\setnum{2}{\rm B}} } \over {1 \plus \lpar {\omega _{\rm A} \minus \omega _{\rm B} } \rpar^{\setnum{2}} T_{\setnum{2}{\rm B}}^{\setnum{2}} }} \cdot \left[ {{{\gamma _{\rm A} \mu _{\rm B} } \over {4R^{\setnum{3}} }}\lpar {1 \minus 3 {\hskip1}\cos ^{\setnum{2}} \theta } \rpar} \right]^{\setnum{2}} \cr \tab \plus {3 \over 2} \cdot {{T_{\setnum{2}{\rm A}} } \over {1 \plus \lpar {\omega _{\rm A} \plus \omega _{\rm B} } \rpar^{\setnum{2}} T_{\setnum{2}{\rm B}}^{\setnum{2}} }} \cdot \left[ {{{\gamma _{\rm A} \mu _{\rm B} } \over {R^{\setnum{3}} }}\lpar {\sin ^{\setnum{2}} \theta } \rpar} \right]^{\setnum{2}} \cr \tab \plus {{3T_{\setnum{1}{\rm B}} } \over {1 \plus \omega _{\rm A} ^{\setnum{2}} T_{\setnum{1}{\rm B}}^{\setnum{2}} }}\left[ {{{\gamma _{\rm A} \mu _{\rm B} } \over {R^{\setnum{3}} }}\sin \theta \,\cos \theta } \right]^{\setnum{2}} \comma \cr}\right\}](https://static.cambridge.org/binary/version/id/urn:cambridge.org:id:binary:20151023075125032-0937:S003358350700460X_eqn19.gif?pub-status=live)
where ωA and ωB are the resonance frequencies of spins A and B, respectively.
The disadvantage of relaxation methods is that the dipolar effect only leads to an additional exponential decay of the signal and not to a coherent oscillation, because of the statistic nature of the spin-flip processes. Separation of this contribution from intrinsic relaxation mechanisms is not trivial. Furthermore, distance and orientation information are both encoded in this monotonous decaying time trace. Therefore, orientation-selective and temperature-dependent measurements are important to disentangle the information and to obtain quantitative results (Hirsh et al. Reference Hirsh, Beck, Innes and Brudvig1992).
2.6.3 RIDME
A stimulated echo sequence (see Fig. 2) can also be used to measure the dipolar coupling between the spins. In contrast to the relaxation methods described above, this method, called relaxation induced dipolar modulation enhancement (RIDME) (Kulik et al. Reference Kulik, Dzuba, Grigoryev and Tsvetkov2001), yields a time trace in which the dipolar coupling manifests itself as an oscillation, similar to the PELDOR experiment. The first two π/2 pulses of a stimulated echo sequence create a periodic modulation of the M z magnetization as a function of the Larmor frequency with a periodicity given by 1/τ. The third π/2 pulse applied after a time T converts this grating into transversal magnetization which leads to an echo-like free induction signal, with a maximum at a time τ after this pulse. The amplitude of this signal is proportional to the amount of grating left at the time of the third pulse (Mims, Reference Mims and Geschwind1972). The M z modulation can be destroyed by longitudinal relaxation processes or by spectral diffusion. Larmor frequency jumps of the spin A induced by spin flips of the fast relaxing B spin belong to this second category (Salikhov et al. Reference Salikhov, Dzuba and Raitsimring1981). The attenuation of the stimulated echo intensity is strongest if a spin A jumps from a maximum of the grating to a minimum, corresponding to the condition ωdip=(2k+1)π/τ with k=0, 1, 2, 3, …, ∞. Therefore, a measurement of the echo signal intensity V(τ) will exhibit a periodic oscillation with ωdip, assuming that the pulse separation time T is chosen long enough to allow an efficient flipping of the spin B due to longitudinal relaxation. Unfortunately, hyperfine modulation and transversal relaxation will obscure the effect, as in a two-pulse echo sequence. Therefore, this experiment is best performed at high magnetic field values, where hyperfine modulations are strongly reduced (Kulik et al. Reference Kulik, Pachenko and Dzuba2002).
2.7 High-field EPR
At high magnetic field values, the microwave resonance frequency (Larmor frequency ωL) is given by
with
where θ and φ are the polar angles of the magnetic field direction within the axis system of the molecular g tensor. This Zeeman interaction dominates at large values of the magnetic field and allows to resolve the principal g-matrix elements (g x, g y, g z) of the paramagnetic center, because most other interactions, e.g. hyperfine or dipolar coupling constants, are not field-dependent (see Fig. 3). Deviations of the principal g values from the free electron g e value (2·0023) arise from residual orbital momentum of the unpaired electron. They can be used as a simple fingerprint to identify the radical species or in comparison with quantum chemical calculations to investigate hydrogen bonds, ligand geometry, and the electrostatic surrounding of the paramagnetic center in a biological system.
If the g tensor is anisotropic, molecules with different orientations with respect to the external magnetic field will have different resonance field values. Thus, it is possible to experimentally select in disordered samples molecules with a specific orientation to B 0 by means of the microwave frequency or the external field value. This so-called orientation selection enables to measure the anisotropy of other interactions with respect to the g tensor axis system. The method is of particular interest for the measurement of anisotropic hyperfine interactions by electron nuclear double resonance (ENDOR) or of dipolar interactions by PELDOR or RIDME to obtain the relative orientations of the coupled nuclei or paramagnetic center within the g tensor axis system. With respect to PELDOR, this was shown on dipolarly coupled spin systems with fixed geometry, as described above (Bennati & Prisner, Reference Bennati and Prisner2005; Denysenkov et al. Reference Denysenkov, Prisner, Stubbe and Bennati2006) and recently also for a more flexible system (Polyhach et al. Reference Polyhach, Godt, Bauer and Jeschke2007).
Unfortunately, the increased spectral resolution is also a disadvantage for pulsed-EPR experiments. The extended spectral width leads to a smaller number of detected spins A and inverted spins B in a PELDOR experiment, resulting in smaller signal intensity and a shallow modulation depth. Furthermore, not all spectrally possible combinations of excitation and detection frequencies can be chosen because of experimental restrictions with respect to the resonator bandwidth. Therefore, high sensitivity and stability of the spectrometer are crucial to perform high-field (HF) PELDOR experiments. Experiments relying on dipolar relaxation are not limited by this reduced pumping efficiency at higher fields and may thus gain more importance for the investigation of dipolarly coupled spin systems (Kulik et al. Reference Kulik, Pachenko and Dzuba2002).
The circumstances are different for half-integer high-spin systems, as for example Mn2+. The central transition from m S=−½ to m S=+½ is actually narrower as compared to lower field, due to a reduced linewidth contribution from zero-field splitting. In such cases, an increased cw-HF-EPR sensitivity towards dipolar couplings arises (Käss et al. Reference Käss, Stürzel, Ludwig, Dinse and Prisner1998) and higher pumping efficiencies are obtained. Additionally, the spectral overlap between signals from paramagnetic centers is reduced, e.g. between a nitroxide and a manganese(II) ion, enabling superior experimental conditions for a PELDOR experiment. As soon as the technical conditions of such HF-EPR spectrometers are further improved with respect to microwave field strength, stability and resonator bandwidth (Prisner, Reference Prisner1997), these experiments will become even more important for orientationally correlated radicals, as found for natural cofactors in proteins.
3. Model systems
In order to investigate the application range and limitations of an EPR pulse sequence capable of measuring longe-range electron–electron distances, a large library of bisnitroxide model systems has been synthesized and especially used for PELDOR. Singel and Larsen were the first to demonstrate the applicability of three-pulse ELDOR for measuring fixed distances (Larsen & Singel, Reference Larsen and Sigel1993) using an anthracene molecule connecting two nitroxides (see Fig. 6). The four-pulse ELDOR sequence was tested first on a series of rigid rod-like bisnitroxides covering a distance range from 14 to 28 Å (Martin et al. Reference Martin, Pannier, Diederich, Gramlich, Hubrich and Spiess1998; Pannier et al. Reference Pannier, Veit, Godt, Jeschke and Spiess2000). This collection of model systems has been extended to spin–spin distances of 51 Å (Godt et al. Reference Godt, Franzen, Veit, Enkelmann, Pannier and Jeschke2000) and later to 75 Å (Jeschke et al. Reference Jeschke, Bender, Paulsen, Zimmermann and Godt2004a) utilizing a combination of aryl and ethynyl groups as spacers (see Fig. 7). Similar model systems have also been used for SIFTER (Jeschke et al. Reference Jeschke, Pannier, Godt and Spiess2000) and DQC-EPR (Borbat & Freed, Reference Borbat, Freed, Berliner, Eaton and Eaton2000) distance measurements. In a recent paper, the dynamics of these molecular nano-rods were studied by PELDOR and MD simulations (Godt et al. Reference Godt, Schulte, Zimmermann and Jeschke2006), proving that PELDOR can yield distance distributions, which translate into dynamics at room temperature. The applicability to more flexible systems remains to be investigated, but first examples of two nitroxides linked via alkyl chains of different length are published (Pfannebecker et al. Reference Pfannebecker, Klos, Hubrich, Volkmer, Heuer, Wiesner and Spiess1996; Jeschke et al. Reference Jeschke, Koch, Jonas and Godt2002; Jeschke & Schlick, Reference Jeschke and Schlick2006). Bisnitroxides with bridges with or without conjugated bonds have been synthesized to demonstrate the separation of exchange coupling J from ωdip (Weber et al. Reference Weber, Schiemann, Bode and Prisner2002).
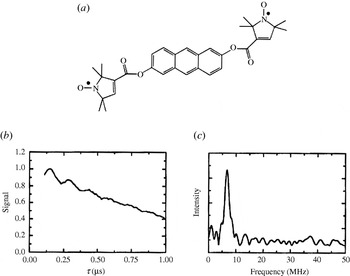
Fig. 6. First observation of dipolar modulations in PELDOR. (a) Structure of the model system 2,6-bis[(((2,2,5,5-tetramethyl-1-oxypyrrolin-3-yl)carbonyl)oxy)]-anthracene (r=19·6 Å) and (b) its 3-Pulse ELDOR time trace (77 K). (c) Modulus Fourier transformation of the time trace with a peak at 6·8 MHz, corresponding to a distance of 19·7 Å (Larsen & Singel, Reference Larsen and Sigel1993).

Fig. 7. A shape-persistent biradical with the longest inter-spin distance measured by PELDOR. (a) Structure of the biradical. (b) Time trace of the biradical in perdeuterated glassy o-terphenyl using variable time four-pulse ELDOR (top) and four-pulse ELDOR (bottom). The dashed lines are fits. (c) Fourier transformation, and (d) Tikhonov regularization of the time trace. Tikhonov regularization yielded a mean distance of 74·9 Å and a width at half-height of about 8 Å (Jeschke et al. Reference Jeschke, Bender, Paulsen, Zimmermann and Godt2004a).
A rigid imidazoline bridged biradical with an end-to-end distance of 20 Å and a bisnitroxide with 2,6-bisthiophene-cyclohexanone as a more flexible linker have been employed for studying RIDME (Kulik et al. Reference Kulik, Dzuba, Grigoryev and Tsvetkov2001) and DQC-EPR with small B1 field strength and suppression of hyperfine artifacts (Bonora et al. Reference Bonora, Becker and Saxena2004), respectively. In another work, two nitroxides were coupled to a Cu2+-complex, but the compound was not isolated (Narr et al. Reference Narr, Godt and Jeschke2002). For PELDOR distance measurements on nonbiological materials, we refer the reader to Jeschke et al. (Reference Jeschke, Koch, Jonas and Godt2002). Thus, not only rigid bisnitroxide model systems spanning distances from 14 to 75 Å, but also such with different degrees of flexibility are available. Regarding multiple spin systems, Godt et al. described the synthesis of one triradical (Godt et al. Reference Weber, Schiemann, Bode and Prisner2000) and Bode et al. published recently the a series of bi-, tri- and tetra radicals with different distances and geometries and showed on these that spin counting is possible for pure multi-spin systems but becomes complicated for mixtures (Bode et al. Reference Weber, Schiemann, Bode and Prisner2007). Also PELDOR measurements on 15N-, 2H-isotope labeled biradicals as test systems for distance assignments in multi-spin systems are described (Jeschke et al. Reference Jeschke, Zimmermann and Godt2006).
Concluding this chapter, it should be mentioned that all model systems have been examined in organic solvents, e.g. toluene or perdeuterated ortho-terphenyl, which leads to slow transversal relaxation times, enabling long observation time windows and thus the observation of large distances. To ensure that biomolecules adopt their biologically relevant structure, aqueous buffer solutions and maybe even membranes are to be favored over organic solvents. However, freezing an aqueous buffer solution does not lead to a random distribution of biomolecules, but rather to clustering and therefore to short intermolecular electron–electron distances. These close distances induce faster relaxation times and accordingly shorter observation time windows for PELDOR, ‘2+1’ and DQC-EPR and increase the continuous wave EPR linewidths. In each case the accessible distance range is reduced. Cryoprotectants like glycerol or ethylene glycol can be added to avoid this limitation. Furthermore, deuterated buffers can be used to minimize transversal relaxation enhancement due to H2O–nitroxide interactions.
4. Biological applications
EPR-based nanometer distance measurements are mainly applied to biological systems to study the arrangement of cofactors and subunits, the formation of secondary structure elements, or the interactions between biomolecules. In order to use EPR spectroscopic methods, the biomolecule has to contain either stable or transient paramagnetic centers, which can be metal ions or clusters, amino acid radicals, or organic cofactor radicals. If the biomolecule is diamagnetic, it can be spin-labeled with nitroxides or a diamagnetic metal may be substituted for a paramagnetic one.
In this section, we first give an overview of spin labeling and distance measurements in peptides and proteins, followed by studies related to arrangements of cofactors in proteins. Afterwards, we summarize spin labeling methods and distance measurements on RNA/DNA. Distance measurements involving metal centers or more than two spin centers are discussed separately at the end of this section.
4.1 Spin-labeled peptides and proteins
4.1.1 Spin labeling of peptides and proteins
Combining EPR spectroscopy with site-directed spin labeling was one of the major breakthroughs in biomolecular EPR spectroscopy (Berliner et al. Reference Berliner, Grunwald, Hankovszky and Hideg1982; Altenbach et al. Reference Altenbach, Marti, Khorana and Hubbell1990) and is reviewed in several monographs and articles (Berliner & Reuben, Reference Berliner and Reuben1989; Likhtenshtein, Reference Likhtenshtein1993; Berliner, Reference Berliner1998; Hubbell et al. Reference Hubbell, Gross, Langen and Lietzow1998; Berliner et al. Reference Berliner, Eaton and Eaton2000). The most commonly used spin label for site-directed labeling of proteins is a methanethiosulfonate-functionalized nitroxide called MTSSL, which reacts selectively with the thiol group of cysteines, forming a disulfide bridge. The label site can be selected and varied by site-directed mutagenesis, provided the structure and function of the protein are not disturbed. A slight drawback of the MTSSL label is the labile disulfide bridge connecting the nitroxide to the protein, because this bond might be cleaved under reducing conditions at room temperature. However, kept at 77 K, MTSSL-labeled proteins are stable over long periods of time. More stable linkers are formed by iodoacetamide- or maleimide-functionalized labels (Likhtenshtein, Reference Likhtenshtein1993), but the maleimide labels are less selective. Peptides, accessible via solid-state peptide synthesis, can also be labeled with the rigid synthetic amino acid 2,2,6,6-tetramethylpiperidine-1-oxyl-4-amino-4-carboxylic acid (TOAC), which mimics the microbial amino acid α-aminoisobutyric acid (Aib) (Rassat & Rey, Reference Rassat and Rey1967; Marchetto et al. Reference Marchetto, Schreier and Nakaie1993).
4.1.2 Distance measurements on spin-labeled peptides
To gain insight into secondary structure elements of peptides, exploitation of the isotropic exchange coupling constant J between two spin labels was attempted (McNulty & Millhauser, Reference McNulty, Millhauser, Berliner, Eaton and Eaton2000). The advantage of using the exchange coupling J as a measure for the distance R would be that it leads to a line splitting for liquid samples and biosystems with fast rotational correlation times. Indeed, continuous wave EPR spectra of a series of small peptides containing two TOAC labels, incorporated at various sequence positions, revealed different extents of exchange coupling in liquid solution at room temperature (Hanson et al. Reference Hanson, Millhauser, Formaggio, Crisma and Toniolo1996). However, the translation of J into a distance is difficult since exchange coupling can be mediated not only through space but also through bond and thus depends on distances, bond orders, angles, and mechanisms (Kahn, Reference Kahn1993).
In contrast, all of the following experiments are based on the dipolar coupling ωdip, which is only mediated through space and shows an R −3 dependence [see Section 2.1 and Eq. (5)]. This approach is usually limited to frozen samples or orienting media since ωdip is averaged out in the liquid state. On the other hand, it permits to gather distances parameter free and orientation selective measurements might resolve the orientation of both spin centers with respect to each other. Yet, frozen samples give rise to the question whether the observed structure is still relevant under biological conditions. This restriction can be circumvented if the rotational correlation time of a molecule is larger than ∼1/ωdip or by applying relaxation-based distance measurements (see Sections 2.6 and 4.4.3). In these cases, distance measurements can also be performed in the liquid state at physiological temperatures.
Rabenstein and Shin were the first to show in a systematic study that the dipolar coupling ωdip can be extracted by Fourier deconvolution from continuous wave EPR spectra of frozen aqueous samples (Rabenstein & Shin, Reference Rabenstein and Shin1995). Their peptide ruler spans distances from 8 to 25 Å. The same range is accessible by means of simulating frozen solution EPR spectra (Hustedt & Beth, Reference Hustedt, Beth, Berliner, Eaton and Eaton2000). Smaller distances in the range from 4 to 15 Å can be attained via the relative intensity of the half-field transition (Anderson et al. Reference Anderson, Hanson, McNulty, Millhauser, Monaco, Formaggio, Crisma and Toniolo1999).
The first example for the application of PELDOR in the field of spin-labeled peptides was given by Milov et al. (Reference Milov, Maryasov, Tsvetkov and Raap1999) on two-fold TOAC-substituted trichogin. Their experiment yielded a distance of 19·7 Å and a narrow distance distribution of ±1 Å, indicating a 27-configuration of the helix in a frozen chloroform/dimethylsulfoxide matrix (see also Section 4.5.1). A systematic PELDOR study on five end-labeled bis-peptides of different lengths in frozen aqueous buffer solution was published in 2006 (Pornsuwan et al. Reference Pornsuwan, Bird, Schafmeister and Saxena2006). The measured distances show a linear increase from 23·8 to 34·6 Å and a broadening of the distance distributions with increasing number of peptide building blocks between the spin labels. This in combination with the good agreement with the mean distances of MD simulations proves the rigid rod-like structure of the bis-peptides. The observation that the experimental distribution width is smaller than the one from the MD calculations is attributed by the authors to a systematic overestimation of the bis-peptide flexibility by the MD. Another explanation might be that only a fraction of conformations populated at room temperature are trapped in the frozen state.
DQC-EPR was applied to bis-labeled model peptides as early as 1996 by Freed and colleagues (Saxena & Freed, Reference Saxena and Freed1996, Reference Saxena and Freed1997; Borbat & Freed, Reference Borbat and Freed1999) and later with smaller B1-fields and suppression of hyperfine artifacts by Saxena et al. (Bonora et al. Reference Bonora, Becker and Saxena2004).
4.1.3 Distance measurements on spin-labelled proteins
4.1.3.1 Continuous wave EPR
Continuous wave EPR-based distance measurements between spin labels were successfully applied to investigate structures and structural changes of proteins, protein–protein, and protein–oligonucleotide complexes and have been reviewed already (Hustedt & Beth, Reference Hustedt and Beth1999; Hubbell et al. Reference Hubbell, Cafiso and Altenbach2000; Borbat et al. Reference Borbat, Costa-Filho, Earle, Moscicki and Freed2001; Perozo, Reference Perozo2002; Steinhoff, Reference Steinhoff2004). Here we would like to explicitly mention the work on the light-activation of rhodopsin as illustrated in Fig. 8 (Farrens et al. Reference Farrens, Altenbach, Yang, Hubbell and Khorana1996), the work on the KcsA channel (Perozo et al. Reference Perozo, Cortes and Cuello1999; Liu et al. Reference Liu, Sompornpisut and Perozo2001), on the MscL channel (Perozo et al. Reference Perozo, Cortes, Sompornpisut, Kloda and Martinac2002), and the archaeal sensory rhodopsin II/transducer complex (Wegener et al. Reference Wegener, Klare, Engelhard and Steinhoff2001; Klare et al. Reference Klare, Gordeliy, Labahn, Büldt, Steinhoff and Engelhard2004). All of these studies allowed the observation of functionally induced structural changes. It should, however, be stated that the conclusions drawn were not solely based on distance measurements, but backed up by additional EPR data like accessibility, mobility, and polarity. The proposed structure of the sensory rhodopsin II/transducer complex was in the meantime confirmed by X-ray diffraction (Gordeliy et al. Reference Gordeliy, Labahn, Moukhametzianov, Efremov, Granzin, Schlesinger, Büldt, Savopol, Scheidig, Klare and Engelhard2002).

Fig. 8. Continuous wave EPR: Distance measurements between pairs of MTSSL labels attached to rhodopsin. For each pair, one label was attached to site 139, whereas the second label was varied through sites 248–252 in helix VI. The EPR spectra were recorded at room temperature and are shown on the right. The red traces correspond to the dark and the blue traces to the light-activated state. The light-induced movement of helix VI leads for each pair to a distance change, which reflects itself in a line width and amplitude change. A relative line broadening and decrease in amplitude indicates a decrease in inter-spin distance. while a line narrowing and increase in amplitude points to an increase in inter-spin distance (Hubbell et al. Reference Hubbell, Cafiso and Altenbach2000).
Four different approaches to extract distances from continuous wave X-band EPR spectra were tested on the well-characterized human carbonic anhydrase II (Persson et al. Reference Persson, Harbridge, Hammerström, Mitri, Mårtensson, Carlsson, Eaton and Eaton2001). It was found that at very short distances, R⩽8 Å, the relative ratio between the intensities of the half-field signal and the g=2 signal may be used. This approach, as well as using the ratio of peak heights as an indication for dipolar line broadening (Kokorin et al. Reference Kokorin, Zamarayev, Grigoryan, Ivanov and Rozantsev1972; Sun et al. Reference Sun, Voss, Hubbell and Kaback1999) is hampered by the presence of singly labeled molecules due to incomplete spin labeling. Fourier deconvolution and lineshape simulations worked well within a distance range of 8–20 Å, but both methods require, in particular for longer distances, linewidth information of the singly labeled protein as already shown by Rabenstein and Steinhoff (Rabenstein & Shin, Reference Rabenstein and Shin1995; Steinhoff et al. Reference Steinhoff, Radziwill, Thevis, Lenz, Brandenburg, Antson, Dodson and Wollmer1997). PELDOR time traces on carbonic anhydrase II revealed in one case an oscillation corresponding to a distance of 18 Å (Persson et al. Reference Persson, Harbridge, Hammerström, Mitri, Mårtensson, Carlsson, Eaton and Eaton2001). Larger distances could not be accessed due to the short observation time window of 800 ns.
Hubbell and colleagues showed on T4 lysozyme that inter-spin label distances can also be extracted from continuous wave EPR spectra of proteins in liquid solution at room temperature, provided the overall rotation of the protein is in the slow motion regime (Yang et al. Reference Yang, Farrens, Altenbach, Farahbakhsh, Hubbell and Khorana1996; Hubbell et al. Reference Hubbell, Cafiso and Altenbach2000; Langen et al. Reference Langen, Oh, Cascio and Hubbell2000; Altenbach et al. Reference Altenbach, Oh, Trabanino, Hideg and Hubbell2001). The dipolarly broadened spectra were fitted by convoluting the spectrum of the singly labeled species with a distribution of Pake patterns. The agreement between the distances obtained at room temperature, at cryogenic temperatures, and in the crystal structure makes this approach very promising. Furthermore, the distance distributions from the experiments are in accordance with MD simulations. On the other hand, this method only works in the narrow distance range from ∼8 to ∼18 Å and the error of the method is large in the presence of singly labeled proteins.
4.1.3.2 ‘2+1’/PELDOR
A ‘2+1’ investigation on spin-labeled tetrameric hemoglobin (Raitsimring et al. Reference Raitsimring, Peisach, Lee and Chen1992) was reported in 1992. The data analysis was, however, complicated by strong aggregation and hyperfine artifacts. Later studies on spin-labeled proteins were mainly PELDOR based, due to an improved suppression of these artifacts (Raitsimring et al. Reference Raitsimring, Crepeau and Freed1995).
PELDOR and continuous wave EPR methods were utilized to distinguish between two computational models for the inhibitory region of the cardiac troponin ternary complex. Based on the PELDOR constraints, this region appeared to be α-helical (Brown et al. Reference Brown, Sale, Hills, Rouviere, Song, Zhang and Fajer2002) in agreement with X-ray data, but disproving both computational models. Later it could be shown by PELDOR that binding of Ca2+ induces structural changes (Fajer, Reference Fajer2005). In a proof-of-principle study distances were gathered from PELDOR and continuous wave EPR, and relaxation measurements on the KcsA channel, troponin C, and the troponin complex (Sale et al., Reference Sale, Song, Liu, Perozo and Fajer2005). These distances were compared with the respective Cβ–Cβ distances and with inter-spin distances obtained from MD simulations, taking the spin labels explicitly into account. The deviation was found to be large using just Cβ–Cβ distances, especially for shorter distances, whereas the overall deviation was only 3 Å over a distance range from roughly 5 to 45 Å with respect to the MD simulations.
The arrangement of the two β-subunits of the F0F1-ATP synthase from Escherchia coli was studied by labeling each subunit with a single spin label and measuring the resulting distance in the dimer with PELDOR (Steigmiller et al. Reference Steigmiller, Börsch, Gräber and Huber2005). The same distance of 29 Å was found for five different mutants, suggesting that the two helical subunits are aligned in a parallel fashion. Nevertheless, it could not be differentiated between an in-register alignment, with the two helices 19 Å apart from each other, and an arrangement where the two helices contact each other but are shifted by 27 Å with respect to the same amino acid. These conclusions were again substantiated by continuous wave EPR polarity and mobility studies.
Continuous wave EPR and PELDOR experiments on the cytoplasmic domain of the anion exchange protein (cdb3) indicated that the global arrangement of the central dimer in solution at neutral pH is identical to the one in the crystals grown at pH 4·8 (Zhou et al. Reference Zhou, DeSensi, Stein, Brandond, Dixit, McArdle, Warren, Kroh, Song, Cobb, Hustedt and Beth2005). PELDOR time traces with oscillations were collected for the doubly spin-labeled protein in phosphate buffer with 30% glycerol. The C- and N-termini were found to be unstructured as in the crystal structure.
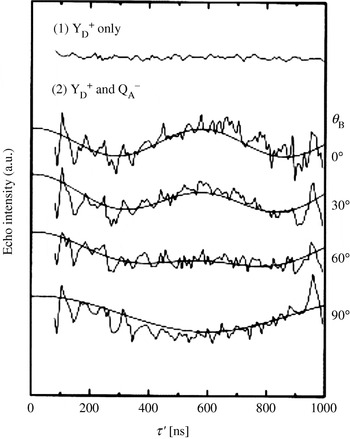
In one case, a spin label was attached to a native cysteine in the bacterial reaction center of Rhodobacter sphaeroides and the distance to the reduced primary acceptor Q A was measured (Borovykh et al. Reference Borovykh, Ceola, Gajula, Gast, Steinhoff and Huber2006). The PELDOR time trace shows long-lived oscillations corresponding to a distance of 30·5±0·5 Å and a distance distribution of 2·4±0·2 Å. MD simulations at room temperature and at low temperature both revealed a slightly smaller distance of 28·0±0·5 Å. Nevertheless, this approach might allow examination of small electron-transfer-induced structural changes at cofactor sites.
PELDOR studies on membrane-bound proteins showed only barely visible dipolar oscillations or exponential decays (Jeschke et al. Reference Jeschke, Wegener, Nietschke, Jung and Steinhoff2004c; Jeschke et al. Reference Jeschke, Bender, Schweikardt, Panek, Decker and Paulsen2005; Borbat et al. Reference Borbat, Ramlall, Freed and Eliezer2006; Xu et al. Reference Xu, Ellena, Kim and Cafiso2006). In such cases, conclusions are mainly qualitative and should be drawn carefully. A major problem of spin-labeled proteins in membranes may be sample heterogeneity, caused by partial reconstitution, as well as clustering of proteins and vesicles and a fast relaxation time T 2 of the nitroxides.
4.1.3.3 DQC-EPR
The first application of DQC-EPR to a protein was a proof-of-principle study on T4 lysozyme (Borbat et al. Reference Borbat, Mchaourab and Freed2002). Eight doubly MTSSL-labeled cysteine mutants were investigated by DQC-EPR at X- and K-band frequencies. All time traces revealed dipolar modulations, corresponding to distances from 20 to 50 Å, which fit nicely to the crystal structure of the protein. Distance distributions were analyzed with respect to linker flexibility and conformations. DQC-EPR was also utilized to investigate channel formation of gramicidin A in dependence of the type of lipid membrane (Dzikovski et al. Reference Dzikovski, Borbat and Freed2004).
An example for the power of DQC-EPR/PELDOR is the work on the chemotaxis receptor-kinase assembly of Thermotoga maritime (Park et al. Reference Park, Borbat, Gonzalez-Bonet, Bhatnagar, Pollard, Freed, Bilwes and Crane2006). The structures of the CheW subdomain 2 and of the CheA domain P5 were known from NMR and X-ray analysis, respectively. The structural arrangement of both in the CheA:CheW complex was predicted based on 40 different long-range constraints collected by DQC-EPR/PELDOR experiments and was validated by the crystal structure of the CheA(P4, P5):CheW complex in the presence of the nonhydrolyzable ATP analog ADPNP (see Fig. 9). The measured distances cover a range from 14 to 70 Å and fit very well to the structure. Deviations in a few cases are overcompensated by the large amount of distance constraints. Implications for the mechanism of signaling were discussed based on the complex structure as well as biochemical studies.

Fig. 9. DQC-EPR: Complex formation of the receptor-coupling protein CheW and the histidine kinase CheA. (a) DQC-EPR time trace for a CheA dimer labeled at site 318 and its Fourier transformation. (b) Arrangement of CheW subdomain-2 (NMR solution structure) and CheA domain P5 (crystal structure) in the CheA:CheW complex as predicted from DQC-EPR/PELDOR distance measurements. (c) Crystal structure (Park et al. Reference Park, Borbat, Gonzalez-Bonet, Bhatnagar, Pollard, Freed, Bilwes and Crane2006).
4.2 Cofactors in proteins
4.2.1 Distance measurements on augmenter of liver regeneration
PELDOR was used to obtain structural information about the human augmenter of liver regeneration (ALR), a homodimeric sulfhydryl oxidase catalyzing the formation of disulfide bonds (Kay et al. Reference Kay, Elsässer, Bittl, Farrell and Thorpe2006). Each of the two subunits contains a flavin, which can be reduced to a neutral flavin radical. The high yield of radical formation together with the fixed distance and orientation between both flavins allowed the observation of a deep and long-lived dipolar oscillation. Fourier transformation revealed both singularities of the Pake pattern permitting a parameter-free calculation of the distance to 26·1±0·8 Å, which fits to the distance estimated from the crystal structure of rat ALR.
4.2.2 Distance measurements on ribonucleotide reductase
Ribonucleotide reductase (RNR) is a protein that catalyzes the conversion of nucleoside diphosphates to desoxynucleoside diphosphates. The mechanism of this conversion is not fully understood yet, but known to involve an electron transfer from a tyrosyl radical in the R2 subunit to the active site in the R1 subunit. It is proposed that the active protein is a 1:1 complex of the two homodimeric subunits R1 and R2 (Stubbe et al. Reference Stubbe, Nocera, Yee and Chang2003; Kolberg et al. Reference Kolberg, Strand, Graff and Andersson2004; Bennati et al. Reference Bennati, Lendzian, Schmittel and Zipse2005a). The tyrosyl radical intermediates can be trapped with a yield of roughly one tyrosyl radical per R2 homodimer and can be detected EPR spectroscopically. A X-band PELDOR study on RNR from E. coli proved that in some cases two tyrosyl radicals are formed within one homodimeric R2 subunit in vitro and that the distance between them is 33·1 Å (Bennati et al. Reference Bennati, Weber, Antonic, Perlstein, Robblee and Stubbe2003). Taking spin density distributions into account, this distance is in accordance with the distance of 32·6 Å calculated from the crystal structure. The fact that dipolar oscillations were also found in PELDOR spectra of the R2 subunit of mouse RNR indicates that R2 is dimeric in some mammalian RNRs too (Biglino et al. Reference Biglino, Schmidt, Reijerse and Lubitz2006).
It was anticipated that the g-anisotropy of the tyrosyl radicals will lead to strong orientation selectivity at higher frequencies. Thus, a technical setup for PELDOR at 180 GHz was used (Denysenkov et al. Reference Denysenkov, Prisner, Stubbe and Bennati2005; Hertel et al. Reference Hertel, Denysenkov, Bennati and Prisner2005) and subsequently applied to RNR (Denysenkov et al. Reference Denysenkov, Prisner, Stubbe and Bennati2006). Systematically varying the position of the pump and detection pulses over the field-swept spectrum revealed a well-resolved orientation selection visible in the PELDOR time traces (see Fig. 10). Simulating this orientation dependence of the dipolar coupling ωdip allowed to obtain not only the distance, but also the mutual orientation of both the radicals. The orientation agrees well with g tensor studies at high field (Högbom et al. Reference Högbom, Galander, Andersson, Kolberg, Hofbauer, Lassmann, Nordlund and Lendzian2003) and both show the same small deviation of 10° with respect to the crystal structure of the nonradical state (Nordlund et al. Reference Nordlund, Sjöberg and Eklund1990).

Fig. 10. High-field PELDOR: Distance and orientation between the two tyrosyl radicals in the R2 dimer. (a) Representative PELDOR time trace and the field-sweep EPR spectrum (inset). (b) PELDOR time traces acquired at different field positions after dividing by the intermolecular decay and the respective fits of the time traces (Denysenkov et al. Reference Denysenkov, Prisner, Stubbe and Bennati2006).
In the reaction of RNR with the inhibitor 2′-azido-2′-deoxyuridine-5′diphosphate (N3UDP), an electron is transferred from the tyrosyl radical in the R2 subunit to the inhibitor in the R1 subunit, leading to the formation of a new nitrogen-centered radical, whose structure was recently solved (Fritscher et al. Reference Fritscher, Artin, Wnuk, Bar, Robblee, Kacprzak, Kaupp, Griffin, Bennati and Stubbe2005). EPR measurements showed that both radicals, tyrosyl and inhibitor, are simultaneously present in the sample. PELDOR (X-band) as well as DQC-EPR (K-band) experiments led to fairly deep modulations for both methods from which Tikhonov regularizations extracted two distances (Bennati et al. Reference Bennati, Robblee, Mugnaini, Stubbe, Freed and Borbat2005b): one of 33 Å, corresponding to the already known distance between the two tyrosyl radicals within the R2 subunit, and a new distance of 48·2 Å. Measurements at higher temperatures indicated that the larger distance belongs to the tyrosyl-inhibitor radical pair and not to the inhibitor–inhibitor pair. Using the structural model based on R1:R2 docking studies, the authors found that the distance fits best to the distance between tyrosine and inhibitor located on different sites of the R1:R2 complex. This suggests that the electron-transfer proceeds over 35 Å, from the tyrosine to the inhibitor located both on the same site of the complex.
4.2.3 Distance measurements in photosystems
Photosynthetic proteins, like bacterial reaction centers (bRC), plant photosystem I (PS I), and photosystem II (PS II), are a special case with respect to EPR distance measurements. First of all, they are probably the most intensively studied protein complexes by EPR (Lubitz, Reference Lubitz and Murphy2004), and secondly the light-induced radical formation leads to spin polarization which demands unusual methods, as described in Section 2.5. These methods and their applications to photosynthetic proteins are well described in numerous reviews (Snyder & Thurnauer, Reference Snyder, Thurnauer, Deisenhofer and Norris1993; Stehlik & Möbius, Reference Stehlik and Möbius1997; Lubitz & Feher, Reference Lubitz and Feher1999; Dzuba & Hoff, Reference Dzuba, Hoff, Berliner, Eaton and Eaton2000; Lakshmi & Brudvig, Reference Lakshmi, Brudvig, Berliner, Eaton and Eaton2000; Bittl & Zech, Reference Bittl and Zech2001; Lubitz et al. Reference Lubitz, Lendzian and Bittl2002; Bittl & Weber, Reference Bittl and Weber2005). Bittl and Kawamori gave a good overview of EPR distance measurements in PS II, performed even before the crystal structures of PS II were known (Bittl & Kawamori, Reference Bittl, Kawamori, Wydrzynski and Satoh2005). Here we summarize few examples involving organic cofactors. Measurements including metal centers in PS II are dealt with separately in Sections 4.4.2.2 and 4.4.3.2.
4.2.3.1 Bacterial reaction center
After the crystal structure was solved (Deisenhofer et al. Reference Deisenhofer, Miki, Huber and Michel1986), the bacterial reaction center served as a benchmark system for distance determination by EPR methods. Transient spin-polarized EPR spectra were recorded as early as 1977 (Hoff et al. Reference Hoff, Gast and Romijn1977) and interpreted in terms of dipolar distances later (Hore et al. Reference Hore, Hunter, McKie and Hoff1987). The relative orientation of the chlorophyll dimer P 865+● to Q A−● could be determined in addition to the distance of 28 Å by extending these experiments to higher microwave frequencies (Est et al. Reference Est, Bittl, Abresch, Lubitz and Stehlik1993; Prisner et al. Reference Prisner, Est, Bittl, Lubitz, Stehlik and Möbius1995). Quantum-beat oscillations of the dipolar coupling shortly after the laser flash excitation were observed for this pair by transient EPR with high time resolution (Kothe et al. Reference Kothe, Weber, Ohmes, Thurnauer and Norris1994). Also, out-of-phase echo envelope modulation was used to measure the distance in this radical pair (Dzuba et al. Reference Dzuba, Gast and Hoff1995) and to investigate postulated structural changes upon freezing procedures (Dzuba et al. Reference Dzuba, Gast and Hoff1997; Stehlik & Möbius, Reference Stehlik and Möbius1997; Borovykh et al. Reference Borovykh, Kulik, Gast and Dzuba2003). An out-of-phase FID detection of a selective hole-burning experiment was used to examine the dipolar interaction within the 3P 865+●/Q A−● radical pair, with the primary donor in the triplet state (Kulik et al. Reference Kulik, Borovykh, Gast and Dzuba2003).
4.2.3.2 Photosystem I
Research on the PS I of cyanobacteria or spinach led to the invention and application of many methods for distance measurements on photo-excited spin-correlated radical pairs. The correlated radical pair spectrum of P 700+●/A 1−● was observed first in 1977 (Blankenship et al. Reference Blankenship, McGuire and Sauer1975). Measurements with high spectral resolution, performed at K-band (24 GHz) and room temperature (Bock et al. Reference Bock, Stehlik and Thurnauer1988) and later also at W-band (95 GHz) (Est et al. Reference Est, Prisner, Bittl, Fromme, Lubitz, Möbius and Stehlik1997), allowed to deduce the distance and relative orientation of these two cofactors. The zero-quantum coherence created by the dipolar coupling of the spins after the fast charge separation was observed for the first time in 1991 (Kothe et al. Reference Kothe, Weber, Bittl, Ohmes, Thurnauer and Norris1991). This method has been extended later to Q-band frequencies (34 GHz) leading to a higher spectral resolution (Link et al. Reference Link, Berthold, Bechtold, Weidner, Ohmes, Tang, Poluektov, Utschig, Schlesselman, Thurnauer and Kothe2001). Out-of-phase echo modulation was seen for the first time on PS I of cyanobacteria (Thurnauer & Clark, Reference Thurnauer and Clark1984). Later on, this method was used to compare the structure of the radical pair in PS I and bRC (Bittl & Zech, Reference Bittl and Zech1997) and mutants thereof (Santabarbara et al. Reference Santabarbara, Kuprov, Fairclough, Purton, Hore, Heathcote and Evans2005).
4.2.3.3 Photosystem II
Examples for out-of-phase echo measurements on PS II are two studies of Hara et al. (Reference Hara, Dzuba, Kawamori, Akabori, Tomo, Satoh, Iwaki and Itoh1997) and Zech et al. (Reference Zech, Kurreck, Eckert, Renger, Lubitz and Bittl1997) on the radical pair P 680+●/Q A−●, yielding distances of 27·2 and 27·4 Å, respectively. Interestingly, the latter study was performed at physiological temperatures. Low temperature measurements on oriented membranes revealed an angle of 21° between the dipolar vector and the membrane normal (Yoshii et al. Reference Yoshii, Hara, Kawamori, Akabori, Iwaki and Itoh1999a). Out-of-phase echo measurements have also been applied to acquire the distance between Q A−● and Y Z+● (Zech et al. Reference Zech, Kurreck, Renger, Lubitz and Bittl1999). This distance was later confirmed by PELDOR (R=34·5±1 Å) (Kawamori et al. Reference Kawamori, Katsuta, Mino, Ishii, Minagawa and Ono2002) and by the X-ray structure with R=34·2 Å (Zouni et al. Reference Zouni, Witt, Kern, Fromme, Krauß, Saenger and Orth2001). A spin-polarized radical pair constituted out of a triplet chlorophyll (3Chl) and Q A−● displayed in the out-of-phase echo modulation an oscillation with a frequency corresponding to 25·9±0·5 Å. The authors suggested that this 3Chl signal originates from the accessory chlorophyll on the D1 protein by comparison with X-ray data (Kawamori et al. Reference Kawamori, Ono, Ishii, Nakazawa, Hara, Tomo, Minagawa, Bittl and Dzuba2005).
While for the out-of-phase echo modulation spin-polarized radical pairs are essential, the ‘2+1’ echo sequence and PELDOR are applicable to trapped non-polarized radical pairs. In such experiments, Y D+● was frequently used as one spin center and its distances to other cofactors was measured. For the Y D+●/Y Z+● pair a distance of 29·5±0·5 Å (Astashkin et al. Reference Astashkin, Kodera and Kawamori1994) and an angle between the distance vector and membrane normal of 80° or 100° was found (Astashkin et al. Reference Astashkin, Hara and Kawamori1998). The distance was later reconfirmed (Tonaka et al. Reference Tonaka, Kawamori, Hara and Astashkin2000) and agrees with the distance in the X-ray structure (r=29·2 Å). For the couple Y D+●/Chl Z +● a distance of 29·4±0·5 Å (Shigemori et al. Reference Shigemori, Hara, Kawamori and Akabori1998) and an orientation with respect to the membrane normal of 50±5° was obtained (Kawamori et al. Reference Kawamori, Katsuta, Mino, Ishii, Minagawa and Ono2002). Both, distance and angle, have been verified recently by PELDOR measurements (Kawamori et al. Reference Kawamori, Ono, Ishii, Nakazawa, Hara, Tomo, Minagawa, Bittl and Dzuba2005). However, the crystal structure reveals a slightly shorter distance of 26·8 Å. The distance between Y D+● and Q A−● was determined to 38·5±0·8 Å, close to the distance of 40 Å found in the crystal structure (Yoshii et al. Reference Yoshii, Kawamori, Tonaka and Akabori1999b). Measurements in oriented membranes gave an angle of 13±4° between the dipolar vector and membrane normal (see Fig. 11). PELDOR-based distance measurements are also reported for Y D+● and a radical species belonging to the so-called doublet signal (Mino et al. Reference Mino, Kawamori and Ono2000).

Fig. 11. Out-of-phase echo detection for the couple Y D+●/Q A−● in Fe2+-depleted PS II using oriented membranes. Trace 1 shows the time trace for the Y D+● only case with the membrane normal parallel to B 0 (θB=0). Traces 2 show the variation of the frequency of the modulation for different angles θB. The solid lines are simulations (Yoshii et al. Reference Yoshii, Kawamori, Tonaka and Akabori1999b).
4.3 DNA/RNA
EPR spectroscopic studies on RNA or DNA date back to the 1970s, but were mainly restricted to the analysis of global or sequence dependent mobility of oligonucleotides (Robinson & Drobny, Reference Robinson and Drobny1995; Robinson et al. Reference Robinson, Mailer and Drobny1997; Keyes & Bobst, Reference Keyes, Bobst and Berliner1998; Liang et al. Reference Liang, Freed, Keyes and Bobst2000; Qin et al. Reference Qin, Butcher, Feigon and Hubbell2001; Qin & Dieckmann, Reference Qin and Dieckmann2004). Only recently, several groups started to employ EPR-based distance measurements between nitroxides to predict structure elements in RNA/DNA. One reason might be that strategies had to be developed first to site specifically spin label oligonucleotides in high yields (Verma & Eckstein, Reference Verma and Eckstein1998). Another reason is that only during the last 10–20 years, more and more of the structural and functional diversity of RNA has been discovered, making it an increasingly interesting target for studies concerning structure–function relationships and drug targeting.
4.3.1 Spin labeling of DNA/RNA
The methods nowadays available for site-specific spin labeling of oligonucleotides can be divided into three categories: (1) labeling of naturally occurring unique groups, (2) introducing unique groups by means of automated solid-phase synthesis, and (3) enzymatic labeling. Naturally occurring unique groups that can be labeled selectively are the 3′- or 5′-ends (Caron & Dugas, Reference Caron and Dugas1976; Luoma et al. Reference Luoma, Herring and Marshall1982) or unusual bases within tRNAs, e.g. 4-thiouridine (Hara et al. Reference Hara, Horiuche, Saneyoshi and Nishimura1970; McIntosh et al. Reference McIntosh, Caron and Dugas1973). In the former case, labeling is restricted to the ends of oligonucleotides and the latter case is mainly applicable to tRNAs. However, both can be applied to large oligonucleotides. The largest flexibility with respect to labeling sites and labels is given if the oligonucleotide is not longer than ∼80 bases. In this case, various protocols exist to introduce nitroxide spin labels to the phosphate backbone, the sugar or the base moiety utilizing automated solid-phase synthesis. The general idea is that a phosphoramidite with a unique functional group is incorporated into the RNA/DNA sequence at the desired position. This group can already be a spin label or a functional group which reacts selectively with a spin label possessing a complementary functional group. Examples are given together with the respective distance measurements in the next section. Especially, Bobst et al. showed that the length restriction can be circumvented by enzymatic labeling using Klenow filling (Bobst et al. Reference Bobst, Pauly, Keyes and Bobst1988; Keyes & Bobst, Reference Keyes, Bobst and Berliner1998); another example is presented by Sprinzl et al. (Reference Sprinzl, Krämer and Stehlik1974). Another possibility might be to ligate two already labeled oligonucleotides by means of a ligase.
The choice of the appropriate spin label strategy depends on the scientific question and the system under study. To increase the number of accessible systems, easier synthesis strategies with higher yields and different spin labels are needed. For example, very rigid nitroxides attached via two bonds (Miller et al. Reference Miller, Alley, Reese, Solomon, MacCallister, Mailer, Robinson and Hopkins1995; Okonogi et al. Reference Okonogi, Alley, Reese, Hopkins and Robinson2000; Cekan & Sigurdsson, Reference Cekan and Sigurdsson2005) could allow gathering of not only information about nitroxide–nitroxide distances, but also about their relative orientation. Spin labels with different combinations of isotopes or other labels than nitroxides could permit individual microwave addressing of each spin center, which is of interest for the analysis of complexes containing more than two labels.
4.3.2 Distance measurements on duplex DNA/RNA
As long as the label does not disturb the structure of the oligonucleotide or its binding to a protein, distance measurements demand rigid and short labels to simplify the translation of distances into structure and allow the observation of deep dipolar oscillations in the case of ‘2+1’, PELDOR, and DQC-EPR. One example is the ethynyl functionalized nitroxide called TPA (see Fig. 12), which is cross-coupled to 5-iodouridine or 5-iodo-2′-desoxyuridine during the automated solid-phase synthesis of RNA (Piton et al. Reference Piton, Schiemann, Mu, Stock, Prisner and Engels2005; Piton et al. Reference Piton, Mu, Stock, Prisner, Schiemann and Engels2007) or DNA (Strube et al. Reference Strube, Schiemann, MacMillan, Prisner and Engels2001), respectively. The palladium catalyzed Sonogashira cross-coupling is almost quantitative (>95%), small amounts of spin label are required, the 5-iodouridinephosphoramidites are commercially available, and the overall yield of doubly spin-labeled RNA/DNA is high (35–50% on a 0·2-μM scale) (Schiemann et al. Reference Schiemann, Piton, Plackmeyer, Bode, Prisner and Engels2007). Another synthetically more challenging way is to synthesize the TPA-labeled phosphoramidite and to incorporate it into the oligonucleotide (Spaltenstein et al. Reference Spaltenstein, Robinson and Hopkins1989). PELDOR measurements were performed on several doubly TPA-labeled DNA (Schiemann et al. Reference Schiemann, Piton, Mu, Stock, Engels and Prisner2004) and RNA (Piton et al. Reference Piton, Schiemann, Mu, Stock, Prisner and Engels2007) duplexes with different distances between the two labels (see Fig. 13). All of the PELDOR time traces show at least one full oscillation period allowing to establish a reliable and precise nanometer distance ruler for oligonucleotides stretching from 15 to 55 Å. MD simulations on the labeled oligonucleotides were then used to correlate the obtained distances with the DNA/RNA structure. This confirmed that DNA and RNA duplexes retain their B- and A-forms, respectively, in frozen buffer solution and the presence of 20% ethylene glycol. For a detailed description of the setup of the PELDOR experiment and the spin labeling of oligonucleotides with TPA refer to Schiemann et al. (Reference Schiemann, Piton, Plackmeyer, Bode, Prisner and Engels2007).
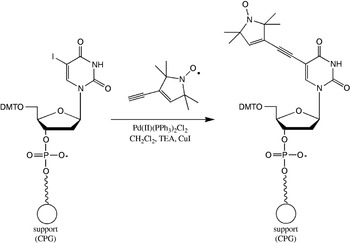
Fig. 12. Spin labeling of RNA/DNA on solid support using TPA (Schiemann et al. Reference Schiemann, Piton, Mu, Stock, Engels and Prisner2004).

Fig. 13. PELDOR based distance ruler for DNA. (a) Structure of two-fold TPA labeled DNA as obtained from MD-simulations. (b) PELDOR time traces of five DNAs with increasing distance between the TPA labels. The intermolecular background was subtracted. (c) Pake pattern achieved by Fourier transformation of the PELDOR time trace of DNA 1. (d) Correlation between the distances gathered from PELDOR and those from MD simulations (Schiemann et al. Reference Schiemann, Piton, Mu, Stock, Engels and Prisner2004).
The group of Sigurdsson published in 2001, a method by which a nitroxide is attached to the 2′-sugar site of RNA strands via a urea linker (Edwards et al. Reference Edwards, Okonogi, Robinson and Sigurdsson2001). This protocol is limited to the 2′-sugar site and the linker is more flexible than the ethynyl group, but the commercial availability of the 2′-amino-uridinephosphoramidite, the easy one-step synthesis of the functionalized spin label and the straight forward coupling step are advantageous. PELDOR spectra of a RNA duplex labeled with two of these nitroxides show a weak modulation amplitude, but the frequency of the oscillation fits nicely to the distance of 35 Å expected from structure modeling (Schiemann et al. Reference Schiemann, Weber, Edwards, Prisner and Sigurdsson2003). The weak modulation amplitude may be traced back to the larger flexibility of the nitroxide linker and/or to the fact that these experiments were performed without ethylene glycol.
DeRose and colleagues use instead of the isocyanate nitroxide a succinimidyl-functionalized label and couple it to 2′-amino-modified RNA (Bowman et al. Reference Bowman, Maryasov, Kim and DeRose2004). The resulting amide group is as short as the ethynyl group, but the conformational degree of freedom is larger and coupling yields are very low. PELDOR experiments with time traces as short as 700 ns on two such duplex RNAs show in one case a weak oscillation corresponding to the predicted distance of 24 Å, whereas the other one does not show any modulations. Tikhonov regularization of the latter time trace exhibits a peak between 16 and 20 Å close to the modeled distance but in addition several broad peaks of less intensity, which are attributed to inter-duplex distances resulting from end-to-end stacking of duplexes. The same group used Fourier deconvolution of dipolar broadened continuous wave EPR spectra to establish a RNA ruler in the range of 5–20 Å (Kim et al. Reference Kim, Murali and DeRose2004).
Recently, a spin labeling method was published in order to label the phosphate backbone of DNA by coupling an iodomethylnitroxide to phosphorothiolates (Qin et al. Reference Qin, Butcher, Feigon and Hubbell2001). A similar strategy has been used by Nagahara et al. (Reference Nagahara, Murakami and Makino1992). The big advantage of these methods is their sequence independence; disadvantages are the occurrence of R P and S P stereoisomers and that the nucleotide in the 5′-direction has to be substituted by a desoxyribonucleotide to avoid RNA strand cleavage. If both the isomers are separated, yields decrease by 50%, if they are not separated, distance distributions are broadened. Nevertheless, PELDOR measurements ranging from 20 to 40 Å on a set of doubly labeled dodecamer DNA duplexes showed nice agreement with structural models based on NMR data and generic B-form DNA (Cai et al. Reference Cai, Kusnetzow, Hubbell, Haworth, Gacho, Eps, Hideg, Chambers and Qin2006). This study also confirmed that the B-form of DNA is retained upon freezing. Furthermore, in all of the cases discussed above UV–VIS melting studies, CD measurements, and/or MD simulations indicate only minor and local effects of the labels on the duplex structure. An independent MD analysis of TPA and of a six-membered ring analog (Gannett et al. Reference Gannett, Darian, Powell, Johnson, Mundoma, Greenbaum, Ramsey, Dalal and Budil2002) attached to DNA duplexes indicated structural disturbances which are slightly larger and not local (Darian & Gannett, Reference Darian and Gannett2005), but the sampling times of the MD simulations were only 4 ns and might not have reached thermodynamic equilibrium yet. Interestingly, it was found that the measured and modeled spin–spin distances all agree well, whereas the distance distributions show differences (Cai et al. Reference Cai, Kusnetzow, Hubbell, Haworth, Gacho, Eps, Hideg, Chambers and Qin2006). We observed a similar trend in our studies (unpublished data). This effect may be caused by a too short MD sampling time, which excludes, for example, RNA/DNA bending or differences between the frozen and liquid state.
The longest distance measured by all EPR methods in a biomolecule so far amounts to 72 Å (Borbat et al. Reference Borbat, Davis, Butcher and Freed2004). This was accomplished by employing DQC-EPR and a 26 bp long RNA duplex labeled at the ends with an iodacetamide nitroxide attached to 4-thiouridine. The spin labeling strategy works also within RNA/DNA sequences (Ramos & Varani, Reference Ramos and Varani1998) or with MTSSL (Qin et al. Reference Qin, Hideg, Feigon and Hubbell2003), is practically easy to handle, and the nitroxide as well as the 4-thiouridine phosphoramidite are commercially available. A major drawback is that the uridine base ‘loses’ its N3 imino hydrogen upon labeling, which can lead to large, global structural perturbations.
4.3.3 Distance measurements on biologically relevant DNA/RNA
Summarizing the results from the previous section, it is obvious that several strategies are nowadays available for RNA/DNA spin labeling and that EPR spectroscopy is a powerful tool to measure precisely and reliably distances in oligonucleotides in the range from 5 to 75 Å. Nevertheless, applications of this method to biological relevant oligonucleotides or oligonucleotide/protein complexes are rare and mainly restricted to continuous wave EPR methods.
The DeRose group published a study related to Ca2+-induced structural changes in the HIV-1 TAR RNA in 2004 (Kim et al. Reference Kim, Murali and DeRose2004). They labeled uridines 25 and 40 located within the bulge region of TAR and determined the interspin distance in the presence and absence of Ca2+ by Fourier deconvolution of continuous wave EPR spectra. The obtained distances of 14·2 and 11·9 Å are close to the modeled distance and show the anticipated increase in distance upon Ca2+ binding. Earlier in 1999, a continuous wave EPR distance measurement on the HIV Rev peptide complex binding to the Rev response element (RRE) RNA was reported (Macosko et al. Reference Macosko, Pio, Tinoco and Shin1999). The RNA was labeled by incorporating a guanosine monophosphorothioate at the 5′-end using T7 RNA polymerase and subsequent reaction of the thioate group with MTSSL. By displacing the 5′-end, three different RNA constructs were prepared. The second MTSSL label was introduced into the peptide. Continuous wave EPR spectra of two of these complexes showed dipolar line broadening upon complex formation. Fourier deconvolution yielded distances of 12 and 14 Å in agreement with NMR structures of the complex. The third complex did not show any line broadening, which was expected due to the distance of 40 Å predicted from the NMR structure. Bowman et al. (Reference Bowman, Becker, Sevilla and Zimbrick2005) used PELDOR to estimate the spatial distribution of radicals in tracks of heavy atom irradiated DNA.
4.4 Metal centers in proteins
4.4.1 Continuous wave EPR
Continuous wave EPR-based distance measurements between metal centers are hampered by the broad inhomogeneous line width and are thus restricted to fairly short distances (Eaton & Eaton, Reference Eaton and Eaton2002). The dipolar splitting of the di-copper substituted aminopeptidase from Aeromonas proteolytica is resolved at X-band and a copper–copper distance of 5 Å was calculated from the spectra using simulations (Bennett et al. Reference Bennett, Antholine, D'souza, Chen, Ustinyuk and Holz2002). Interestingly, the di-copper substituted enzyme is catalytically more active than the native di-zinc enzyme for which the crystal structure revealed a metal-to-metal distance of 3·5 Å. An example for the potency of continuous wave high-field EPR is the resolution of a dipolar coupling between the Mn2+-ion and the binuclear mixed-valent CuA-center in cytochrome c oxidase at 95 GHz (Käss et al. Reference Käss, MacMillan, Ludwig and Prisner2000). In this case, the dipolar coupling led to a splitting of each manganese lines into doublets, which is impossible to observe at X-band frequencies (see Fig. 14). If the CuA-center is reduced to a diamagnetic state, the splitting disappears, which proves that the splitting is caused by an electron–electron interaction. A distance of 9·4 Å was extracted by simulations. In the case of smaller distances like in the dimanganese(II,II) catalase from Thermus thermophilus or in the arginase from rat liver, where R amounts to ∼3·5 Å (Khangulov et al. Reference Khangulov, Pessiki, Barynin, Ash and Dismukes1995), the dipolar coupling between two Mn2+-ions can also be estimated by simulations of continuous wave X-band EPR spectra (Golombek & Hendrich, Reference Golombek and Hendrich2003). However, more reliable results are obtained by measuring Mn2+-ions at higher fields/frequencies (Ubbink et al. Reference Ubbink, Worrall, Canters, Groenen and Huber2002).
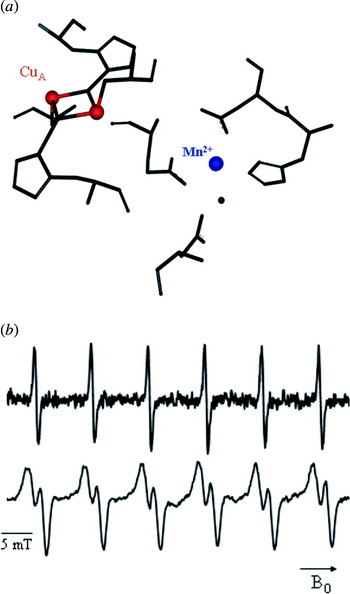
Fig. 14. Dipolar splitting observed by high-field continuous wave EPR spectroscopy. (a) Crystal structure of the metal(II) binding site in cytochrome c oxidase of Paracoccus denitrificans (Ostermeier et al. Reference Ostermeier, Harrenga, Ermler and Michel1997). (b) Continuous wave W-band EPR spectra of the Mn2+ ion with the CuA site reduced (top) and oxidized (bottom). The splitting is well-resolved on each Mn2+-line in the oxidized case (Käss et al. Reference Käss, MacMillan, Ludwig and Prisner2000).
4.4.2 PELDOR
Pulsed-EPR based distance measurements involving metal centers are more demanding than those between organic radicals. One reason is that the spectra can extend over a broad spectral range, leading only to partial excitation and thus weak modulation amplitudes and strong orientation selections. Spin states higher than ½ and fast relaxation times further complicate the experiment.
4.4.2.1 Metal/metal
The first PELDOR measurement between two metal sites has been reported by Elsässer et al. (Reference Elsässer, Brecht and Bittl2002) for the [NiFe]-hydrogenase from Desulfovibrio vulgaris Miyazaki F. The metal sites are the [NiFe]- and the [3Fe–4S]+-cluster both with an effective spin of S =½. The PELDOR time traces were recorded at 5 K in order to slow down relaxation and resolve dipolar modulations (see Fig. 15). The deepest modulation was observed by detecting the [NiFe] signal and inverting parts of the [3Fe–4S]+ signal. The frequency of the observed oscillation (8·5 MHz=18 Å) does, however, not correspond to the average distance of 21 Å inquired from the X-ray structure. The authors solved this discrepancy by weighting the individual distance between each iron in the [3Fe–4S]+ cluster and the [NiFe] center by the individual spin projection factors. The spin projection factors within the cluster were known from Mössbauer studies, but could not be assigned to individual iron ions. For the [NiFe] center it was known that the spin is localized on the nickel center. Thus, the authors used the distance found in the crystal structure and assigned the spin projection factors by fitting the PELDOR data. Excellent agreement was achieved when the largest spin projection factor was ascribed to the iron ion closest to the [NiFe] center. In general, spin projection factors are to be considered in cases of spin delocalization or coupling of spins on different atoms to an effective total spin. The effect of orientation selection was discussed in detail by the same authors (Elsässer et al. Reference Elsässer, Brecht and Bittl2005).

Fig. 15. PELDOR measurements between two metal sites. (a) Structure and arrangement of the [NiFe]- and the [3Fe–4S]+-cluster in the [NiFe]-hydrogenase from Desulfovibrio vulgaris Miyazaki F [PDB (http://www.rcsb.org) entry 1H2A]. (b) Two-pulse field-swept echo EPR spectrum of the hydrogenase. (c) PELDOR time trace with the detection sequence applied on the [NiFe] center and the inversion pulse on the strong [3Fe–4S]+-signal (Elsässer et al. Reference Elsässer, Brecht and Bittl2002).
One year later, PELDOR measurements on a covalently linked azurin dimer containing two Cu2+ions (S=½) were reported (Amsterdam et al. Reference Amsterdam, Ubbink, Canters and Huber2003). The time trace shows an oscillation corresponding to a distance of 26 Å. In contrast, tethering two azurins via a flexible linker did not yield an oscillation, which has been explained to the expected short distance of 14 Å, but may also be due to a large distance distribution caused by the flexible linker. DQC-EPR was performed to measure a Cu2+–Cu2+ distance in a model peptide (Becker & Saxena, Reference Becker and Saxena2005). However, the double quantum coherence pathway could not be effectively filtered from the single quantum pathways containing the hyperfine modulations due to the spectral width of the Cu2+ spectrum. Attempts to measure the Mo5+–Fe3+ distance in sulfite oxidase by means of PELDOR did not reveal any dipolar oscillations (Codd et al. Reference Codd, Astashkin, Pacheco, Raitsimring and Enemark2002).
4.4.2.2 Metal/organic cofactor
PELDOR experiments with deep oscillations involving the oxygen-evolving manganese cluster (OEC) of PS II were performed in 1996, yielding a distance of 27±0·2 Å between the manganese cluster in the S 2 state (S=½) and the tyrosin D cation radical (Y D+●) (Hara et al. Reference Hara, Kawamori, Astashkin and Ono1996). One year later, orientation selective PELDOR measurements have been reported on the same system in oriented membranes (Astashkin et al. Reference Astashkin, Hara and Kawamori1998). These experiments confirmed the distance previously obtained and provided in addition an angle of 110°±2° between the membrane normal and the distance vector connecting the manganese cluster with Y D+●.
In contrast, a PELDOR measurement between Y D+● and the manganese cluster in the S 0 state gave a distance of 34±1 Å (Arao et al. Reference Arao, Yamada, Kawamori, Shen, Ionnidis, Petrouleas and Ohta2002). This distance is 7 Å larger than found for the manganese cluster in the S 2 state and both distances deviate from the distance of 30·3 Å found in the X-ray structure (Zouni et al. Reference Zouni, Witt, Kern, Fromme, Krauß, Saenger and Orth2001). The reason for these discrepancies is most likely the failure of the point-dipole approximation used for the interpretation of the PELDOR time traces. In the case of clusters, the spin–spin coupling between the constituting metal ions have to be dealt with explicitly. These spin–spin couplings and therefore the spin projection factors change by switching the cluster from the S 2 to the S 0 state, leading to different distances for both states (Bittl & Kawamori, Reference Bittl, Kawamori, Wydrzynski and Satoh2005).
PELDOR was also applied in order to measure the distance between Q A−● in PS II and the heme Fe3+ located between the two subunits of cytochrome b 559 (Kuroiwa et al. Reference Kuroiwa, Tonaka, Kawamori and Akabori2000). Cytochrome b 559 is a small electron carrier protein that binds to PS II and is involved in several side-reactions of PS II. Because the EPR spectrum of the heme iron is broad, orientation selective measurements at X-band were possible. Performing these experiments in oriented and nonoriented membranes led to a Fe3+–Q A−● distance of 40 Å and additionally an angle of 78° between the dipolar distance vector and the membrane normal. The X-ray structure revealed a larger distance of 47·8 Å (Zouni et al. Reference Zouni, Witt, Kern, Fromme, Krauß, Saenger and Orth2001). The distance to Y D+● on the other site of PS II could not be resolved, probably due to the expected large distance of 50 Å. Such a distance corresponds to an oscillation period of about 2400 ns, which exceeds the experimental time window of 1400 ns.
4.4.3 Relaxation methods
In cases where a slowly relaxing spin is coupled to a fast relaxing spin, distances can be calculated from the relaxation enhancement detected on the slowly relaxing spin. The quantitative analysis of such data requires the knowledge of several parameters as outlined in Sections 2.6.1 and 2.6.2. It is, however, worth the effort in cases where PELDOR fails due to a broad spectral width, fast T 2 of the observer spin or a too fast T 1 of the pumped spin.
4.4.3.1 Metal/metal
Examples for relaxation measurements involving two metal sites are the three studies on the mixed-valent, binuclear CuA-center (S=½), and the cytochrome a (Fe3+, S=½) in cytochrome c oxidase prior to the crystal structure ( Å; Ostermeier et al. Reference Ostermeier, Harrenga, Ermler and Michel1997). In one case, a distance of 13–26 Å has been extracted from temperature dependent continuous wave EPR saturation data, which contain the product of T 1 and T 2 (Brudvig et al. Reference Brudvig, Blair and Chan1984). In contrast, measuring the relaxation enhancement on T 1 using pulsed saturation recovery led to an upper distance of 10 Å (Scholes et al. Reference Scholes, Janakiraman, Taylor and King1984). In the third case, a lower limit of 8 Å and an upper limit of 13 Å has been found using progressive power saturation, which depends on the product of T 1 and T 2 (Goodman et al. Reference Goodman, John and Leigh1985). These discrepancies may be due to the concurrent presence of several coupled spin centers.
The detailed study on succinate:ubiquinone reductase from Paracoccus denitrificans (Hung et al. Reference Hung, Grant, Peloquin, Waldeck, Britt and Chan2000) is exemplary in its detailed analysis. In this system, a [3Fe–4S] cluster with a total spin of S=½ is the slow relaxing spin center and a Fe3+ ion (b-heme, S=½) is the fast relaxing spin. The relaxation enhancement was measured on T 1 of the iron–sulphur cluster by means of inversion recovery and ‘picket-fence’ pulse sequences in a temperature range of 4–8 K. The ‘picket-fence’ sequence has the advantage of excluding spectral diffusion artifacts from the time trace. A distance of R⩾10 Å between both metal centers was obtained from an analysis including relative orientations. Recently, T2 Hahn-echo measurements have been used to assess the distance between cytochrome c and cytochrome c oxidase in the cytochrome c/cytochrome c oxidase complex (Lyubenova, Reference Goodman, John and Leigh2007).
4.4.3.2 Metal/organic cofactor in PS II
Relaxation enhancement on Y D+● in PS II due to coupling to the manganese cluster in the S 2 state was measured via spin diffusion, using an electron spin echo method employing selective hole burning with subsequent detection of the hole broadening (Kodera et al. Reference Kodera, Dzuba, Hara and Kawamori1994). The obtained distance of ∼28 Å is in good agreement with PELDOR data (Hara et al. Reference Hara, Kawamori, Astashkin and Ono1996) and another relaxation study which includes also the S 1-state (Mamedov et al. Reference Mamedov, Smith, Styring and Pace2004). The distance discrepancy with respect to the crystal structure might again be due to the use of the point-dipole approximation. Relaxation enhancement on Y D+● has also been utilized to determine its distance to the nonheme iron in PS II. Temperature dependent T 1 measurements using saturation recovery yielded a distance of 38±5 Å (Hirsh et al. Reference Hirsh, Beck, Innes and Brudvig1992) in agreement with selective hole burning, R=42±2 Å (Kodera et al. Reference Kodera, Dzuba, Hara and Kawamori1994) and saturation EPR at high field, 40 Å (Un et al. Reference Un, Brunel, Brill, Zimmermann and Rutherford1994).
Distances from the non-heme iron to a β-carotene and to a monomeric chlorophyll have been extracted both by using a three-pulse echo-detected saturation recovery sequence (Lakshmi et al. Reference Lakshmi, Poluektov, Reifler, Wagner, Thurnauer and Brudvig2003). The experiments were performed at a microwave frequency of 130 GHz to resolve the EPR spectra of both cofactors (see Fig. 16). A saturation pulse length of 10 ms was used to measure the relaxation enhancement on T 1 without spin diffusion contributions. The analysis included spin density distributions and yielded distances of 38 Å and ⩾40 Å from the iron to the β-carotene and the chlorophyll radical, respectively, The distance of the nonheme iron to the pheophytin radical was estimated to 20±4 Å based on temperature-dependent pulsed EPR measurements of T 1 (Deligiannakis & Rutherford, Reference Deligiannakis and Rutherford1996). Distances measured between the manganese cluster and Y Z+● or P680+● using various approaches are inconsistent, as discussed by Bittl & Kawamori (Reference Bittl, Kawamori, Wydrzynski and Satoh2005).

Fig. 16. Distance determination via relaxation enhancement. (a) 130 GHz two-pulse Hahn-echo detected field-swept spectrum of Y D+● in PSII. The arrows indicate two different field positions at which saturation recovery experiments were performed. (b) The obtained saturation-recovery traces at the two field positions (low field=solid line and high-field=dashed line). The slightly different relaxation times may indicate relaxation anisotropy. (c) Dipolar relaxation rates extracted from measurements at different temperatures and at D-(filled circles) and X-band (open circles). The analysis of relaxation data collected at various temperatures and different frequencies allowed to obtain a unique solution (Hirsh et al. Reference Hirsh, Beck, Innes and Brudvig1992; Lakshmi et al. Reference Lakshmi, Poluektov, Reifler, Wagner, Thurnauer and Brudvig2003).
4.4.3.3 Metal/nitroxide
A ruler comprised out of a copper–histidine complex attached to the N-terminus of the long interdomain helix of T4 lysozyme and a nitroxide coupled to three different positions on this helix was reported in 1995 (Voss et al. Reference Voss, Hubbell and Kaback1995a, Reference Voss, Salwinski, Kaback and Hubbellb). The relaxation enhancement was extracted from continuous wave EPR spectra by comparing the line intensity of the dipolar coupled copper–nitroxide system with the intensity of the same line in the absence of copper. This method is applicable in the range of 10–25 Å at cryogenic and more important also at room temperature. This approach was also applied later on to the lactose permease of E. coli (Voss et al. Reference Voss, Hubbell and Kaback1995a, Reference Voss, Salwinski, Kaback and Hubbellb, Reference Voss, Hubbell and Kaback1998). It should, however, be kept in mind that in this case the product of T 1 and T 2 is determined and that both relaxation times have to be known to yield reliable distances.
Recently, the unfolding of alanine-based peptides was observed via relaxation enhancement in the liquid state (T=270–315 K) (Jun et al. Reference Jun, Becker, Yonkunas, Coalson and Saxena2006). The peptides were labeled with a copper complex and a nitroxide. The relaxation enhancement was measured on the longitudinal relaxation time T 1 of the nitroxide by means of a FID detected inversion recovery experiment. Detection via the FID was necessary due to the fast transverse relaxation time of the nitroxide at this temperature. It was also attempted to localize the metal(II) binding site in the 16-kDa proton channel of Nephrops norvegicus (Páli et al. Reference Páli, Finbow and Marsh2006) in the liquid state. Here, the endogenous Cu2+ was exchanged for the faster relaxing Ni2+ and nitroxides were attached to the membrane or to the proteolipid itself. The relaxation enhancement was measured on T 1 by means of saturation transfer EPR (Marsh & Horvath, Reference Marsh, Horvath and Hoff1989). The found distances were in the range of 14–23 Å and do agree with a structural model. In 2004, a computational method to localize a slow relaxing spin buried in a protein was reported. The relaxation enhancement was induced by adding relaxation-enhancing agents like Dy3+ complexes to the solution (MacArthur & Brudvig, Reference MacArthur and Brudvig2004). Further examples concerning distance measurements to metal centers via relaxation enhancement or by other methods are summarized by Berliner et al. (Reference Berliner, Eaton and Eaton2000).
4.5 Multiple spin centers
As discussed in Section 2.3.2, PELDOR can not only be used to measure the distance between two spin centers, but also to count the number of interacting spin centers. This can, for example, be utilized to determine the number of monomers constituting aggregates of biomolecules as pioneered by Milov et al. in their work on the antibiotic trichogin GA IV, as described in the next section.
4.5.1 Trichogin GA IV
Trichogin GA IV is a peptide of fungal origin and belongs to the class of peptaibols. It is proposed that trichogin self-assembles in membranes to helix bundles and modifies thereby the surrounding membrane. To verify this hypothesis, one of the α-aminoisobutyric acid (Aib) residues in the trichogin helix was substituted by TOAC (Milov et al. Reference Milov, Tsvetkov, Formaggio, Crisma, Toniolo and Raap2000). The observation of clear oscillations demonstrated the formation of specific aggregates with fixed distances between the spin labels within a chloroform/toluene mixture. From the modulation depth V(T→∞) of 0·51±0·01 found for the aggregates and a λ of 0·2 calculated from a monomeric but doubly labeled trichogin, the average number of monomers within the aggregates was estimated to be 4·0±0·3. Together with molecular modeling this data were then used to construct a structural model for the trichogin helix bundles. Best agreement was achieved for bundles of four anti-parallel aligned helices with a 310-conformation. The hydrophilic amino side chains point to the inside of the bundle and the hydrophobic side chains extend to the exterior. Addition of ethanol to the solution led in each case to PELDOR time domain data, exhibiting only monoexponential decays without any oscillation, which was interpreted as dissociation of the helix bundles into their constituting monomers.
The 310-helix conformation was confirmed in a later paper (Milov et al. Reference Milov, Tsvetkov, Formaggio, Crisma, Toniolo and Raap2001) by mixing small amounts of doubly labeled trichogin with unlabeled trichogin. The observed oscillation with a period of 75 ns corresponds to an intra-trichogin distance of 15·7 Å, close to the expected distance of ∼14 Å for a 310-helix. The 27-helix found for a modified trichogin in chloroform/dimethylsulfoxide (see Section 3.1.1) is probably due to this particular solvent, as a comparative study with various solvent mixtures showed (Milov et al. Reference Milov, Tsvetkov, Formaggio, Oancea, Toniolo and Raap2004). PELDOR studies on trichogin covalently linked together to yield head-to-tail dimers revealed an α-helical structure in the chloroform/toluene mixture. This change from a 310-helical structure to an α-helical structure was attributed to the increased length of the peptides. Analysis of the PELDOR modulation depth found for the trichogin dimers indicate that two to three of them form a bundle, depending on the concentration (Milov et al. Reference Milov, Tsvetkov, Formaggio, Oancea, Toniolo and Raap2003).
Two recent studies of trichogin in multilamellar membranes (Milov et al. Reference Milov, Erilov, Salnikov, Tsvetkov, Formaggio, Toniolo and Raap2005) and phospholipid bilayers (Salnikov et al. Reference Salnikov, Erilov, Milov, Tsvetkov, Peggion, Formaggio, Toniolo, Raap and Dzuba2006) showed, however, that trichogin is monomeric at low peptide/lipid ratios but may dimerize at higher ratios. Under these biologically more relevant conditions, the conformation of the helix seems to be a mixture of α- and extended 310-helixes. The authors also studied the self-aggregation of the channel forming antibiotics alamethcitin (Milov et al. Reference Milov, Samoilova, Tsvetkov, Peggion, Formaggio, Toniolo and Raap2006) and zervamicin IIa (Milov et al. Reference Milov, Tsvetkov, Gorbunova, Mustaeva, Ovchinnikova and Raap2002) by PELDOR.
4.5.2 Other examples
In an EPR study on the Nha A Na+/H+ antiporter of E. coli in phospholipid membranes, PELDOR spectra without visible modulation, but clearly multi-exponential decay were interpreted as indication for the formation of specific dimers and small pH-induced changes were discussed (Hilger et al. Reference Hilger, Jung, Padan, Wegener, Vogel, Steinhoff and Jeschke2005). In the case of the von Willebrand Factor A, Tikhonov regularization yielded a distance of 61·5 Å and the authors claim evidence for a trimer which could not be shown unequivocally from the modulation depth (Banham et al. Reference Banham, Timmel, Abbott, Lea and Jeschke2006). The observation of only one distance was attributed to the formation of a symmetric trimer. Such a symmetric trimer is also found in the crystal structure and the distance between the spin labels modeled into the crystal structure is close to the experimental one.
PELDOR was also applied to analyze the three-spin systems Y D●–Q A−●–Y Z● and Chl Z+●–Q A−●–Y D● generated in PS II (Kawamori et al. Reference Kawamori, Katsuta and Hara2003). In both cases the number of coupled spins was not counted, but the oscillations of the PELDOR time traces were used to extract the three distances. In this way, the previously unknown Chl Z+●–Q A−● distance could be calculated to R=34 Å and the same distance was obtained for the Q A−●–Y Z● pair. The general problem of assigning the measured distances in a multi spin-center system to the actual spin partners might be circumvented by isotope labeling, as shown by Jeschke et al. on 14N, 15N-labeled bisnitroxide model systems (Jeschke et al. Reference Jeschke, Zimmermann and Godt2006).
5. Comparison of spectroscopic methods
5.1 Comparison of EPR methods
Dipolar oscillations can be observed with PELDOR, DQC-EPR, ‘2+1’, out-of-phase echo, and quantum-beat experiments and directly converted into distances. The requirement for the direct conversion is that the whole Pake pattern is observed or that the orientation-dependent term can be determined by orientation-dependent measurements. If the whole Pake pattern or at least both singularities are resolved, the isotropic exchange coupling constant J can be quantified and separated from ωdip. In this way distances of up to 80 Å are assessable. However, the following limitations have to be considered: The out-of-phase echo experiment can only be applied to photo-excited spin-correlated radical pairs, whereas the other methods can be used for distance measurements on stable or trapped radicals. ‘2+1’ has the disadvantage of strong hyperfine artifacts, which are strongly diminished in PELDOR and DQC-EPR, but the latter two techniques are technically more demanding.
A dipolar coupling for distances smaller than 10 Å is usually visible as a line splitting in continuous wave EPR spectra. Distances up to 20 Å induce dipolar line broadening from which distances can be extracted, but the analysis relies on lineshapes, which decreases the accuracy. Relaxation-based methods are also sensitive to the dipolar coupling strength but rely on the analysis of monotonic decays or lineshapes, which is intrinsically more susceptible to errors than oscillating patterns as obtained from methods with a coherent flip of the B spin. The advantage of relaxation methods and continuous wave EPR methods is that both can be applied to the liquid state at physiological temperatures, whereas pulsed methods usually require cryogenic temperatures to slow down relaxation processes. Furthermore, relaxation measurements may be the only way to extract distances between metal centers with broad spectral width and/or short relaxation times.
5.2 Comparison of EPR with FRET and NMR
FRET (Lakowicz, Reference Lakowicz2006) and EPR-based methods cover roughly the same distance range. But the following differences occur:
(1) If dipolar oscillations are observed, it is easier to translate these into a distance, than extracting a distance from differences in fluorescence intensities.
(2) If the whole Pake pattern is observed or if the orientation dependence is resolved, no assumptions about orientations have to be made, whereas the orientation factor κ is usually set to 2/3 in FRET.
(3) If the whole Pake pattern is observed, the two coupling mechanisms J and ωdip can be separated from one measurement. In FRET, different mechanisms leading to fluorescence quenching have to be carefully deconvoluted, using standard samples without acceptor, but under otherwise identical conditions or additional measurements. In this sense, FRET, is similar to relaxation-based EPR methods.
(4) The labels used in EPR are usually smaller and more rigid than the chromophores commonly used in FRET, leading to an easier correlation between measured distance and structure of the biomolecule.
On the other hand, FRET has several advantages:
(1) It is generally applicable in liquid solution at room temperature. EPR methods can also be applied to liquids, but then the precision is reduced.
(2) FRET signals can be measured on a single molecule level.
(3) FRET can be used to monitor motions in real time, whereas PELDOR and DQC-EPR demand freeze-quench techniques to get snapshots of the biomolecule in motion.
Several NMR methods exist to measure long-range distances. These are, for example, solid-state NMR methods like REDOR (Gullion & Schaefer, Reference Gullion and Schaefer1989; Gullion & Vega, Reference Gullion and Vega2005) or the recoupling of residual dipolar couplings in liquid-state NMR (Tolman et al. Reference Tolman, Flanagan, Kennedy and Prestegard1995; Tjandra et al. Reference Tjandra, Grzesiek and Bax1996) using alignment media as, for example, micelles. Yet, due to the smaller magnetic moment of the nuclei the distance range is limited to roughly 20 Å and for measurements in orienting media the order parameter S 2 has to be known. Liquid-state NMR-based paramagnetic relaxation enhancement (PRE) experiments allow to gather longer distances (Donaldson et al. Reference Donaldson, Skrynnikov, Choy, Muhandiram, Sarkar, Forman-Kay and Kay2001; Bonvin et al. Reference Bonvin, Boelens and Kaptein2005; Iwahara & Clore, Reference Iwahara and Clore2006), but the method is less quantitative (Sharp et al. Reference Sharp, Lohr and Miller2001). However, this is overcompensated by the simultaneous observation of several NMR signals allowing to collect numerous constraints in one spectrum. On the other hand, NMR is restricted with respect to the size of the biomolecules, whereas FRET and EPR are not. In summary, all these techniques are complementary to each other.
6. Conclusion and outlook
The combination of site-directed spin labeling and pulsed-EPR methods enable to routinely study large biomolecules like peptides, proteins, oligonucleotides, and complexes thereof either in solution or in membranes. It was shown that with some of these methods, distances can be obtained very precisely and parameter free up to 80 Å in frozen solution. Distances can also be obtained in the liquid state, but these results are less precise and restricted to shorter distances. For measurements in frozen solution, dynamics are not directly accessible, but several studies suggested that distance distributions in the frozen state may be correlated with dynamics in the liquid state. The orientation between spin centers can be resolved using high-field/high-frequency spectrometers or orienting media. Additionally, PELDOR can be used to count the number of monomers within an aggregate of biomolecules. To be able to assign the different distances in such aggregates to specific spin pairs, labels with separated resonance frequencies are needed.
It might also be valuable to think about synthesizing new types of spin labels with long relaxation times T 2 at room temperature, because it might allow the application of pulsed-EPR methods like PELDOR or DQC-EPR at room temperature in liquid solution. If this were achieved, movements of subunits or folding events could be followed down to microseconds in real time.
7. Acknowledgments
We are grateful to Dr Marina Bennati, Bela Bode, Charlotte Börner, Dr Burkhard Endeward, Dr Jörg Fritscher, Dr Melanie Hertel, Dr Sevdalina Lyubenova, Dominik Margraf, and Dr Jörn Plackmeyer for carefully reading the manuscript. We thank Dr Nelly Piton and Professor Joachim W. Engels as well as Dr Yuguang Mu and Professor Gerhard Stock for their cooperation on the RNA DNA projects and for providing Figs 12 and 13a, respectively, Dr Marina Bennati and Dr Vasyl Denysenkov, are thanked for donating Fig. 10, and Professor Hanno Käss and Professor Bernd Ludwig for contributing Fig. 14. We specially thank Bela Bode, Dominik Margraf, and Dr Jörn Plackmeyer for their work related to Fig. 4 and for preparing the figure itself. The financial support of the DFG (SFBs 579 and 472 and SPP 1051), the Biological Magnetic Resonance Center, and the state of Hesse is gratefully acknowledged.