


INTRODUCTION
Gene expression profiling is becoming an important tool to study pathogenesis of infectious diseases as it allows molecular characterization of the cellular responses of host and pathogen (Chaussabel et al. Reference Chaussabel, Semnani, McDowell, Sacks, Sher and Nutman2003; Hromatka et al. Reference Hromatka, Noble and Johnson2005; McAleese et al. Reference McAleese, Wu, Sieradzki, Dunman, Murphy, Projan and Tomasz2006). This type of study has become feasible since the introduction of 2 high-throughput expression profiling techniques: (i) microarrays, used for comparative analysis of thousands of genes in distinct RNA populations (Schena et al. Reference Schena, Shalon, Davis and Brown1995), and (ii) quantitative real-time PCR (Q-PCR), used for rapid simultaneous analysis of a specific set of genes in large sample collections (Heid et al. Reference Heid, Stevens, Livak and Williams1996; Vandesompele et al. Reference Vandesompele, De Preter, Pattyn, Poppe, Van Roy, De Paepe and Speleman2002). Both these techniques are rapidly gaining popularity in Leishmania studies since the Leishmania genome sequences have become available (Duncan, Reference Duncan2004; Ivens et al. Reference Ivens, Peacock, Worthey, Murphy, Aggarwal, Berriman, Sisk, Rajandream, Adlem, Aert, Anupama and Apostolou2005; Peacock et al. Reference Peacock, Seeger, Harris, Murphy, Ruiz, Quail, Peters, Adlem, Tivey, Aslett, Kerhornou and Ivens2007). However, the interpretation and standardization of gene expression studies in Leishmania might be more challenging in comparison to other eukaryotes due to the specific biology of this parasite.
Firstly, most protein-coding genes in Leishmania are transcribed polycistronically, and mature mRNA levels appear to be regulated primarily by post-transcriptional mechanisms such as mRNA stability (Boucher et al. Reference Boucher, Wu, Dumas, Dube, Sereno, Breton and Papadopoulou2002; Campbell et al. Reference Campbell, Thomas and Sturm2003; Clayton, Reference Clayton2002; Martinez-Calvillo et al. Reference Martinez-Calvillo, Nguyen, Stuart and Myler2004). Therefore, differences in mRNA abundance are often not as pronounced as in other organisms where expression is regulated at the level of transcription initiation (Saxena et al. Reference Saxena, Worthey, Yan, Leland, Stuart and Myler2003; Akopyants et al. Reference Akopyants, Matlib, Bukanova, Smeds, Brownstein, Stormo and Beverley2004; Almeida et al. Reference Almeida, Gilmartin, McCann, Norrish, Ivens, Lawson, Levick, Smith, Dyall, Vetrie, Freeman and Coulson2004; Duncan et al. Reference Duncan, Salotra, Goyal, Akopyants, Beverley and Nakhasi2004). The detection of such small differences is technically possible but demands sensitive and robust assays with strict measures to ensure reproducibility and quality control.
Secondly, Leishmania continuously changes life-form throughout its life-cycle (in the vector from non-infective procyclic to infective metacyclic promastigotes; intracellular amastigotes in the host). This process of differentiation is associated with variation in gene expression, which in turn seems to be triggered by the changing external environment of the parasite (Shapira et al. Reference Shapira, McEwen and Jaffe1988; Duncan et al. Reference Duncan, Alvarez, Jaffe, Wiese, Klutch, Shakarian, Dwyer and Nakhasi2001; Saxena et al. Reference Saxena, Lahav, Holland, Aggarwal, Anupama, Huang, Volpin, Myler and Zilberstein2007). The differentiation process can be mimicked in vitro by changing medium/environment. Promastigotes grow from early log phase (procyclic forms) to stationary phase (metacyclic forms) in response to nutrient depletion and acidification of culture medium over 7–8 days (Sacks, Reference Sacks1989; Bates and Tetley, Reference Bates and Tetley1993; Zakai et al. Reference Zakai, Chance and Bates1998). Intracellular amastigotes initiate transformation to promastigotes within 1 h after release from the host cell (Fong and Chang, Reference Fong and Chang1981). Previous studies have proven that gene expression/protein profiles vary considerably during the above-described in vitro differentiation (Akopyants et al. Reference Akopyants, Matlib, Bukanova, Smeds, Brownstein, Stormo and Beverley2004; Holzer et al. Reference Holzer, McMaster and Forney2006; McNicoll et al. Reference McNicoll, Drummelsmith, Muller, Madore, Boilard, Ouellette and Papadopoulou2006; Cohen-Freue et al. Reference Cohen-Freue, Holzer, Forney and McMaster2007; Saxena et al. Reference Saxena, Lahav, Holland, Aggarwal, Anupama, Huang, Volpin, Myler and Zilberstein2007). Consequently, when comparing different Leishmania strains using gene expression profiles, it is of major importance to ensure that the studied parasites from the various strains (i) are in a similar in vitro differentiation stage and (ii) are obtained with in vitro manipulation techniques involving minimal disturbance of the parasite's environment to minimize impact on expression profile.
In this study we specifically wanted to explore the possibilities, requirements and limitations of gene expression profiling when used for molecular comparison of multiple Leishmania isolates from patients. We verified the impact of changing biological (differentiation stage) and technical (in vitro manipulation methods) parameters on expression levels of genes encoding for proteins with diverse functions. The results could be translated into guidelines for design of reliable comparative gene expression assays useful for high-throughput characterization of patient's isolates. Furthermore, this study also highlights some issues that might help the interpretation and comparison of other studies on Leishmania gene expression.
MATERIALS AND METHODS
Parasites
The L. (L.) donovani isolates BPK206/0, BPK091/0, BPK087/0, and BPK190/0 were obtained from bone-marrow aspirates from confirmed visceral leishmaniasis patients recruited at the B.P. Koirala Institute of Health Sciences, Dharan, Nepal. Leishmania species identification was done by PCR-RFLP analysis of cysteine proteinase B as reported elsewhere (Tintaya et al. Reference Tintaya, Ying, Dedet, Rijal, De Bolle and Dujardin2004). The uncloned isolates were tested as intracellular amastigotes for their in vitro antimonial susceptibility within 8 in vitro passages after isolation from patients, as described before (Rijal et al. Reference Rijal, Yardley, Chappuis, Decuypere, Khanal, Singh, Boelaert, De Doncker, Croft and Dujardin2007). Isolates BPK206/0 and BPK091/0 were characterized as SbV sensitive, and BPK087/0 and BPK190/0 as SbV resistant. These isolates were used here for gene expression analysis within a maximum of 15 in vitro passages after isolation from patients.
In vitro promastigote generation
Two protocols were used in this study for the generation of promastigotes. (1) Rapid growth on blood agar. Promastigotes were grown in Tobie's blood agar medium (Tobie et al. Reference Tobie, Von Brand and Mehlman1950) with a saline overlay at 26°C. This rich medium supports promastigote growth and differentiation from procyclic to metacyclic stage in 3–4 days. The resulting cultures were harvested when the stationary phase was reached as determined by microscopical evaluation of morphology and parasite density. The overlay of the resulting culture was removed and washed 3 times with PBS to remove contaminating material originating from the blood agar. (2) Controlled growth on Eagle's medium. Promastigotes were grown on modified Eagle's medium (Mottram et al. Reference Mottram, Robertson, Coombs and Barry1992) (Invitrogen) supplemented with 20% (v/v) heat-inactivated foetal calf serum (PAA Laboratories GmbH), pH 7·5, at 26°C over 7–8 days. The cultures were initiated by inoculating metacyclic parasites (at day 3–4 stationary phase) in 5 ml of culture medium at a final concentration of 5×10⁵ parasites/ml. The parasite density was determined every 24 h using disposable count chambers Uriglass (Menarini diagnostics) to follow up the growth and differentiation profile. Parasites were harvested at different time-points of the growth curves (specific time-points per experiment are specified in the text) by centrifugation and the resulting pellet was washed once with PBS. An identical batch of culture medium and foetal calf serum was used for all promastigote cultures in this study, to minimize variation in culture conditions.
In vitro intracellular amastigote generation
Murine peritoneal macrophages were infected with promastigotes at the third day stationary phase (as determined by the concomitant growth curve, see above ‘controlled growth Eagle's medium’) at a ratio of 7 promastigotes to 1 macrophage as described elsewhere (Decuypere et al. Reference Decuypere, Rijal, Yardley, De Doncker, Laurent, Khanal, Chappuis and Dujardin2005); for all experiments, >80% of macrophages were infected at 24 h. The harvest of the in vitro-generated amastigotes was done at several time-points post-infection according to one of the following 2 protocols. (1) Purification of amastigotes by SDS lysis of macrophages. The adherent, infected macrophages were washed with ice-cold PBS to remove extracellular promastigotes. Three ml of 0·0125% SDS/PBS were added to each 25 cm2 culture flask, and gently agitated until macrophages lifted and started to disintegrate. After dilution with PBS and mixing, the contents of each flask were aspirated through a 25G needle, causing further shearing of the macrophages, and transferred to a 50 ml tube for centrifugation and 2 washing steps in PBS to remove macrophage debris. (2) Co-harvest of amastigotes/macrophages. The adherent, infected macrophages were washed with RPMI 1640 (pre-heated to 37°C) to remove residual promastigote debris. The infected macrophages were subsequently dissociated from the culture vessels by treatment with TrypLE Select (Invitrogen) for 9 min at 37°C as recommended by the manufacturer. The resulting cell suspension was immediately diluted 15 times with either RPMI 1640 or the buffer PSGEMKA (specified per experiment in the text). The buffer PSGEMKA was described to stall transformation of free amastigotes to promastigotes (Hart et al. Reference Hart, Vickerman and Coombs1981). The surface of the culture flask was carefully scraped with a cell scraper to lift loosely attached macrophages. The resulting suspension was transferred to a 50 ml tube for centrifugation and washed once using the same buffer as in the previous step. The whole procedure was carefully timed and finished in 30–35 min.
RNA isolation/analysis and real-time quantitative PCR
After the last washing step all harvested cultures were immediately disrupted in RNAqueous Lysis/Binding solution (Ambion) and frozen at −80°C until RNA extraction. Total RNA was extracted, treated and analysed as described before (Decuypere et al. Reference Decuypere, Rijal, Yardley, De Doncker, Laurent, Khanal, Chappuis and Dujardin2005). Reverse transcription of total RNA and expression profiling of the genes listed in Table 1 were performed as described elsewhere (Decuypere et al. Reference Decuypere, Rijal, Yardley, De Doncker, Laurent, Khanal, Chappuis and Dujardin2005). All primers specifically amplify Leishmania cDNA as confirmed by quantitative assays on artificial Leishmania:macrophage cDNA mixtures with variable ratios between 1:1 and 1:30. Normalization of gene expression was done by determining the 4 most stable expressed genes from the set of 13 tested genes (Table 1), as described elsewhere (Vandesompele et al. Reference Vandesompele, De Preter, Pattyn, Poppe, Van Roy, De Paepe and Speleman2002). Multiple Q-PCR runs of one particular experiment were calibrated (based on 3 samples included in each run for that purpose), organized and processed using qBase, a VBA application for MS Excel designed for the management and automated analysis of real-time quantitative PCR data (Hellemans et al. Reference Hellemans, Mortier, De Paepe, Speleman and Vandesompele2007). Quantitative data of independent experiments were compared by determining the expression variation measure as described below.
Table 1. Overview primer design and PCR conditions for quantitative PCR
a=all primers were Leishmania specific; b=GenBank annotation, all other sequence no. as annotated in L. (L.) infantum GeneDB.
Definition expression variation measure (EVM) and technical variation threshold (TVT)
The expression variation measure (EVM) assesses a sample's variation in gene expression levels between repeated independent experiments. The mathematical background of EVM is outlined below.
If for 2 samples A and B, the relative expression level of a particular gene G is determined in 2 independent experiments X and Y, then the results of the two experiments can only be compared indirectly by considering the ratios:
The difference between these two ratios indicates that gene G expression levels varied between the two experiments, either in one sample, or in both samples to a different degree. The more the two ratios differ, or, expressed in mathematical terms, the higher the value of the expression
the more gene G expression levels varied between the independent experiments for samples A/B.
Interpolation in function (1) of all ‘gene G’-ratios involving (i) sample A and (ii) every other sample included in experiments X and Y results in a function that summarizes sample A's individual inter-experimental variation in gene G expression level. For sample A (of N samples in experiments X and Y), this function is mathematically represented by the array:
The average of this array was defined in this study as the EVM of sample A for gene G between experiment X and Y.
Part of a sample's inter-experimental variation comprised in EVM will be caused by technical variation between the experiments. This technical variation depends on RT, PCR efficiency, PCR sensitivity, etc and is thus characteristic for each particular gene expression assay. The technical variation for each gene expression assay was assessed here by testing 8 samples in 4 technical repeated (=using identical RNA source) experiments. The average of the resulting 8 EVMs/gene reflects the inter-experimental technical variation for each gene expression assay. Or, extrapolating according to the Gaussian distribution, 95% of technically repeated samples would have an EVM smaller than:
which was here defined as technical variation threshold (TVT) of the expression assay of gene G.
Interpretation EVM and TVT
If EVM of sample A for gene G is lower than TVT of the expression assay for that gene G, the observed variation in expression level between experiments does not exceed the expected technical variation, and it is likely that sample A did not vary on the biological level for gene G expression between the independent experiments.
If EVM of sample A for gene G is higher than TVT of the expression assay for that gene G, the observed variation in expression level between experiments is higher than expected by technical variation, and it is likely that sample A varied on the biological level for gene G expression between the independent experiments.
We must emphasize, however, that EVM/TVT is a rough estimation of the biological expression variation in repeated independent experiments. As, first of all, TVT is only based on a limited number (4) of technical repeats and thus only an approximation of the actual technical variation of a gene expression assay; secondly, an EVM below TVT is no guarantee that there was only technical variation; as the biological variation between 2 particular experiments could be lower than TVT as well; and thirdly, EVM does not take into account the variability of the normalization factor, which, characteristic for it's stable nature, is minimal and constant through all samples.
RESULTS
Exploring the limitations of Leishmania gene expression profiling: influence of cultivation and harvesting protocols
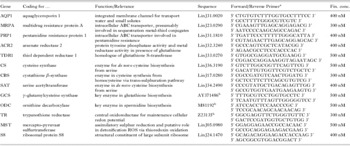
The first aim of this study was to explore the impact of variable in vitro manipulation techniques on gene expression in both promastigotes and amastigotes. We therefore performed 2 independent experiments for expression profiling of 8 genes in promastigotes and amastigotes of 4 L. (L.) donovani strains. The 2 experiments, referred to as Experiments A and B, differed in protocols for parasite culturing and harvesting (details are listed in Fig. 1A). The 8 ‘target’ genes encode proteins with different functions (Table 1), including (i) transport (AQP1, MRPA), (ii) redox metabolism (GCS, ODC, TR), (iii) cellular reduction (TDR1, ACR2) and (iv) ribosomal function (S8). This allowed us to verify if various cellular functions are affected to different extents at gene expression level by varying experimental conditions.
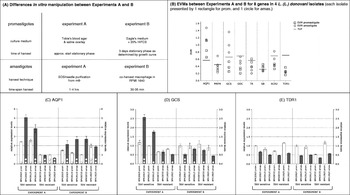
Fig. 1. Summary of gene expression analysis of Leishmania (L.) donovani promastigotes and intracellular amastigotes using different in vitro manipulation techniques. (C–D) Comparison expression levels (±s.d.) of the same strains (promastigotes=white bars, amastigotes=grey bars) in independent Experiments A and B; white buttons inside bars indicate sample's EVM, with 1 button=>than TVT but <than 2× TVT; 2 buttons=⩾2× TVT; expression levels/gene rescaled to the respective sample with lowest EVM between Exp. A and Exp. B.
We introduced the expression variation measure (EVM) and technical variation threshold (TVT) to assess a sample's inter-experimental biological variation at the level of gene expression (see the Materials and Methods section). The EVMs of all samples based on the expression levels obtained in Experiments A and B are graphically depicted in Fig. 1B. Firstly, the graph clearly indicates that there was biological variation between the two experiments; with EVMs higher than TVT for several amastigote and promastigote samples. Secondly, the biological variation affected the expression of the various genes to a different extent, exemplified by the profiles of AQP1, GCS and TDR1. (i) For AQP1, the expression levels of all amastigote and promastigote samples showed biological variation between the two experiments (all EVMs>TVT). The actual AQP1 expression profiles of the 4 isolates (promastigotes and amastigotes) obtained in Experiments A and B are depicted in Fig. 1C and demonstrate the extent of differences between the two experiments. (ii) The expression profiles of GCS showed a similar problem, but only on the level of amastigotes (all amastigote EVMs>TVT); promastigote results were similar in both experiments (all promastigote EVMs <TVT). Fig. 1D graphically illustrates the similar promastigote and dissimilar amastigote GCS expression profiles of Experiments A and B. (iii) In contrast, the expression of gene TDR1 in both promastigotes and amastigotes was not affected by the variation between the two experiments, resulting in similar expression profiles (all EVMs <TVT; Fig. 1E).
Identifying biological and technical sources of variation gene expression in Leishmania
Intracellular amastigotes
We further focused on optimization and standardization of the simple and rapid harvest method used in Experiment B, a protocol which also seems favourable from a biological point of view (minimal disturbance of intracellular parasite environment). We verified the influence of the following 3 parameters on expression of 13 genes (Table 1) in L. (L.) donovani in vitro infected in peritoneal macrophages. (i) Time post-infection macrophages (24 h, 48 h, 72 h, 120 h). Upon infection of macrophages, metacyclic promastigotes gradually transform into amastigotes; the rate of this differentiation (and adjusting gene expression) possibly varies between strains. We followed the biological changes in gene expression during the first 120 h post-infection (all harvests in PSGEMKA). (ii) Buffer used during harvest (RPMI 1640 or PSGEMKA). Manipulation of infected macrophages inevitably involves some shearing, which results in release of amastigotes (observed by microscopy). The buffer used during harvest could influence gene expression of those released amastigotes and perhaps of the intracellular amastigotes too. We compared 2 buffers in parallel harvests at 48 h post-infection: RPMI 1640, which is the basis of the medium (commercially available) used for macrophage cultures, and PSGEMKA (home-made) which was reported to preserve the biological status of amastigotes (Hart et al. Reference Hart, Vickerman and Coombs1981). (iii) Harvest time-span: the procedure is normally finished in 30–35 min; but variation in manipulation time might affect expression profiles. We verified the influence of harvest time-span by comparing expression profiles of 2 parallel harvests at 48 h post-infection including one ‘short’ harvest (the normal 30–35 min) and and ‘long’ harvest (normal harvest with additional 45 min incubation at 4°C). This comparison was done for both buffer systems.
All conditions were tested on a single large-scale infection (2 flasks/condition), thus ensuring uniform quality of in vitro infections in the various tested conditions. This experiment was performed in 2 strains, BPK206/0 (SbV sensitive) and BPK190/0 (SbV resistant), and the comparative expression profiles were determined in 1 quantitative experiment. As expected, the different parameters influenced the expression of the 13 genes to a variable extent. (i) Nine out of 13 genes showed a variable expression at the different biological time-points and (ii) 6 out of 13 genes had variable expression levels at 48 h post-infection when either different buffers or different harvest time-spans were used. Overall, we identified 3 types of profiles that are represented by AQP1, GCS and TDR1 (Fig. 2). (i) AQP1 expression was found to be very unstable, which agrees with the results discussed in the previous section. The expression levels of BPK190/0 differed significantly between the different biological time-points (24–120 h post-infection) and between the different technical conditions (PSGEMKA vs RPMI 1640, two harvest time-spans, see Fig. 2A). We could not even reproduce the AQP1 expression profile of BPK190/0 in 2 biologically repeated harvests with identical conditions (data not shown). (ii) The profile of GCS also showed considerable variation at the different biological time-points, particularly for BPK190/0; but all the technical conditions tested at 48 h post-infection gave reproducible results (Fig. 2B).
(iii) The expression of TDR1 was similar at all biological time-points and was not affected by varying technical parameters, which tallies with the results of the previous section (Fig. 2C).
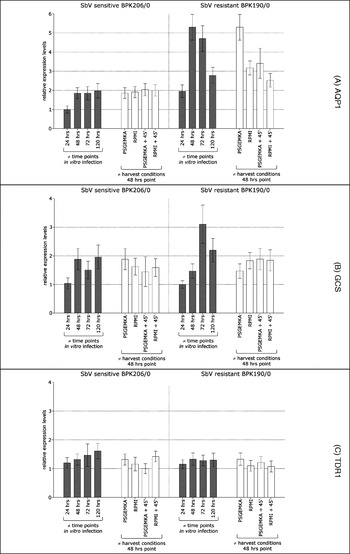
Fig. 2. Summary of expression profiling of Leishmania (L.) donovani intracellular amastigotes of the isolates BPK206/0 (SbV sensitive) and BPK190/0 (SbV resistant). Relative gene expression levels determined in variable biological conditions (≠ time-points of in vitro macrophage infections, grey bars) and using variable techniques (≠ harvest conditions at time point 48 h, white bars). A single large-scale macrophage infection with each isolate was used to test all conditions shown; expression levels were rescaled/gene versus sample with lowest expression, error bars=s.d.
Furthermore, the variability of expression for different biological and technical conditions seems to be strain dependent. Fig. 2 shows a contrasting picture of a ‘stable’ BPK206/0 profile versus a ‘variable’ BPK190/0 profile. This difference in stability of gene expression levels might reflect a difference in cellular flexibility. BPK190/0 and BPK206/0 are genetically closely related (Laurent et al. Reference Laurent, Rijal, Yardley, Croft, De Doncker, Decuypere, Khanal, Singh, Schonian, Kuhls, Chappuis and Dujardin2007), but differ in many phenotypic aspects, including in vitro SbV and SbIII susceptibility (Rijal et al. Reference Rijal, Yardley, Chappuis, Decuypere, Khanal, Singh, Boelaert, De Doncker, Croft and Dujardin2007), which could indeed be linked to differential cellular response ability. This inter-strain variation highlights the importance of choosing representative reference strains when standardizing such protocols.
Promastigotes
The first section demonstrated that the expression profiles of promastigotes also varied between Experiments A and B (Fig. 1). We suspected that these differences were due to unsynchronized harvesting during the gradual differentiation process of cultured promastigotes. Consequently, we chose the protocol ‘controlled growth on Eagle's medium’ (see the Materials and Methods section) for further standardization of promastigote expression profiling. Promastigotes were harvested every 24 h for 8 days for the 2 strains BPK206/0 and BPK190/0. The expression profiles of 13 genes (Table 1) were determined for all time-points in 1 quantitative experiment (see Supplemental material with Online version of paper). The in vitro differentiation process of the promastigotes could be synchronized for the two strains based on the concomitantly determined growth curve. The first day of stationary phase served as a reference point and was arbitrarily designated as time-point 0 h. The matching expression profiles of the 24-hourly harvests could then be translated into synchronized ‘expression-curves’. These expression-curves reflect the gene expression variation during differentiation over 8 days, and the type of profiles obtained for the 13 genes are once more exemplified by AQP1, GCS and TDR1. (i) Expression of AQP1 was relatively stable during the multiplicative phase, but rose sharply during the stationary phase with ±3-fold difference between first (0 h) and second (24 h) day (Fig. 3A). This finding explains the variation between Experiments A and B, which both investigated stationary phase promastigotes in the absence of synchronization. (ii) The profile of GCS was similar to AQP1, but the expression increase was much less pronounced (±1·5-fold difference between 0 and 24 h) (Fig. 3B). (iii) The last gene, TDR1, showed little variation over the whole promastigote differentiation process (Fig. 3C), this is also in agreement with Experiment A/B.
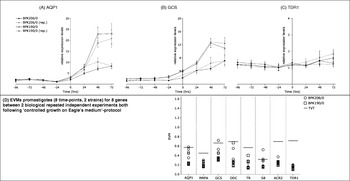
Fig. 3. Summary of expression profiling of Leishmania (L.) donovani promastigotes of the isolates BPK206/0 (SbV sensitive) and BPK190/0 (SbV resistant). (A–C) Expression-curves reflecting biological variation in gene expression throughout in vitro promastigote differentiation; full lines and dotted lines (rep.) represent 2 biological repeated independent experiments. Total time-scale of 8 days with 0 h=1st day stationary phase according to concomitant growth curve; all expression levels/gene were rescaled versus sample with lowest expression in the respective experiment, error bars=s.d.
Just as with amastigotes, the degree of biological variation of expression during in vitro differentiation varies between different strains; this is clearly shown by the significant difference between BPK190/0 and BPK206/0 for AQP1.
The expression-curves of the 2 strains could be reproduced in a biological repeated experiment (dotted curves in Fig. 3A–C), even for AQP1. The 2 repeated independent experiments were scrutinized for inter-experimental biological variation by determining the EVM for 128 samples (8 time-points×2 strains×8 genes), analogous to experiment A/B. We only identified 2 out of 128 samples with an EVM>TVT (versus 7/32 for promastigotes Experiment A/B) and there were no indications of consistent variation problems in any of the 8 genes (Fig. 3D).
DISCUSSION
Biochemical and molecular characterization of intracellular amastigotes has always been delicate, as purification of amastigotes from macrophages is usually required. Different methods of amastigote purification were reported in the past (Hart et al. Reference Hart, Vickerman and Coombs1981; Monjour et al. Reference Monjour, Vouldoukis, Brandicourt, Mazier, Alfred, Ploton and Gentilini1984; Pham and Mauel, Reference Pham and Mauel1987), but all involve long procedures (>1 h) and expose the amastigotes to chemical or physical strain. Hence, these techniques might influence the biological status (including gene expression profiles) of freed amastigotes as it is well-established that changes in environment rapidly (<1 h) trigger transformation to promastigotes (Fong and Chang, Reference Fong and Chang1981; Duncan et al. Reference Duncan, Alvarez, Jaffe, Wiese, Klutch, Shakarian, Dwyer and Nakhasi2001; Barak et al. Reference Barak, Amin-Spector, Gerliak, Goyard, Holland and Zilberstein2005).
In this study, we used gene expression profiling for molecular characterization of intracellular amastigotes and introduced a new harvest-technique that omits the purification step (co-harvest amastigotes and macrophages). It was demonstrated, that even in the absence of amastigote purification, other technical parameters of the harvest procedure (e.g. type of buffer, time-span harvest) can still affect the expression profiles of co-harvested intracellular amastigotes (observed for 6 out of 13 tested genes). This was clearly exemplified by the unstable expression profile of the gene AQP1, which encodes a membrane channel thought to be involved in regulation of osmotic stress (Beitz, Reference Beitz2005). Possibly the expression profile of AQP1 continuously adjusts during in vitro manipulations in response to minor changes in medium/buffer, temperature, pH, etc. Such a ‘sensory’ regulation could impede reproducible AQP1 expression profiling of amastigotes regardless of the technique applied for harvest.
We also established that expression profiles of in vitro generated intracellular amastigotes fluctuate significantly during the first 120 h post-infection (observed for 9 out of 13 genes). We suspect that this expression variation is, at least in part, associated with the ongoing transformation from promastigotes to amastigotes in those 5 days post-infection. A recent study on L. (L.) donovani reported similar findings during the transformation of promastigotes to axenic amastigotes (Saxena et al. Reference Saxena, Lahav, Holland, Aggarwal, Anupama, Huang, Volpin, Myler and Zilberstein2007). The rate of this transformation process could vary between different isolates, thus there is no guarantee that various isolates reach identical transformation stages at any particular time-point in the first 120 h post-infection. A reliable molecular comparison of intracellular amastigotes should compare identical developmental stages and it seems therefore advisable to compare multiple time-points (in the form of expression-curves, as done here for promastigotes) in stead of 1 time-point.
These findings imply that comparison of results of various Leishmania amastigote gene expression studies needs to be done with extreme care if the studies use different in vitro manipulation protocols. For example, our previous molecular report on L. (L.) donovani SbV resistance was based on Experiment A and suggested that reduced expression of AQP1 and GCS in amastigotes was possibly a specific feature of SbV-resistant isolates (Exp. A, Fig. 1) (Decuypere et al. Reference Decuypere, Rijal, Yardley, De Doncker, Laurent, Khanal, Chappuis and Dujardin2005). However, now we obtained different results in the independent Experiment B, which differed in in vitro manipulation protocol. We could argue that the results could not be reproduced due to changes in the isolates (uncloned material) possibly introduced during culturing between Experiments A and B. However, in this particular example, it seems more likely that the amastigote purification step present in Experiment A but absent in Experiment B, is (partly) responsible for the differences in amastigote expression profiles between Experiments A and B.
Characterization of promastigotes is less challenging; these extracellular parasites can easily be cultured and harvested with minimal risk of affecting their biological status. Gene expression profiles could be reproduced with the experimental procedures used here. However, as in the amastigote model, expression levels may vary throughout the in vitro differentiation from procyclic to metacyclic form (observed for 9 out of 13 tested genes). Changing gene expression profiles during promastigote differentiation has been reported before and this phenomenon is believed to be part of the molecular changes that take place to pre-adapt the parasite for transmission and survival in the vertebrate host (Sacks, Reference Sacks1989; Saxena et al. Reference Saxena, Worthey, Yan, Leland, Stuart and Myler2003; Akopyants et al. Reference Akopyants, Matlib, Bukanova, Smeds, Brownstein, Stormo and Beverley2004; Almeida et al. Reference Almeida, Gilmartin, McCann, Norrish, Ivens, Lawson, Levick, Smith, Dyall, Vetrie, Freeman and Coulson2004; Cohen-Freue et al. Reference Cohen-Freue, Holzer, Forney and McMaster2007). The in vitro differentiation rates of recently isolated parasites can differ significantly (unpublished observations), and thus it seems advisable to study expression-curves rather than single-point measurements. Expression-curves also confer the robustness required for expression profiling Leishmania, where, as discussed before, differences in expression level are often much lower than in other eukaryotes (Akopyants et al. Reference Akopyants, Matlib, Bukanova, Smeds, Brownstein, Stormo and Beverley2004; Almeida et al. Reference Almeida, Gilmartin, McCann, Norrish, Ivens, Lawson, Levick, Smith, Dyall, Vetrie, Freeman and Coulson2004; Duncan, Reference Duncan2004). While one particular measurement may not be significantly different between different strains; the picture of multiple measurements can reveal a significant differential expression regulation as is seen with the genes AQP1 and GCS for the 2 strains studied here.
Gene expression studies on promastigotes cannot replace expression studies on intracellular amastigotes, as the latter provides unique information on the clinical relevant form of the parasite at the time of interaction with the host-cell. However, promastigote expression-curves can provide complementary information on the cell biological flexibility of the parasite. More specifically, the promastigote expression-curves capture the degree of mRNA abundance regulation during in vitro differentiation in a standardized environment and as such reflect the characteristic adaptive capacity of an isolate. The expression-curves of the two isolates tested here suggest that different isolates can present with a differential degree of regulation (adaptive capacity) which in turn might be linked to differential phenotypes.
In their natural context, Leishmania are characterized by a tremendous phenotypic diversity regarding vector-specificity, virulence, drug susceptibility etc. This diversity contrasts with the relative structural conservation of Leishmania genomes (Peacock et al. Reference Peacock, Seeger, Harris, Murphy, Ruiz, Quail, Peters, Adlem, Tivey, Aslett, Kerhornou and Ivens2007). Possibly, Leishmania's natural phenotypic diversity lies in differential features downstream of the genome, in the transcriptome or in the proteome. Consequently, gene expression profiling could play an essential role in the characterization of phenotypic distinct Leishmania isolates. This study demonstrated that highly standardized methods are required for reliable comparative analyses. We believe it is particularly essential to adopt methods that conserve the environment of the parasite and take into account the fluctuation of gene expression levels during the life-cycle of the parasite. Following these guidelines, a profiling assay was developed for promastigotes, but further studies are still required to achieve a similar highly standardized method for intracellular amastigotes.
This work was supported by the Fifth Framework Programme of the European Commission Community Research (INCO-DEV contract LeishNatDrug-R – ICA-CT-2001-10076), the Sixth Framework Programme of the European Commission Community Research (INCO-DEV contract LeishEpiNet – INCO-CT2005-015407 and Marie Curie IEF contract DonNA-R – 041465) and the Research Foundation Flanders (FWO) (project 6.0103.06). We thank Gareth Westrop for critically reading this manuscript.


