


Introduction
The word “disaster” is well-accepted and internationally defined as the inability to cope within local capacity, as by the United Nations International Strategy for Disaster Reduction (UNISDR; Geneva, Switzerland) 2009. 1 An agreed terminology to quantify a “disaster” in practice matters, as inconsistency in measuring it by humanitarian stakeholders poses a challenge globally in formulating legislation and policies capable of responding to it. The Office of US Foreign Disaster Assistance (OFDA; Washington, DC USA) 2 and the Centre for Research on Epidemiology of Disasters (CRED; Brussels, Belgium)Reference Guha-Sapir, Below and Hoyois 3 concluded that the trend of natural disasters impacting humanitarian needs has been increasing significantly for the last half-century. 4
The Richter Scale 5 measures the magnitude of the seismic activity; however, it does not measure the aftermath impact on the humanitarian needs. The Modified Mercalli Intensities Scale 6 specifically measures the effects of earthquakes in terms of people response, buildings structure, and natural environment. Both scales 5 , 6 were used by the US Geological Survey 7 to give a joint measure comparison of earthquake impact in magnitude and intensities, observed at the actual site. Other natural disasters such as volcano eruptions, tropical cyclones, floods, droughts, and forest fires were measured in other scientific terms of magnitude, such as wind velocity in the Beaufort Wind Scale, 8 but they do not measure or estimate the true humanitarian severityReference Benini 9 at the impact site.
John Hopkins University (Baltimore, Maryland USA) and the International Federation of Red Cross and Red Crescent (Geneva, Switzerland) 10 have also argued that there is no single measurement that is able to project the full scope of a disaster. The Medical Severity Index,Reference Boer 11 the Fatality Based Natural Disaster Scale,Reference Wirasinghe, Caldera, Durage and Ruwanpura 12 and the Munich Reinsurance (MunichRE; Munich, Germany) 13 damaged or loss was created to formulate the impact of a disaster definition.
Currently, there are no existing frameworks or tools integrating all aspects of humanitarian needs, holistically and objectively, in quantifying various natural disasters. The World Risk IndexReference Welle and Birkmann 14 analyzed the risk of natural disasters in 176 countries. Whereas the Assessment Capacities Project (ACAP) Rapid Needs AssessmentReference Benini 9 measures the severity and priority-ranking needs of sudden onset disasters. Bayram, et alReference Bayram, Kysia and Kirsch 15 proposed a quantitative, complex emergencies assessment tool, the Public Health Impact Severity Scale, using SPHERE (Geneva, Switzerland) minimum standards 16 with data extracted from natural disasters to construct the scale.
P. Arcos González, et alReference Arcos González, Castro Delgado, Mahabir and Ferrero Fernández 17 have also tested the feasibility of applying Jan De Boer’s Disaster Severity Score in the case of Spain to quantify consequences of man-made and natural disasters. However, the result was not generalizable to natural disasters. The latest tool for Severity Scoring Model of Complex Emergencies by Eriksson, et alReference Eriksson, Ohlsén, Garfield and von Schreeb 18 was developed by using Maslow’s Hierarchy of Needs.Reference Maslow 19 Nevertheless, the tool was not tested in any complex emergencies.
The aim of this quantitative research project, the Yew Disaster Severity Index (DSI), is to produce one single analytical tool that will encompass all the existing partial definitions, tools, and other indicators of disaster that will more closely represent the true scale of the humanitarian needs in a holistic and objective way. This scale can then to be used as a guide for planning, preparedness, and response design by humanitarian stakeholders.
Methods
Study Preconditions and Assumptions
Hazards 4 are extreme phenomena consisting of vulnerability 1 combined with exposure, 1 , 10 whereby they can only become a disaster 1 upon impacting human lives and livelihood, combined with the inability to cope within local capacity. The severity of the disaster in this new tool is defined as the level of unmet needs.Reference Benini 9
Natural disasters,Reference Guha-Sapir, Below and Hoyois 20 mainly hydrological, meteorological, climatological, geophysical, and extra-terrestrial, were included in this study. Biological natural disasters were excluded from this study due to distinct characteristics and behavior.
DSI Concept and Model Framework
The Yew DSI is a simple, quantitative arithmetic approach with the aim of measuring various magnitude of natural disasters impacting humanitarian needs at the point of disaster, simultaneously. This tool combined the arithmetic approach and actual aftermath effect observed at the disaster impact site, which has some similarity to the Mercalli Modified Intensities Scale. 6
The Yew DSI Framework is based on the pre-existing “The Penny On-Trust”Reference Dewhurst 21 working model that compares various humanitarian projects’ needs objectively, with the approval from the organization.
The Yew DSI was developed in five phases, summarized chronologically as:
1. Search of datasets, internet sources, and documents;
2. Selection of indicators;
3. Construction of the model;
4. Computing 30 natural disaster DSI scores; and
5. Testing the correlation of the 30 DSI scores versus the model.
Search of Datasets, Internet Sources, and Documents
Searches were done in recognized disaster databases, mainly: ReliefWeb (UN Office for the Coordination of Humanitarian Affairs; Geneva, Switzerland/New York City, New York USA); 22 CRED- Emergency Events Database (EMDAT);Reference Guha-Sapir, Below and Hoyois 3 Google Scholar (Google LLC.; Mountain View, California USA); 23 Medline (US National Library of Medicine, National Institutes of Health; Bethesda, Maryland USA); 24 and ResearchGate (Berlin, Germany). 25 Searches were limited to English only sources. Keywords used in the search were: Disaster Severity Score, Natural Disaster, Hazard, Vulnerability, and Exposure, and in combinations thereof. No time limit was considered for the search criteria. Biological natural disasters (such as pandemics or epidemics) were outside the scope of the proposed model and were excluded. A document search was done in various collections of peer-reviewed and gray literature.
Gray literature found included conference proceedings and training materials from governmental agencies. Physical document searches were done in libraries with only three relevant books and one peer-reviewed journal found. Most of the peer-reviewed journals were not found in the libraries document physical search.
Selection of Indicators
In the new Yew DSI, indicators were selected based on criteria of being feasibly practical in the field, recognized, and easily available to be computed within hours after the disaster. Indicators of vulnerability and exposure were selected to formulate the UNISDR disaster 1 definition, the inability to cope within local capacity impacting lives, exposure indicators, and livelihoods, which include various vulnerability indicators. Indicator selection was also based on a holistic humanitarian needs approach, mainly Maslow’s Hierarchy of Needs,Reference Maslow 19 Humanitarian SPHERE Standards, 16 and the Global Assessment Report on Disaster Risk Reduction 2011. 26
Recognized and easily available indicators are defined as known databases such as CRED-EMDAT,Reference Guha-Sapir, Below and Hoyois 3 UNISDR, 27 United Nations Office for Coordination in Humanitarian Affairs (UNOCHA; Geneva, Switzerland/New York City, New York USA), 28 and Reliefweb, 22 as well as data collected locally by responsible representative such as the mayor of the town, village headman, health care worker, or police.
Two recognized exposure indicatorsReference Garfield 29 and 15 vulnerability indicators were identified, further filtered, and selected based on ranking of availability and evidence of best practice from expert opinions.
The final total of 17 vulnerability and exposure indicators which were selected were: Time Occurrence; Impact Time; Topography; Radius from the Impact Site; Accessibility to the Impact Site; Population Density; Main Source of Economy at the Impact Site; Public Infrastructure (Critical Facilities); Communication; Type of Country; Governance (Corruption Perception Index); Water and Sanitation Hygiene; Food Security; Shelter; Health Care Capacity; Number of Deaths; and Number of Affected Persons (Figure 1).
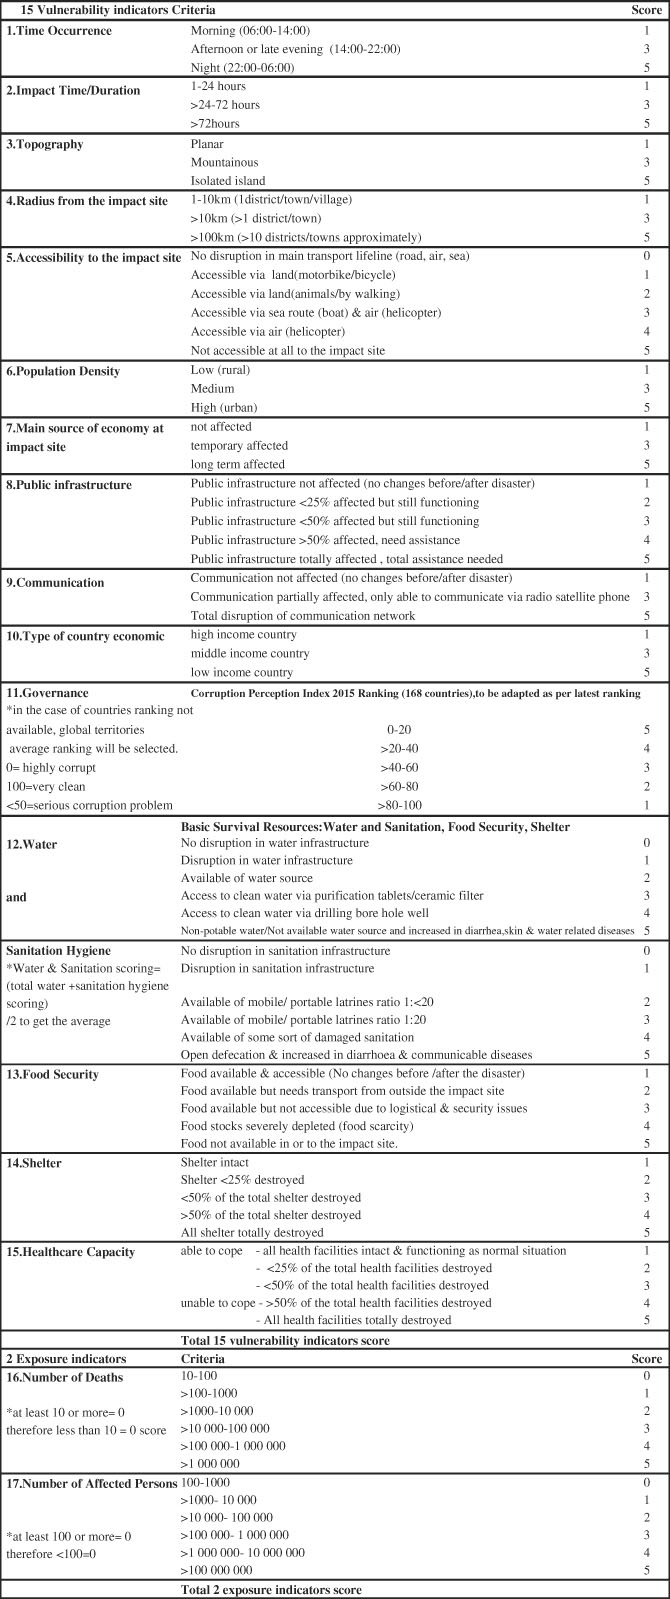
Figure 1 Scoring Criteria for the Yew DSI: 17 Vulnerability and Exposure Indicators.
Abbreviation: DSI, Disaster Severity Index.
Note: Total scoring for 17 indicators=15 vulnerability + 2 exposure indicators score. Total indicators scoring to be plotted into the Yew DSI formula: Yew DSI formula=(Total 17 indicators x3)/8.
Time Occurrence (Vulnerability Indicator)
Time Occurrence 30 , Reference Pearce, Hightower, Konkin, Megalos and Pernu 31 is mainly categorized into morning (6:00am-2:00pm), afternoon or late evening (2:00pm-10:00pm), and night (10:00pm-6:00am). Indicator scoring was based on the human physiology circadian rhythm,Reference Burgess 32 , Reference Jeffrey, Michael and Michael 33 capability in responding towards different environments. The discoveries of molecular mechanisms controlling the human circadian rhythm, by Jeffrey, Michael, and Michael,Reference Jeffrey, Michael and Michael 33 was the hallmark to human response towards environment in day-time and night-time cycles, especially during a disaster. Based on the circadian rhythm or clock,Reference Burgess 32 , Reference Jeffrey, Michael and Michael 33 the highest vulnerability score given at night was five and the lowest score given at morning (daytime) was one. Median score of three was assigned for the afternoon or late evening, which is the ability to cope within human physiological circadian rhythm. The Taiwan Earthquake 34 that occurred at night scored the highest, as most people were in deep sleep circadian rhythm.Reference Jeffrey, Michael and Michael 33
Impact Time (Vulnerability Indicator)
Impact time, one of the parameters in the Disaster Severity Scale by Jan De Boer,Reference Boer 35 was selected in this DSI, taking into account vulnerability of the timeframe impacting various natural disasters. The shorter the impact time, the lower the ranking score in the DSI with the minimum of one (1-24 hours) and maximum of five (>72hours). Score ranking of three (>24-72 hours) is the median, the baseline ability to cope within the local capacity.
Topography (Vulnerability Indicator)
TopographyReference Harper 36 was basically categorized into simple earth landscapes such as planar, mountainous, and isolated island, with the scoring from one to five. Planar scored one, the lowest; mountainous area scored three, which is the median, the ability to cope within local capacity; the isolated island scored five, which was the highest value. The scoring criteria for topography was based on the difficulty of humanitarian accessibility to the location of the impact site.
Radius from the Impact Site (Vulnerability Indicator)
The distance from the impact site was one of the parameters of the Disaster Severity ScaleReference Boer 35 by Jan De Boer. In this DSI, radius from the impact site was scored from one, the lowest (1 to 10 km) to five, the highest (>100 km or equivalent to more than 10 districts or towns, approximately). The median was three (>10 km or equivalent to more than one district or town approximately), which is the ability to cope within local capacity.
Accessibility to the Impact Site (Vulnerability Indicator)
Humanitarian accessibility to the impact site is important to measure the humanitarian needsReference Benini 9 of the disaster in the affected population. This indicator in the DSI is defined as the ability of humanitarian assistance reaching the affected population using various transportation lifelines, such as land, sea, or air. Scoring criteria of this indicator ranges from zero (no disruption) to five (total disruption in the main transportation lifelines via land, sea, and air), with the median score of three (accessible via sea route and air) as the baseline ability to cope within local capacity.
Population Density (Vulnerability Indicator)
Globally, population density was measured using the Grid Population Density of the World 37 and the UN-Adjusted Population Density 2015 38 data sets. The Grid Population Density of the World data, which were collected from the national census and plotted in the grid population of 30 arc-second persons per square km, 37 were selected for the DSI.
Assessing the population density 37 in the rural and urban areas is vital in calculating the affected population exposed to the disaster and its impact on critical facilities (public infrastructure), health care capacity, and economy. Scoring criteria of this indicator will be based on vulnerability: the higher the population density, the higher the vulnerability and thereof. This indicator scoring system ranges from minimum score of one (low or rural) to maximum score of five (high or urban), with the median score of three (mixed intersection of urban and rural) as baseline ability to cope.
Main Source of Economy at the Impact Site (Vulnerability Indicator)
Natural disasters often damage the public and private infrastructure, which may lead to the disruption of the impact sites main economy. The automotive companies (mainly Toyota, Nissan, and Honda) halted their automotive plant operation temporarily 39 due to disruption of public infrastructure following the Great East Japan Earthquake, 39 Tohoku Tsunami, 39 and Fukushima Daisha Nuclear Reactor Disaster 39 in March 2011. The scoring criteria of this indicator ranges from minimum score of one (not affected) to maximum score of five (totally affected), with median score of three (temporarily affected), which is the baseline the ability to cope within local capacity.
Public Infrastructure/Critical Facilities (Vulnerability Indicator)
Public facilities or critical facilities, which are elements of infrastructure supporting a society or community according to UNISDR, 1 that were included in this DSI are transportation system, school, and public administration. Scoring of public infrastructures is from the least affected one (public infrastructure not affected, no changes before or after disaster) to the worst affected five (public infrastructure totally affected). The median score of three (public infrastructure less than 50% affected, but still functioning) is the baseline ability to cope within local capacity.
Communication (Vulnerability Indicator)
Communication with disaster-affected communities is vital to identify their needs; depending on the severityReference Benini 9 of the natural disaster, its impact varies on the affected areas’ communication systems. Communication system scoring criteria are based on the minimum score of one (not affected) to the maximum score of five (totally affected), with median score of three (partially affected and only able to communicate via radio satellite signal phone) as the baseline ability to cope. GoTenna (Brooklyn, New York USA) 40 communication hardware, which is able to convert Bluetooth signal to Analog radio signal from smartphones to send messages, was widely used in 2012 Hurricane Sandy.
Type of Country (Vulnerability Indicator)
Type of country indicator provided by World Bank Data (Washington, DC USA) 41 is based on Gross National Income (GNI) classification into high, middle, and low-income countries, updated annually. Scoring criteria of this indicator will be based on vulnerability, as low-income countries have higher disaster death rates compared to high-income countries. 42 Therefore, the highest vulnerability score five (low-income country) to lowest vulnerability score one, (high-income country), with the median score of three (middle-income country) as the baseline ability to cope within local capacity.
Governance/Corruption Perception Index (Vulnerability Indicator)
Corruption Perception Index Ranking by Transparency International (Berlin, Germany), 43 updated annually, to measure the perceived levels of public sector corruption world-wide into each country’s governance. The index ranking scored from 100 (most corrupt) to zero (very clean), with two-thirds of the 168 countries scoring below 50 in 2015, indicating a serious corruption problem, inevitably leading to the inflated cost of the humanitarian efforts. 43 It is indirectly measuring the actual severityReference Benini 9 of the disaster, apart from physical damage to the public system and infrastructure.
The Corruption Perception Index Ranking 43 is adjusted into five ranking scores, categorized to fit the DSI scoring criteria. Maximum score of five denominates the worst in corruption (countries ranking 0-20) down to one, very clean (countries ranking>80-100). Median score of three (countries ranking>40-60) is the baseline ability to cope within local capacity. If a particular country ranking is not available, global territories average ranking will be selected.
Basic Survival Resources (vulnerability indicators)Reference Maslow 19 include Water/Sanitation and Hygiene, Food Security, and Shelter based on the concept of Marlow’s Hierarchy of Needs.Reference Maslow 19
Water/Sanitation and Hygiene (Vulnerability Indicator)
Sanitation and hygiene vulnerability indicators were based on the SPHERE 37 Minimum Standards Handbook. The availability of clean and safe water to the disaster area is more feasible in measuring the severityReference Benini 9 of a water scarcity rather than the SPHERE minimum standards in water. Scoring criteria for Water and Sanitation Hygiene=Total Scoring (Water + Sanitation Hygiene) /2.
Water scoring criteria ranging from no disruption in water infrastructure zero, to the worst five, no water source available leading to an increased in diarrhea, skin, and water-related diseases. Median score of three, access to clean water via water purification tablets or ceramic filter, was the baseline ability to cope within local capacity.
Sanitation scoring criteria, based on SPHERE Minimum Standards in sanitation 44 ranging from minimum score of zero (no disruption in sanitation infrastructure) to the worst five, with no access to improved sanitation facilities, leading to open defecation and an increased in diarrhea and communicable diseases. Median score of three, the availability of mobile or portable latrines ratio 1:20, served as the ability to cope within local capacity.
Food Security (Vulnerability Indicator)
Food is one of the most basic human physiological needs.Reference Maslow 19 The Food and Agriculture Organization (FAO; Rome, Italy) 45 food security indicators 45 on food availability and accessibility was included in the DSI. Scoring of food security ranking was based on one (food not affected before and after disaster) to the worst five (food not available at the impact site). Median score of three (food available but not accessible due to logistical and security issues) is the baseline ability to cope.
Shelter (Vulnerability Indicator)
Natural disasters exacerbated by climate change may impact shelter differently depending on the type and magnitude of it, as well as shelter resilience. Currently, 35,744,413 peoples were made homeless due to natural disasters that occurred since the year 2000,Reference Guha-Sapir, Below and Hoyois 46 showing the impact of natural disasters on shelters globally.
Scoring criteria for shelter starts from one (shelter intact) to the worst five (all shelter totally destroyed), with median score of three (less than 50% shelter destroyed), which is the baseline ability to cope with the local capacity. Therefore, more than 50% of the shelter destroyed indicates an inability to cope with the local capacity, thus needing assistance.
Health Care Capacity (Vulnerability Indicator)
Health care capacity indicator was chosen to have a wide spectrum of parameters holistically, taking into consideration the practical feasibility of information available during sudden onset disaster, and also other factors in the World Health Organization (Geneva, Switzerland) health system building blocks 47 remaining intact. Scoring criteria for health care capacity ranging from a minimum score of one (<25% of the total health facilities destroyed) to the maximum score of five (all health facilities totally destroyed), with median score of three (<50% of the total health facilities destroyed) as the baseline ability to cope.
Number of Deaths (Exposure Indicator)
The number of death tolls due to natural disasters across the world is increasing at an alarming rate. This is evidenced in the CRED-EMDAT publication “The Human Cost of Natural Disasters 2015: A Global Perspective,” 42 which reported an average death rate of 99,700 per year, from 2004 until 2013. The number of deaths according to CRED-EMDAT definitions include person confirmed dead, missing, and presumed dead, but they exclude indirect deaths from diseases or epidemics occurred after the emergency phase of the disaster. 42 , Reference Guha-Sapir, Below and Hoyois 48
The lower limit was based on the CRED-EMDAT criteria for disaster,Reference Guha-Sapir, Below and Hoyois 48 at least 10 or more killed, equaled to zero, the lowest score ranking. Therefore, the number of deaths<10 also equals to zero, a score that has no significant meaning. For the upper limit of the number of deaths, a search on CRED-EMDAT database for natural disaster, excluding biological disaster from 1900 to 2016, was done. The result was 2,000,000 deaths in the China Flood, 1959.Reference Guha-Sapir, Below and Hoyois 46 Therefore, the upper limit was set at>1,000,000 deaths, the highest score ranking equal to five.
Number of Affected (Exposure Indicator)
The CRED-EMDATReference Guha-Sapir, Below and Hoyois 48 define the term “affected” as people that required immediate assistance in basic survival resources, such as food, water, sanitation, shelter, and health care during an emergency. A significant trend of reduction in the number of “affected” people in natural disasters, from 4.3% in 1993-2003 to 2.6% in 2004-2013, 42 showed the success of the Hyogo Framework for Action 2005-2015 in Disaster Risk Reduction 49 in reducing the number of affected people. Current Sendai Framework for Action 2015-2030 50 has also been actively working on reducing the number of affected people as well.
Scoring criteria for number of affected people ranges from zero the lowest, to five the highest. The lower limit of affected people starts at 100-1,000 equal to zero; less than 100 people affected is also considered a “zero” score with no significant meaning in the scoring system. The upper limit searched was done on CRED-EMDAT databaseReference Guha-Sapir, Below and Hoyois 46 for natural disaster, excluding biological disaster from 1900 to 2016, with 300,000,000 highest affected people in the India Drought, 1987.Reference Guha-Sapir, Below and Hoyois 46 Thus, the upper limit of the affected people was set at more than 10,000,000.
Construction of the Model (Table 1)
The construction of this DSI was inspired by both the Richter Scale 5 and Modified Mercalli Intensities Scale 6 concept, as well as The Penny On-Trust working Model.Reference Dewhurst 21
Table 1 Disaster Severity Index Model Analysis

Abbreviation: DSI, Disaster Severity Index.
Note: Grand Total of Fit Xtd: Min 51; Max 255 with 17 indicators scoring 1-5; Median 3 is the decided average in 1-5 score. Max=5, Min=1. Fit Xtd Min range 0-51, whereby indicators scoring 0 instead of 1 in special situations, with grand total of Fit Xtd scored ranging 0-32, therefore it will fall into DSI 1.
Best fit DSI scale 1-8 (from total Fit Xtd score range of 0-255):
0-32=DSI 1
>32-65=DSI 2
>65-98=DSI 3
>98-131=DSI 4
>131-164=DSI 5
>164-197=DSI 6
>197-230=DSI 7
>230-263=DSI 8
From the incident reported at the actual impact site, such as an earthquake, the greater magnitudes of the Richter Scale, 5 the higher degree of total destruction (especially in urban areas) is closely aligned with the Modified Mercalli Intensities Scale 6 magnitude intensities comparison, as proven by US Geological Survey. 7 These impacts 6 are not only affecting humans, buildings, and shelters, but also the public infrastructure, health care capacity, main economy at the impact site, and also the accessibility of humanitarian response to the impact site, as shown in the Yew DSI scoring of indicators.
The Yew DSI is basically a mathematical calculation of scoring scale with similar concept to the Richter Scale, 5 and also reflected its actual effect at the impact site, similarly to Modified Mercalli Intensities Scale, 6 shown in the 17 indicators scoring. A cardinal number scale from one (minimum) to five (maximum) was chosen for each of in the 17 indicators scoring scale. A median score of three was defined as the ability to cope within local capacity. Scores above three indicate more than expected vulnerability and loss of capacity, while scores below three indicate resilience, lack of vulnerability, and increased capacity.
Scoring of the indicators weight will be fitted into the scale by multiplying three for comparison purposes in fit standard (Fit Xtd) score column and fit percentage (Fit %) column. The original score prior to adjusting to the fit standard and fit percentage will be shown in the score column. The Perfect Median fit standard (Fit Xtd) will be used to compare against the fit standard scored in each indicator. As the median fit percentage equivalent to 100% (3/3 × 100= 100%), it is also used as a baseline comparison to other indicators fit percentage scored. Therefore, the Perfect Median fit standard and median percentage will be used mainly in comparing the ability to cope within the local capacity, in line with the 2009 disaster terminology by UNISDR. 1
In comparing the DSI against the mean score, fit percentage (Fit %) was generated apart from fit standard score. Fit percentage of the indicator calculation:
 $$\eqalign{ & {\rm Fit}\,{\rm Standard}\left( {{\rm Fit}\,{\rm Xtd}} \right)\,{\rm scored}\,{\rm of}\,{\rm the}\,{\rm selected}\,{\rm indicator}\cr \!\!\qquad\div{\rm Perfect}\,{\rm Median}\,{\rm Fit}\,{\rm Standard}\,{\rm X}\,{\rm 100}\,\%;\,\cr \qquad{ Fit} {\rm }\,{\rm percentage}\,{\rm median}{\equals}{100\,\%{;}\,} \cr \qquad Fit\,{\rm percentage}\,{\rm minimum}{\equals}{33\,\%{;}\,}\,\cr \qquad{\rm Fit}\,{\rm percentage}\,{\rm maximum{\equals}167\,\%\,}{\rm .} $$
Next, the total minimum, median, and maximum score for the 17 indicators were computed as shown below.
Total minimum score for 17 indicators scoring one=1 × 3 × 17=51; however, in circumstances whereby some of the scoring for the indicators is zero, hence the minimum score will be ranging from zero to 51. Total maximum score for 17 indicators=5 × 3 × 17=255; total median score for 17 indicators=3 × 3 × 17=153.
Based on the total minimum, maximum, and median scores range for the 17 indicators, DSI scoring from one to eight with whole number and decimal points were computed. Disaster Severity Index of zero was omitted due to immeasurable meaning in the scale. The interval range between each disaster severity index is 33. The DSI formula is based on UNISDR Disaster Terminology 1 of total 17 vulnerability and exposure indicators and also working model of Penny On-Trust,Reference Dewhurst 21 by multiplying three, due to three ordinal scores of minimum, median, and maximum that best fit the DSI scale designed. It is further divided by eight to best fit the scale of the DSI scoring calculation from DSI 1-8, based on the total 17 scoring indicators upper and lower limit of the scale construction. The Yew DSI scale stop at DSI 8 as the range of the largest versus smallest disaster scores ranging from zero to 255, which best fit score of 255 is DSI 8 with the interval range of 33 in each scale from DSI 1-8. This DSI scale is further categorized into: Low DSI=1-3; Moderate DSI=4-5; and High DSI=6-8.
 $$\eqalign { {\rm Formula}\,{\rm for}\,{\rm the}\,{\rm DSI}\,\colon\,{\bf Disaster}\,{\bf Severity}\,{\bf Index}\cr {\equals}\left( {{\bf Total}\,{\bf 17}\,{\bf Vulnerability}\, \amp {\bf Exposure}\,{\bf Indicators}\,{\bf Score}} \right)\,{\bf \times 3}\,/{\bf 8}.$$
Computing 30 Natural Disasters DSI Scores
Sample size of natural disasters were selected retrospectively from 20 until it reached a pattern of saturation at a sample size 30. The sample size cut-off point was decided at 30 due to time constraints apart from reaching the saturation point.
In order to compare natural disasters across a timeline, 30 natural disasters were selected from January 2014 to June 2016. Secondary data of the natural disasters were selected from a wide range of sites, mainly: Reliefweb, 22 CRED-EMDAT,Reference Guha-Sapir, Below and Hoyois 3 and local government web sites with criteria of GLIDE number existence. Then, the 30 natural disasters obtained were scored, based on the DSI vulnerability and exposure scoring criteria in Figure 1. Examples of computing natural disasters DSI scores are shown in Table 2.
Table 2 Example of Computing Natural Disasters DSI Scores

Abbreviation: DSI, Disaster Severity Index.
Note: Computed DSI Scores Analysis
DSI categories:
Low DSI= 1-3
Moderate DSI=4-5
High DSI=6-8
Flash Flood Yemen with DSI 6.8=High DSI, whereas Earthquake Taiwan with DSI 3.7=Low DSI.
Testing the Correlation of the 30 DSI Scored versus the Indicators
Non-parametric tests were used, with a P value of<.05 was considered statistically significant. In order to obtain the best indicators, non-parametric correlation analysis was performed using Spearman Correlation Coefficient and followed by Regression Analysis with StatPlus v5 Statistical Analysis Software (AnalystSoft Inc; Walnut, California USA). 51 Non-parametric tests were chosen in this study mainly because of the small sample size of only 30, time constraint, and data availability.
Results
The results of this study are presented in two sections: (1) Comparison of the 30 Natural DSI Scores Against the Mean Score, and (2) Result of Non-Parametric Correlation Coefficient Tests between 30 Natural DSI Scores and the 17 Indicators. In order to compare Natural Disaster Severity Index Score and Mean Score, Fit Percentage Median was created and calculated as 100%, the baseline for ability to cope within local capacity.
Comparison of the 30 Natural DSI Scores Against the Mean Score 100%
From the results shown in Figure 2, 10 natural disasters scored below 100%, which has the ability to cope within the local capacity. The 10 natural disasters, ascendingly ranked, were: Earthquake Taiwan (57%), Earthquake Chile (65%), Forest Fire Russia (67%), Earthquake Chile (71%), Dzud Mongolia (80%), Forest Fire Chile (92%), Flood Algeria (94%), Earthquake Japan (96%), Drought and Frost (98%), and Flood Malaysia (98%).
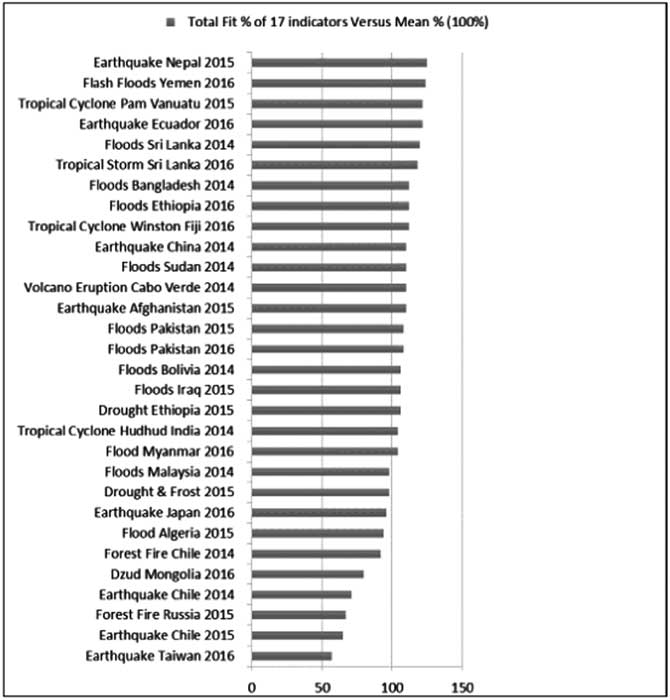
Figure 2 Comparison of the 30 Natural Disaster Severity Index Scored (Total Fit % of 17 indicators) Versus the Mean Score 100%.
This study in Figure 2 also showed that 20 natural disasters scored above 100%, which is the inability to cope within the local capacity, thus needing outside help or assistance. It has been noted while reviewing the raw data that 18 of the 20 natural disasters that scored more than 100% and also scored High DSI 6-8 in the Yew DSI, which correlated with the government response in requesting for international assistance, indicating the affected countries were unable to cope within local capacity. Two out of the total 20 natural disasters countries, China and India, that scored more than 100% and also scored Moderate DSI 5.8-5.9 in the Yew DSI, were able to cope within national and local capacity, although scoring more than 100%. Reports by UNISDR 27 highlighted that China and India had a functional multi-agencies Emergency and Disaster Activation System under their National Disaster Management Team, similar to the UNOCHA Activation System. 28
The 20 natural disasters in Figure 2 were: Flood Myanmar (104%), Tropical Cyclone Hudhud India (104%), Flood Iraq (106%), Floods Bolivia (106%), Drought Ethiopia (106%), Floods Pakistan 2014 (108%), Floods Pakistan 2015 (108%), Earthquake Afghanistan (110%), Earthquake China (110%), Floods Sudan (110%), Volcano Eruption Cabo Verde (110%), Floods Ethiopia (112%), Floods Bangladesh (112%), Tropical Cyclone Winston Fiji (112%), Tropical Storm Sri Lanka (118%), Floods Sri Lanka (120%), Earthquake Ecuador (122%), Tropical Cyclone Pam Vanuatu (122%), Flash Floods Yemen (124%), and Earthquake Nepal (125%).
Result from this study showed that 20 out of 30 natural disasters that were analyzed fit into the UNISDR disaster definitions 2009. 1 A total of 18 of the 20 natural disaster countries that scored more than 100% requested for international assistance, which evidently showed that this tool designed will enable to guide and assist various decision and policy stakeholders in future response design.
Result of Non-Parametric Correlation Coefficient Tests between 30 Natural DSI Scores and 17 Indicators
Spearman’s Rho Correlation Coefficient between DSI and Indicators—In Table 3, the Spearman’s Rho Correlation Coefficient tested the 30 DSI scores against 17 indicators. The findings showed that out of the 17 indicators, 12 indicators were found to be positively correlated; 10 indicators have shown to be significantly correlated in ranking with P values<.05. In the Spearman’s Rho test, DSI versus Food Security and DSI versus Number of Deaths had a high P value>.05. Thus, indicating a weak evidence in correlation strength, which might have been due to the small sample size of 30. Therefore, 10 significant indicators will be retained following the Spearman’s Rho Correlation Coefficient test (Table 3).
Table 3 Spearman’s Rho Correlation Coefficient of the 30 Natural Disasters DSI Scored vs Indicators

Abbreviation: DSI, Disaster Severity Index.
a Statistically significant (P<.05).
Stepwise Regression Analysis Findings
Nine variables (indicators) were finalized using stepwise regression automatic variable selection tool of the StatPlus v5 Statistical Analysis Software. The nine best subset indicators selected were mainly: Accessibility to the Impact Site, Main Source of Economy at the Impact Site, Communication, Governance (Corruption Perception Index), Water and Sanitation Hygiene, Food Security, Shelter, Health Care Capacity, and Number of Deaths. Analysis of Variance (ANOVA) had a P<.001.
From the ANOVA result showed that the P<.001 was statistically significant. This was according to the nine best set variable indicators selected using stepwise regression. In the regression Table 4, seven out of nine best subset indicators showed statistically significant with P value of<.05. Therefore, only two variable indicators, which were the Water and Sanitation Hygiene and Number of Deaths with P value of>.05 (Table 4); this might have been due to the small sample size of only 30.
Table 4 Regression Table

a Statistically significant (P<.05).
As a conclusion in this non-parametric analysis, 10 statistically significant variable indicators were selected in the DSI, mainly: Type of Country, Shelter, Public Infrastructure, Water and Sanitation Health, Communication, Governance (Corruption Perception Index), Health Care Capacity, Main Source of Economy at the Impact Site, Accessibility to the Impact Site, and Number of Affected Persons.
Discussion
To date, there is not a single tool to analyze the true scale of natural disasters affecting human lives and livelihood in a quantitative method. The DSI scoring scale takes into account 17 indicators, including the weighing of the political transparency aspect. These can be used by any stakeholders and can be adapted to various natural disasters, excluding at the moment, biological natural disasters.
After selection of vulnerability and exposure indicators by expert knowledge in the field, statistical non-parametric correlation coefficient tests of Spearman’s Rho and Regression Analysis were used to reduce bias in the selection of indicators. Taking into consideration that automatic tools, especially Regression Analysis, may select the indicators that best fit by pure chance, results of the indicators selected were critically analyzed again by expert knowledge and judgement. Therefore, 10 significant indicators were selected based on statistical analysis and critical judgement by expert knowledge.
A most important feature in this DSI definition is that it uses a baseline of 100% as the ability to cope. It is found that not all the natural disasters that are reported in the disaster databases, such as Reliefweb, 22 fitted into the category of “disaster,” impacting only on the Number of Affected Persons and the Number of Deaths. Another 15 indicators were also taken into consideration in formulating the holistically DSI scoring scale.
When is a disaster a disaster? The DSI shows a score of<100% for the Earthquake in Japan and Taiwan in 2016. This can be attributed to the Japanese and Taiwanese governments’ ability to cope with these disasters, thus needing no call for outside help. This supports the DSI in quantification of disaster, based on UNISDR terminology. It is envisaged that this DSI will be used as a guide for decision and policy makers in future response towards disaster.
Limitations
In the DSI, the main limitation was the time constraint for this study, which was four months for data analysis.
Another limitation of this DSI is that the data were extracted from international sites, such as United Nations web sites and Transparency International; 43 the secondary data collected from the impact site are considered reliable and are regarded as the best available.
The original 17 indicators in the DSI have not been tested on a wider range of natural disasters, biological natural disasters, and also complex emergency disasters.
The 10 significant correlation indicators were mainly tested on the 30 natural disasters, retrospectively. More research studies should be done on larger sample sizes of real-time natural disasters. Engaging with real-time natural disasters data from disaster centers globally will be ideal in benchmarking the real-time index with the disaster response.
Conclusion
The DSI has demonstrated the ability to quantitatively measure and compare the 30 natural disasters simultaneously and retrospectively using baseline 100% in disaster definition by UNISDR, 1 and also as a guide in future response design, as 18 of the total 20 that scored>100% requested for international assistance.


