

1. Introduction
1.1 Corporate pension liabilities are a material item in the balance sheets of many companies and are hence of interest to investment analysts, accountants, auditors as well as actuaries. The current accounting rules mean that key assumptions need to be disclosed; however, more attention has been focused on discount rates and inflation assumptions than on the underlying mortality assumptions. The current trends in longevity mean that these mortality assumptions can have a notable effect on the estimates of a company's defined benefit pension liabilities, especially in an environment where real interest rates are low (see, for example, Dushi et al. Reference Dushi, Friedberg and Webb2010 for an analysis in relation to the US).
1.2 This is the second study of the mortality assumptions used in the estimation of pension liabilities for company sponsored defined benefit pension schemes, the first having been completed in 2005 (see Verrall et al. Reference Verrall, Haberman, Sithole and Collinson2006a, Reference Verrall, Haberman, Reay and Collinson2006b). (We should clarify that we are not considering the mortality assumptions used for the purposes of the funding of pension liabilities.) Mortality tables are used in the calculation of pensions liabilities on company balance sheets, but the assumptions made can vary considerably by country. In this study, we consider the mortality tables used for these calculations throughout the EU and other selected countries, and compare them with the corresponding population tables. Thus, we compare the strength of the mortality assumptions across countries, taking into account differences in the underlying population mortality data. By referring to population data, the aim is to eliminate as far as possible differences in the mortality assumptions used in the calculation of pension liabilities which can be attributed to factors other than a decision about how strong these assumptions should be. Clearly, using a strong assumption (where life expectancy is assumed to be high) will produce higher liabilities than a weaker assumption (where retirees are expected to die sooner, on average). Given that the life expectancy assumptions have to be produced by projecting forward mortality rates from the current estimated values (Pitacco, Reference Pitacco2004; Pitacco et al., Reference Pitacco, Denuit, Haberman and Olivieri2009), it is necessary to take a view about whether life expectancy will increase in the future and, if so, by how much. This process of estimation and projection of mortality rates for use in the calculation of pension liabilities has been central to actuarial work for many years, in both the private and public provision of retirement benefits (see, for example, Booth & Tickle, Reference Booth and Tickle2008 and Pitacco et al., Reference Pitacco, Denuit, Haberman and Olivieri2009 and the references cited therein).
1.3 It would not be appropriate to move away from country-specific tables, but it is necessary to understand the extent to which there are systematic differences between standard tables that could be accounted for by methodological differences in their construction or differences in the underlying data, assumptions and projections. Such systematic differences can only be accounted for by a different view being taken within each country of these factors. While this may not cause any issues when considering each country in isolation, it can clearly cause difficulties for multinational companies in relation to any regulatory requirements, and to the valuation of a company whose liabilities move from one country's regulatory jurisdiction to another – for example through a take-over. Also, it would be best practice to share experience across countries and to question and examine the process for arriving at the mortality assumptions in order to improve and gain greater confidence across the board.
1.4 It is not the purpose of this paper to consider in any detail the method by which mortality rates are projected, or to examine any of the methodology which might be used in this process. Instead, we simply look at the results of these assumptions about the future direction of life expectancy and compare these across different countries. The rationale behind these comparisons is that, in general, a similar methodology is used within each country although we recognise that adjustments are frequently made to the “base-line” assumptions in order to try to tailor them to the particular set of lives being considered. Thus, while it may be true that there is some consistency about the assumptions used within each country, Verrall et al. (Reference Verrall, Haberman, Sithole and Collinson2006a, Reference Verrall, Haberman, Reay and Collinson2006b) found some notable differences between those assumptions that were being used in different countries. It is likely that the assumptions used in each country are arrived at through a rational process of careful consideration of all relevant factors, and yet it is still the case that this can result in quite different views about the appropriate strength of the mortality assumptions between different countries. The purpose of this paper is:
– to set out the assumptions generally used in each country;
– to compare with the underlying population mortality data;
– to illustrate the differences between countries;
– to compare the situation now with what was found in 2005;
– to illustrate the impact of the mortality assumptions on the valuation of pension liabilities, and
– to clarify what assumptions (e.g. current mortality and future mortality improvements) are mandated by the authorities.
1.5 This paper is set out in four sections. In Section 2, we give the background to the study and outline the methodology used. Also in this Section, a full description of the data is given. Section 3 contains an analysis of the data, together with comparisons across the different countries included in the study. Section 4 contains the conclusions.
2. Background, Methodology and Data
2.1 Background
2.1.1 Central to the main purpose of this paper is a comparison of the mortality assumptions currently used in European countries. For this reason, the countries covered in the study of Verrall et al. (Reference Verrall, Haberman, Sithole and Collinson2006a, Reference Verrall, Haberman, Reay and Collinson2006b) were Austria, Belgium, Denmark, Finland, France, Germany, Ireland, Italy, Netherlands, Norway, Spain, Sweden, Switzerland and the UK together with the USA and Canada. While maintaining the focus on the same European countries, the current study has been widened in scope to include Australia and Japan. Thus, the study in this paper covers the following countries:
Australia, Austria, Belgium, Canada, Denmark, Finland, France, Germany, Ireland, Italy, Japan, Netherlands, Norway, Spain, Sweden, Switzerland, UK and USA.
2.1.2 Since the 2005 study, some of the mortality tables used in these countries have been updated and changed. Unfortunately, information about any changes to the mortality tables for a number of countries has not been made available to us. For these countries, it has been assumed that the mortality assumptions used in the valuation of pension liabilities are constructed on the same basis as in the previous study. This applies to Denmark, Netherlands, Norway, Sweden and Switzerland.
2.1.3 It is essential to make all comparisons on as consistent a basis as possible. For clarity, the methodology and the data sources used are set out in detail in the following sections. There are two aspects to this. Firstly, in Section 2.2 we describe the data used to determine the mortality tables used in valuing the pension liabilities. Secondly, in Section 2.3 we give details of the data which has been used to determine the underlying level of population mortality rates. These are needed so that cross-country comparisons can be made on a consistent basis, with underlying differences in the mortality experiences in different countries removed. What then remains is the focus of this study: the strength of the mortality assumptions in relation to the current underlying population mortality rates. We examine the differences between different countries in this respect, and discuss some of the potential reasons for any differences. It is quite possible that there are valid fundamental reasons for using mortality assumptions of different strengths in different countries: for example, it is possible that the make-up of the lives constituting the pension liabilities is different in character in the different countries. If this were the case, then it would be entirely justifiable to use different relative strengths for the mortality assumptions in different countries. We believe that this study should provide useful information in the consideration of these issues, and that greater consideration should be given to the justification of any differences between countries. We would draw this matter to the attention of professional bodies, standard setting agencies and regulators of financial reporting (e.g. the Accounting Standards Board in the UK and the International Accounting Standards Board).
2.2 Methodology and Data Sources for Pension Mortality Tables
2.2.1 Since we are considering pension liabilities, we only use data for mortality rates for ages 50 and over in all of the analyses. We use similar sets of data and make the same comparisons as in the previous study. Thus, for each country, we provide tabular and graphical comparisons in order to highlight the impact of the typical mortality assumptions used to assess retirement liabilities within (defined benefit) pension fund valuations. We use a set of mortality statistics and compare them with the national population statistics: the data used for the population statistics is described in section 2.3. In this paper, we concentrate on a subset of the statistics which we have investigated: for more details of the complete analysis see Sithole et al. (Reference Sithole, Haberman and Verrall2011). The statistics that we have used in this paper are as follows:
– the probability of death (qx rates) for males and females from age 50 upwards;
– the expected future lifetime for an individual aged x years, for x from 50 upwards;
– probabilities of survival to all greater ages, conditional on reaching ages 50, 60, 65 and 70;
– the expected present value of annuities at a reference rate of interest (taken to be 3% and 6%) for:
– a male aged 50, 60, 65 and 70;
– a female aged 50, 60, 65 and 70;
– a male aged x, with a reversion of 60% to a female aged three years younger (assuming a rate of interest of 3%), where x = 60 and 65.
2.2.2 The mortality tables assumed for retirement liability purposes for each country and details of the methodology of construction of the tables have been obtained with the assistance of the IAA Mortality Task Force. The specific tables assumed in this study and those assumed in the previous study are summarised in Table 1.
Table 1 Summary of mortality tables and/or mortality experiences used in the study

2.2.3 For the UK, the CMI 2009 Projection refers to the Continuous Mortality Investigation Reference Pitacco, Denuit, Haberman and Olivieri(CMI) Working Papers 38, 39 and 41 which featured a mortality improvement projection model for practical use. A key feature of this model is the blending of the most current recent mortality experience available with a long-term rate of improvement in mortality rates. The model assumes that for the immediate future, the likely rate of improvement in mortality rates would be guided by the most recently observed actuarial experience. However, for the long term, the model takes more account of expert opinion and the available data on long term patterns of change. Thus, the model assumes that rates of mortality improvement will continue to accelerate in the short term prior to decelerating in the longer term.
2.3 Population Estimates
2.3.1 As a base-line to standardise the mortality assumptions used in each country, we employ similar methods to those described in Section 2.2, but with the national population mortality rates instead of those used in the calculation of pension liabilities. For this, we used the most recent national mortality experiences which have been obtained from the Human Mortality Database (HMD) website (http://www.mortality.org). No adjustments have been made to the data, and, in all cases, period life tables have been used to derive the relevant population mortality statistics. Period life tables are based on mortality rates derived from observations in a specific period of time. It is implicitly assumed in their construction that the mortality pattern does not change in the future and so period life tables present a static picture of the prevailing mortality patterns (Pitacco et al. Reference Pitacco, Denuit, Haberman and Olivieri2009).
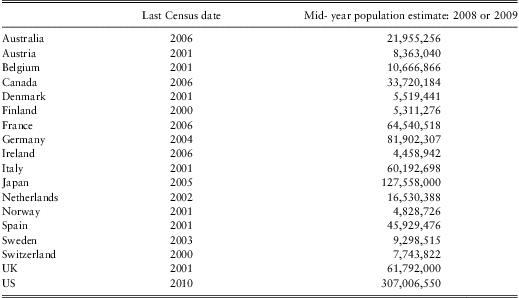
2.3.2 Table 2 shows the latest available census dates and mid-year population estimates for 2008 or 2009 for the countries covered in this study. The data have been obtained from the United Nations Statistics Division website (United Nations Statistics Division, May 2011).
Table 2 Population estimates for 2008 or 2009 and latest available census date (source: United Nations Statistics Division, Population and Vital Statistics Report: Series A, updated 4 May 2011)
2.4 Cross-Country Analysis: Methodology
2.4.1 In order to make comparisons between countries, a number of statistics have been chosen which are representative of the strength of the mortality assumptions being used. Each of these has its particular advantages and disadvantages: a single statistic can only convey a certain amount of information. For example, the life expectancy at age 65 is very easy to understand, but it may not provide enough information to enable a proper assessment of the impact of mortality on the valuation of pension liabilities. On the other hand, an expected present value of an annuity would provide better information for the comparison of liabilities, but it would also be more difficult to understand for the lay person. In the comparisons described in Section 3, we focus on age 65 and compare the following statistics:
– national probabilities of death and probabilities of death assumed for retirement pension purposes across the countries referenced for an individual aged 65;
– expected future lifetime based on mortality tables assumed for retirement pension purposes and of the population as a whole, across the countries referenced; and
– expected present value of annuities at a rate of discount of 3%.
2.4.2 A more comprehensive report has been prepared by the authors, giving detailed analyses of the data and providing many more graphs and figures (Sithole et al., Reference Sithole, Haberman and Verrall2011). In the current report, we have extracted the relevant tables and figures and presented them in a way to facilitate obtaining a good overview.
3. Cross–Country Analysis
3.1 In this section, we present some of the more significant results which illustrate the similarities and differences between the countries studied. For a more detailed analysis of each individual country, the reader is referred to the complete report: Sithole et al., Reference Sithole, Haberman and Verrall2011. Since the focus of the study is the liability of pensioners in each country, the figures presented here show some of the important results for an individual aged 65.
3.2 It should be noted that for Denmark, Netherlands, Norway, Sweden and Switzerland, the mortality tables assumed for pension benefits are the same tables assumed in the 2005 study. Mortality tables currently in use for pension benefits were not made available for these countries.
3.3 A Comparison of Current Pension Liability Mortality Assumptions
3.3.1 The first important point to note is that the underlying population mortality rates differ from country to country. Although this is a well-known phenomenon, it is clearly not something that can be ignored and it must be taken into account in any comparisons that we make of the mortality assumptions used in valuing pension liabilities. We therefore begin by considering the differences in the underlying life expectancy in each of the countries being studied. Figures 1–4 show the comparisons for males aged 65 and Figures 5–8 show the same comparisons for females aged 65.

Figure 1 Expected future lifetime for a male aged 65 from the general population: current study
3.3.2 Figure 1 shows the variation in observed population life expectancy for a male aged 65, and Figure 2 shows the variation in the typical assumed life expectancy for a male 65-year-old member of a company defined benefit pension scheme. It can be noted that there is quite a wide variation in the population mortality rates: there is a difference in Figure 1 of more than two years between Australia with the longest life expectancy and Denmark with the shortest. More importantly from our point of view are the variations in assumed life expectancy in the tables used for valuing pension liabilities, which are much wider than in the observed male population life expectancy. In this case, France has the highest assumed life expectancy of 27.5 years while Denmark has the shortest of 15.1 years: this is a difference of more than 12 years. It should be noted that for France this difference can be partly explained by the fact that the mortality rates assumed in the determination of pension benefits for both males and females are based on the female mortality experience.

Figure 2 Typical assumed future life expectancy for a 65-year old male member of a pension scheme – current study
3.3.3 Figure 3 illustrates this further by showing the difference for each country between the observed national population life expectancy and the assumed life expectancy for pensioners in company pension schemes. It can be seen that there is a wide variation here with Denmark, Netherlands, and Switzerland (using the tables assumed in the previous study) indicating that the assumed mortality tables for pension benefits give a lower life expectancy for a 65-year old male member of a pension scheme than a male from the general population. For the other countries, the greatest difference is about 9 years for France, down to about 3 months in Sweden, Japan and Norway.

Figure 3 Difference between observed population life expectancy and assumed life expectancy of a male pension scheme member aged 65 – current study
3.3.4 A similar picture can be seen by considering the ratio of the mortality rates from the tables used for pension schemes to the population mortality rates. For males aged 65 Figure 4 shows that the probability of death used in the pension scheme assumptions ranges from being 38% higher than the male population mortality in Denmark to being 75% lower in France.

Figure 4 Ratio of assumed probability of death for a male member of a pension scheme to the observed male population probability of death at age 65
3.3.5 For females, Figure 5 shows the variation in observed population life expectancy at age 65. In this case, there is a difference of 4.5 years between Japan with the longest life expectancy and Denmark with the shortest. For a female member of a company pension scheme, Figure 6 shows the variation in the typical assumed life expectancy at age 65. Again, the variations in assumed life expectancy are much wider than in the observed female population life expectancy. Spain has the highest life expectancy of 27.6 years while Denmark has the shortest life expectancy of 17.8 years, a difference of more than 9.8 years.

Figure 5 Expected future lifetime for a female aged 65 from the general population: current study

Figure 6 Typical assumed future life expectancy for a 65-year old female member of a pension scheme – current study
3.3.6 Figures 7 and 8 illustrate the differences between the population data and the assumptions made in valuing pension liabilities. Figure 7 shows the differences for each country between the observed national female population life expectancy and the assumed life expectancy for female pensioners in company pension schemes. In this case (remembering that for some countries we are using the old assumptions for pension schemes), for Denmark, Netherlands, Norway, and Switzerland, the assumed mortality tables for pension benefits would indicate a lower life expectancy for a 65-year old female member of a pension scheme than a female from the general population. For the other countries, the differences range from about 6 years in Spain to about 4 months in the USA. A similar picture is given by Figure 8, which shows the ratio of mortality rates for females aged 65. The probability of death on the basis of the assumed mortality tables for female pension benefits ranges from being nearly twice that of the female population in Switzerland to being 62% lower in Italy.

Figure 7 Difference between observed population life expectancy and assumed life expectancy of a female pension scheme member aged 65 – current study

Figure 8 Ratio of assumed probability of death for a female member of a pension scheme to the observed female population probability of death at age 65
3.3.7 It is clear from Figures 1 to 8 that there is a wide variation in the strength of the mortality assumptions made in valuing pension liabilities in the countries in our sample. This has been shown by first removing the effects of the differences in the underlying population mortality experiences in order to isolate the differences between the mortality assumptions used in each country to value the pension liabilities. This section has shown that there are currently some significant differences between the countries included in this study. A similar conclusion was reached by Verrall et al. (Reference Verrall, Haberman, Sithole and Collinson2006a, Reference Verrall, Haberman, Reay and Collinson2006b), and section 3.4 considers whether there has been a change since that study was carried out.
3.4 A Comparison With Verrall et al. (Reference Verrall, Haberman, Sithole and Collinson2006a, Reference Verrall, Haberman, Reay and Collinson2006b)
3.4.1 A similar analysis to that in Section 3.3 was performed in the previous study, and this section compares the results of these two studies in Figures 9–14. In this section, we only consider the countries covered in the previous study so that the results for Australia and Japan are not included. Note that the increase in life expectancy is measured using the period life expectancy. The current population life expectancy is based on either 2006 or 2007 experience as available from the Human Mortality Database. In the previous study, there was a much wider variation in the dates across countries: for example, for Canada the relevant dates were 1995–1997 whereas for the Netherlands it was 2003. Hence, as explained below, the annualised percentage increases provide a better guide to the changes. The dates at which the population life expectancies and the pensioner life expectancies calculated are generally different for a given country: while the population life expectancy is the “observed” value, the pensioner life expectancy is the value most likely to be assumed for pension benefits.

Figure 9 Comparison of the expected future lifetime for a male aged 65 from the general population
3.4.2 We begin with the general population data, and again consider males and females aged 65. Figure 9 shows the variation in observed population life expectancy for a male aged 65. It can be seen that, in terms of the male life expectancy at age 65, Switzerland has the highest value and Denmark has the lowest value, in both studies. However, as the population mortality experiences for individual countries relate to differing years, these differences do not give a true reflection of improvements in mortality. For this reason, we show the annualised percentage increases in male life expectancy in Figure 10. These are more representative since they are based on the actual dates of the relevant population mortality experiences in the 2005 study and the current study. It can be seen that there are significant differences between countries, with the annualised percentage increases ranging from 1.3% in Canada to 2.6% in the Netherlands. This is something that we might expect to see reflected in the strength of the assumptions used in valuing pension liabilities: if mortality rates have improved faster, then we would expect the pension liability assumptions also to have been further strengthened (assuming that the groups of lives in the pension schemes have experienced a similar rate of improvement to the overall population).

Figure 10 Annualised percentage increase in expected future lifetime since the 2005 study: male population
3.4.3 Figure 11 shows a comparison of the difference for each country between the observed national male population life expectancy and the assumed life expectancy for male pensioners, both at age 65. The only country for which the assumed mortality tables for pension benefits indicated a lower life expectancy for a 65-year old male member of a pension scheme in the previous study was Denmark. In the current study, the results for Denmark, Netherlands, and Switzerland would indicate a lower life expectancy for a 65-year old male member of a pension scheme than a male from the general population. This is most likely to be due to the fact that whilst there has been an obvious improvement in population mortality, the tables assumed for pension benefits in this study are the same as those assumed in the previous study for these countries. For the other countries, the differences range from over 9 years in France to about 3 months in Sweden, Japan and Norway.

Figure 11 Difference between observed population life expectancy and assumed life expectancy of a male pension scheme member aged 65 – current study and 2005 study
3.4.4 Similarly for females, Figure 12 shows the variation in observed population life expectancy for a female aged 65. As in the previous study, France has the highest female life expectancy at age 65 and Denmark has the lowest. Again, the interpretation of this figure may be somewhat unclear because of the differences in the dates used for the population mortality data. Hence, Figure 13 shows the annualised percentage increases in female life expectancy based on the actual dates of the relevant population mortality experiences in Verrall et al. (Reference Verrall, Haberman, Sithole and Collinson2006a, Reference Verrall, Haberman, Reay and Collinson2006b) and the current study. The annualised percentage increases range from 0.7% in Canada and Sweden to 1.7% in The Netherlands. For each of the countries shown, the average rates of mortality improvement in the female population are lower than the average rates of mortality improvement in the male population, suggesting that long term convergence is being assumed between the mortality rates for males and females.

Figure 12 Comparison of the expected future lifetime for a female aged 65 from the general population

Figure 13 Annualised percentage increase in expected future lifetime since the 2005 study: female population
3.4.5 Having first considered changes in the life expectancy in the population, Figure 14 shows a comparison of the difference for each country between the observed national female population life expectancy and the assumed life expectancy for female pensioners. Comparing with Verrall et al. (Reference Verrall, Haberman, Sithole and Collinson2006a, Reference Verrall, Haberman, Reay and Collinson2006b), it can be seen that the assumed mortality tables for pension benefits indicate a lower life expectancy for a 65-year-old female member of a pension scheme for Denmark and Switzerland only.

Figure 14 Difference between observed population life expectancy and assumed life expectancy of a female pension scheme member aged 65 – current study and 2005 study
3.4.6 In Sections 3.3 and 3.4 we have concentrated on life expectancy as a measure of the strength of the mortality assumptions used in valuing pension liabilities. Life expectancy is easy to communicate and understand, but it may not be the best measure when used in this context. For this reason, we consider a different statistic in Section 3.5.
3.5 A Comparison Using Annuity Values
3.5.1 Having considered life expectancy at age 65 in sections 3.3 and 3.4, this section makes a comparison based on discounted annuity values. When considering pension liabilities, it may be more appropriate to base the comparison on annuity values since these are likely to show how the actual values of the liabilities are likely to differ. In relation to the public disclosure of mortality assumptions, the relative advantages of different summary measures were also discussed in Verrall et al. (Reference Verrall, Haberman, Sithole and Collinson2006a, Reference Verrall, Haberman, Reay and Collinson2006b). As before, we believe that life expectancy is probably more intuitive and understandable, but the annuity value is probably better for a discussion of the valuation of the liability. In Figures 15–17, comparisons are shown based on an annuity value for a male aged 65 with a 60% reversionary widow's pension for a female aged 62. Figure 17 reflects the differences between countries that have also been shown in Figures 3 and 11.

Figure 15 Present value at 3%, of an annuity of 1 paid annually to a male member of the general population, starting one year after attaining age 65(includes reversionary widow's pension

Figure 16 Typically assumed present value at 3%, of an annuity of 1 paid annually to a male member of a company pension scheme, starting one year after attaining age 65 (includes reversionary widow's pension)

Figure 17 Percentage difference between assumed male mortality table annuity present value at 3%, and observed male population annuity present value, (includes reversionary widow's pension)
3.5.2 Pension liabilities are driven by the discounted value of annuity payments, and the mortality assumption can have a significant impact on the liabilities in company balance sheets. This can be illustrated by considering a pension scheme with liabilities of £1000 m if calculated using assumptions generally used in the UK. Figures 18 and 19 compare a liability of £1000 million based on the assumptions for a UK pension scheme member (Figure 18 involves scaling relative to an assumed long term improvement rate in mortality rates for the UK of 1% pa and Figure 19 involves scaling relative to an assumed long term improvement rate in mortality rates for the UK of 1.25%pa) to the equivalent liability if the assumptions were those assumed for each of the countries in the study. The figures show that, for example, the liabilities based on the mortality assumptions used in France are higher than in the UK, whilst the liabilities based on the mortality assumptions used in Germany are lower than if based on the assumptions used in the UK.

Figure 18 Comparison of male pension liability (age 65) taking UK as a base (assuming a long-term mortality improvement rate of 1% for the UK): equivalent liability of £1000 million for the UK

Figure 19 Comparison of male pension liability (age 65) taking UK as a base (assuming a long-term mortality improvement rate of 1.25% for the UK): equivalent liability of £1000 million for the UK
4. Conclusions
4.1 The conclusions of this study are similar to the previous study, in that the results indicate that current practice varies considerably across the EU. It is to be expected that the mortality assumptions used in company pension schemes should vary from country to country, due to variations in underlying population mortality as well as in variations of the profile of typical membership of a company pension scheme. However, it appears that, as with the previous study, the variations in mortality assumptions are much greater than would be justified by these factors alone. We are not aware whether there has been any further work done in this context since our first study, but we would suggest that this is now overdue. In particular, we believe that it would be worthwhile investigating whether the observed variation is due to the fact that some countries incorporate an allowance for expected future improvements in mortality, while others use tables that relate to mortality observed over a period in the past, without allowing for the fact that life expectancy continues to increase.
4.2 We acknowledge that our study is affected by some limitations regarding the basis of the comparisons presented. Thus, the pension liabilities to be found in the company accounts of different countries may be different in character – for example, the pension system in France is dominated by pay-as-you-go provision delivered by national arrangements and it is likely that only the liabilities for senior managers would appear in company accounts. Similarly, the maturity of pension liabilities is likely to vary between and within countries: our use of mortality indices for comparison purposes based on age 65 needs to be seen in the light of this caveat.
4.3 Verrall et al. (Reference Verrall, Haberman, Sithole and Collinson2006a, Reference Verrall, Haberman, Reay and Collinson2006b) suggested that the effect of the difference in mortality assumptions could be viewed in terms of an “equivalent” difference in the discount rate. This is illustrated in Figures 20 and 21, which show the discount rates that must be used when the mortality assumptions from other countries are applied, in order to get the same liabilities as for the UK assumptions. Again, this is done using the two assumptions for mortality improvement in the UK. It can be seen that there is a significant difference between countries, and that the effect of this is emphasised by viewing it in terms of the discount rate; for example, we note a wide range of discount rates in Figure 20 corresponding to differences (compared to the UK assumption) of between +181 basis points and -114 basis points.

Figure 20 Discount rate compared to 3% for the UK (1% mortality improvement rate), equivalent to change in mortality table (male age 65, includes reversionary widow's pension)

Figure 21 Discount rate compared to 3% for the UK (1.25% mortality improvement rate), equivalent to change in mortality table (male age 65, includes reversionary widow's pension)
4.4 Figures 20 and 21 reinforce the conclusion from this paper, and also from the previous study, which is that greater consistency and clarity should be sought in the assumptions underlying the calculation of pension liabilities.
Acknowledgements
The study is an update and extension of the original study which was funded by the UK Actuarial Profession and a group of firms of consulting actuaries. Summaries of this can be found in Verrall et al. (Reference Verrall, Haberman, Sithole and Collinson2006a, Reference Verrall, Haberman, Reay and Collinson2006b) and the complete report is available on request from the authors. This project was requested by the IAA Mortality Task Force because new mortality tables have been adopted in some countries since the original study, and, in many cases, the population mortality data have also been updated. The underlying research work has been funded by the UK Actuarial Profession through the Mortality Research Steering Group. We would also like to thank the anonymous scrutineers for their helpful comments.


